Teaching Human Genetics with Mustard: Rapid Cycling Brassica rapa (Fast Plants Type) as a Model for Human Genetics in the Classroom Laboratory
Abstract
We have developed experiments and materials to model human genetics using rapid cycling Brassica rapa, also known as Fast Plants. Because of their self-incompatibility for pollination and the genetic diversity within strains, B. rapa can serve as a relevant model for human genetics in teaching laboratory experiments. The experiment presented here is a paternity exclusion project in which a child is born with a known mother but two possible alleged fathers. Students use DNA markers (microsatellites) to perform paternity exclusion on these subjects. Realistic DNA marker analysis can be challenging to implement within the limitations of an instructional lab, but we have optimized the experimental methods to work in a teaching lab environment and to maximize the “hands-on” experience for the students. The genetic individuality of each B. rapa plant, revealed by analysis of polymorphic microsatellite markers, means that each time students perform this project, they obtain unique results that foster independent thinking in the process of data interpretation.
INTRODUCTION
Rapid cycling Brassica rapa, also known by the trademarked name Wisconsin Fast Plants, are an ideal organism for instruction. They complete their life cycle in 35–45 d (Williams and Hill, 1986) and grow at room temperature in potting soil fertilized with commonly available house plant fertilizer. Their only unusual requirement is intense fluorescent lighting 24 h/d, which can be supplied by conventional fluorescent bulbs. For complete information on B. rapa culture, please visit the Wisconsin Fast Plants website (http://www.fastplants.org). B. rapa are used for a wide range of instruction including, but not limited to, botany, ecology, physiology, and genetics (http://www.fastplants.org). In this article, we report on the addition of human genetics modeling to their repertoire of instructional use.
Despite being members of the plant kingdom, B. rapa can be used as a relevant model organism for teaching human genetics because they share two important features with humans: 1) they do not self-pollinate, and 2) they are genetically diverse. Even though they have perfect flowers, they are self-incompatible for mating (an individual plant will reject its own pollen), so it is very easy to mate two individuals by simply transferring pollen from one to another with no risk of self-pollination. If seeds are then collected from only one of the partners, it becomes the “mother” and the other must be the “father,” and, by properly arranging matings, any type of human family structure can be easily replicated. Self-incompatibility also preserves genetic diversity within B. rapa strains. Members of the same strain of B. rapa, such as the Fast Plants strains obtained from Carolina Biological Supply (Burlington, NC), may be superficially uniform because they are true-breeding for a particular leaf color, stem color, or hairiness, but analysis of DNA markers reveals that in fact each individual plant is genetically unique. In this article we describe how we have taken advantage of these features to model paternity testing.
We describe below a project in which students use molecular markers to perform paternity exclusion using B. rapa as model humans. The project can easily be completed within one semester and only requires four plants per student. We have developed methods for DNA marker analysis that can be performed in a minimally equipped college teaching laboratory and allow the students to directly experience DNA purification, polymerase chain reaction (PCR), and gel electrophoresis. Using these techniques, the students obtain true experimental data. Each family is genetically unique so each student must interpret the bands in their gels to determine genotypes and evaluate the informativeness of the data to draw conclusions about paternity.
THE PATERNITY EXCLUSION PROJECT
To create a paternity dispute with the B. rapa, one cotton swab is rolled over the anthers of two different plants (Alleged Fathers 1 and 2). The pollen-laden swab is then used to pollinate a third plant (the Mother). Seeds from the Mother are sown, and one seedling is used as the Child (Figure 1). While each plant is still growing, a leaf is collected, pressed, and dried. The students then purify DNA from a 1-cm2 piece of dried leaf of each of the four parties in this dispute. Once students have obtained DNA of adequate quality and quantity, they determine the genotype of all individuals for two different DNA markers (Table 1) and use this data to determine if either father can be excluded. A sample schedule for this lab project in one 15-wk college semester is given in Table 2.

Figure 1. Schematic of a simple mating scheme to create a paternity dispute with B. rapa.
| Week | Activity |
|---|---|
| 1 | Mate Mother and Alleged Fathers Collect and press leaf tissue |
| 2 | Purify DNA |
| 3 | Purify DNA |
| 4 | Evaluate DNA quality and quantity |
| 5 | Collect and sow seeds of Child |
| 6 | Collect leaf tissue of Child |
| 7 | Purify Child DNA |
| 8 | Evaluate DNA quality and quantity Start PCR reactions |
| 9 | Run gels of PCR products |
| 10 | Time for redo if needed |
| 11 | Time for redo if needed |
| 12 | Time for redo if needed |
The students use microsatellite DNA markers to test paternity. Microsatellites are small islands of (usually) noncoding DNA in the form of a short two- or three-nucleotide sequence such as cytosine-adenine repeated in tandem several times (CAn). What makes them so useful in genetics is that for any given microsatellite, individuals in a population will vary in the length of the repeat sequence, and these variant forms (alleles) are transmitted from parent to offspring by the same rules of inheritance as all genes. When PCR is used to replicate the DNA surrounding and including the microsatellite, the different repeat lengths result in different length DNA (Litt and Luty, 1989; Weber and May, 1989). When these fragments are separated by gel electrophoresis followed by staining of the gel to detect DNA, the result is that different alleles of a microsatellite can be identified as different bands on a gel (Figure 2). Microsatellite markers for Brassica have been developed by several groups around the world. The Multinational Brassica Genome Project website (MBGP, 2003) provides information on hundreds of microsatellite markers from various sources, as well as information on the work in progress to map and sequence the genomes of Brassica species.
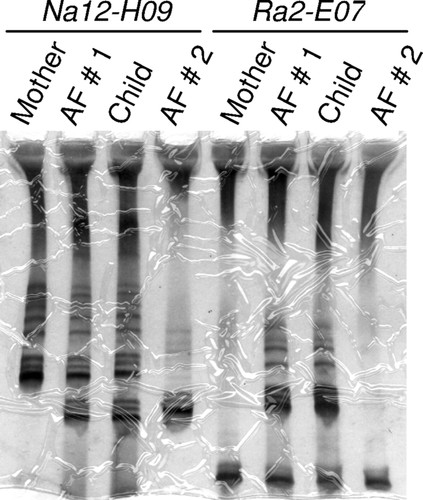
Figure 2. Example of a gel in which a student was successful in obtaining microsatellite genotype data for two different microsatellite markers for all individuals in the experiment. Based on Na12-H09 genotype, neither father can be excluded, but based on Ra2-E07 genotype, Alleged Father (AF) 2 can be excluded.
Conceptually, the most important part of the learning experience with the B. rapa paternity exclusion project is the students' experience extracting information from the bands on their gel. Because the B. rapa strains are genetically diverse (like humans), even when students are successful with the techniques for obtaining microsatellite genotypes, it remains for them to determine how much actual information they can extract from the data for the purpose of paternity exclusion. An example of this can be seen in Figure 2. The marker Na12-H09 does not provide information in the case shown. The Child is heterozygous for Na12-H09 and, by process of elimination, one can determine that the higher mobility allele must have come from its father, but both alleged fathers have that allele. However, based on genotypes for the marker Ra2E07, Alleged Father 2 can be excluded. He is homozygous for an allele that the child has, but that must have come from the Mother. Alleged Father 1, on the other hand, cannot be excluded because he has an allele that the child could only have inherited from its father. Results such as these occur because each individual used to initiate the mating has a unique genotype that is not known until completion of the experiment. This makes each run of the project a true experiment, i.e., something in which the outcome cannot be predicted with certainty. The instructor has the ability to shape and model with the students in the lab how scientists use their skills to make inferences, use real data, and draw conclusions from those data.
We set up the experiment so that one Child is obtained per mother so that each student personally carries out the entire project, but an alternate design where each student raises a different Child from the same set of parents would reduce the number of plants and DNA preparations needed in the class as a whole while still giving each student a unique experiment. Because all parents are outbred, when many seeds are collected and sown from the same mother, the genotype of each Child cannot be predicted from that of its siblings. Also, because the Mother was pollinated with a mixture of pollen from two Fathers, the paternity of each sibling is an independent event.
Although our emphasis is on the use of the DNA markers, traits with Mendelian inheritance can also be used for markers in paternity exclusion. Two plant color mutations that can serve this purpose are anthocyaninless (anl), which is a complete lack of purple anthocyanin pigment, and yellow-green (ygr), which is a trait of yellowish green stems and leaves compared with the normal dark green. If the Mother is both yellow-green and anthocyaninless (ygr/ygr anl/anl), while one Alleged Father is yellow-green only (ygr/ygr ANL/ANL) and the other Alleged Father is anthocyaninless only (YGR/YGR anl/anl), it will always be possible to exclude one father. (This is the same logic as the “Who's the Father” kit that has been developed for Wisconsin Fast Plants and available through Carolina Biological Supply.) These traits could be used as a backup in case students fail to obtain interpretable data from their DNA marker analysis. This also provides a teaching opportunity for the instructor to compare the differences in the nature of data between the simple true-breeding traits versus highly polymorphic molecular markers. (As of this writing, we have not had any cases where the color phenotype marker data disagree with the microsatellite marker data.)
GETTING (MEANINGFUL) DNA MARKERS TO WORK IN A TEACHING LAB
A major challenge that we faced in our effort to develop the paternity exclusion project was getting microsatellite marker analysis to work within the technical, budgetary, and timing constraints of a teaching lab. Typically, biology teaching labs are less well provided for than research labs in terms of both equipment and supply budget. Scheduling also imposes constraints; although the scientist will stay in the lab as needed to carry out experiments, lab courses may be limited to a defined period of time and only meet once per week. Therefore, we sought to develop methods for the paternity exclusion project that required only the most basic lab equipment and were achievable in a lab course that meets as little as once per week for a 3-h period.
Although analysis of DNA such as restriction fragments of a plasmid is commonly performed in teaching labs, we initially found microsatellite analysis difficult to carry out in that environment. Microsatellite polymorphism results from variation in the length of short repetitive DNA elements. When amplified by PCR, different alleles of a microsatellite marker produce different lengths of DNA fragments that are distinguished by gel electrophoresis (Litt and Luty, 1989; Weber and May, 1989). However, agarose gels, which are commonly used for DNA analysis in teaching labs, are not well suited to resolve the small fragments and the small differences between fragments produced by PCR of microsatellite marker DNA. The PCR products of microsatellite markers are typically on the order of 100–300 base pairs in length with alleles typically differing from each other by just a few base pairs. In research labs, high-resolution electrophoresis methods such as large-format denaturing polyacrylamide gels or capillary electrophoresis are used (Schwengel et al., 1994). Neither of these techniques is practical for the teaching lab because of the sophistication of technique and specialized equipment needed as well as the expense of reagents. Furthermore, all of the methods typically used to detect the PCR products in the gel have a level of hazard that makes it difficult for students to use them independently. Radioactive labeling is hazardous to novice users, fluorescently tagged primers are expensive and require specialized equipment, poststaining of gels with the fluorescent dye ethidium bromide involves the dual hazards of an intercalating agent and intense UV light, and poststaining of gels with SYBR Green I stain is expensive and still requires either UV light or a fluorimager.
Finally, even if the latest state-of-the-art equipment is available, it may actually not be the best choice for scientific education. It is too likely that the opportunity for active experimentation by the student will be replaced by passive viewing of a demonstration by the instructor. This passive type of instruction encourages the stereotype that science experimentation is for someone else, namely, the expert running the machine. This can contribute to college students missing out on real experience in the activities basic to science and science-related careers.
THE TEACHING LAB-COMPATIBLE METHODS THAT WE EMPLOYED
Complete protocols for the methods that we used are available at our project website (http://personalwebs.oakland.edu/%7Ewendell/Mustard.htm). The following is a summary of these methods followed by points in the protocols that we have found to require more intensive coaching or intervention by the instructor.
As mentioned previously, students preserve leaf tissue from their plants by simply drying it. For this, they make a miniature plant press consisting of paper towel, corrugated cardboard, and a rubber band. The method we use for purifying DNA (below) can also be done on fresh tissue. We have chosen to dry the tissue because it removes the need for a freezer in the lab to store the tissue. Storing tissue for later use is very important because it allows students to repeat the DNA purification if their first attempt is unsuccessful.
We discovered early on that the choice of purification method is important when working with B. rapa leaf tissue. Some purification methods that we tested yield DNA that appeared to be of high quality but did not support PCR; we presume that this is due to contamination with polyphenolics (Koonjul et al., 1999). We found that a simple lysis and organic extraction method (Edwards et al., 1991) yielded DNA of sufficient quality and quantity for PCR of microsatellite markers.
When using dried leaf tissue for DNA preparation, the tissue must first be minced to a powder, and the mincing process can present problems for students who have a weak understanding of contamination issues such as passing tissue particles via tools not cleansed properly between uses. We also found it necessary to repeatedly impress on the students the need to be diligent and take care so that their sample did not get scattered or contaminated during mincing. In addition, students needed to develop the patience to continue mincing until their sample was a fine powder so that the extraction process would be efficient. Although it was useful to discuss what we meant by a fine powder, the best way to teach this was to have students begin mincing and let them know when their tissue was macerated well enough. When they performed the technique a second time, they were able to identify the right end point independently.
Students also needed training to recognize the DNA pellet produced by ethanol precipitation at the end of DNA purification. Purification of DNA from a small sample of leaf yields a small, barely visible pellet. Most students were initially unable to identify this pellet (many doubted its existence) but, because the process was repeated, they soon learned to recognize the pellet that results from a successful purification. Many were also skeptical that a barely visible pellet represents success. Initially some students believed that a very large pellet, which they sometimes obtained because of carbohydrates copurifying with the DNA, was more desirable. This type of product again becomes a very useful tool and teachable moment for the instructor who can use the subsequent data set to demonstrate that the large pellet is actually undesirable.
As a technique to evaluate the quantity and quality of genomic DNA preparations, gel electrophoresis provides hands-on experience and a visual result for the student. Measurement of DNA concentration is routinely done in research labs with a spectrophotometer or a fluorescence-based assay such as Pico Green (Invitrogen, Carlsbad, CA). However, the necessary instrumentation may not be available in a teaching lab, and these quantification methods do not indicate the quality of the DNA. We have found that evaluation of quality (the average molecular weight of the fragments) is essential for this project because the students sometimes obtain DNA that is too degraded to support PCR. Therefore, to evaluate their genomic DNA, the students run about one-tenth of each preparation in a nondenaturing polyacrylamide minigel, such as a MiniProtean apparatus (Bio-Rad, Hercules, CA), and then visualize the DNA in the gels by silver staining. Genomic DNA run in a gel produces a “smear.” The intensity of the staining of this smear indicates the quantity of DNA, and the average molecular weight indicates whether or not the DNA is degraded (Figure 3). On each gel they also run standards, which are samples of high-molecular-weight B. rapa DNA provided by the instructor who prepared them under the best of procedures and quantified them by Pico Green binding assay. If the DNA is degraded, then students have time to re-extract DNA from their tissue samples. The use of silver staining avoids the choice between the hazards of ethidium bromide or the expense of SYBR green, and the entire process can be completed within a single 3-h lab period; the polyacrylamide minigels take only 45 min to run, and the silver staining can be completed in approximately 1 h.
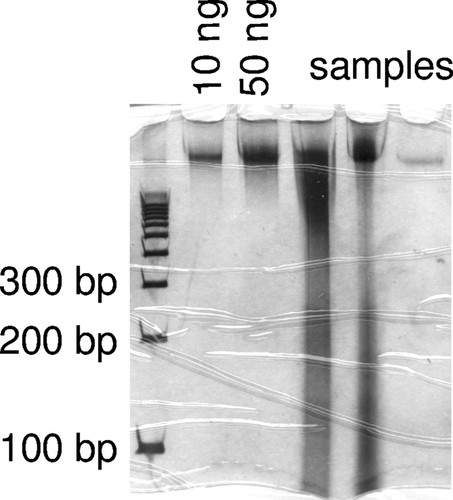
Figure 3. Example of a silver-stained polyacrylamide minigel used by students to evaluate the quality and quantity of their DNA preparations. High-quality DNA (i.e., present as high-molecular-weight fragments) is visible as a smear near the top of the gel, and the intensity of the stain indicates quantity. Lanes 2 and 3 were loaded with 10 and 50 ng, respectively, of high-quality B. rapa DNA. Each of lanes 4–6 are different samples of DNA purified by a student in the lab course. The student found that the samples loaded into lanes 4 and 5 were suitable for PCR. The sample loaded into lane 6 was inadequate so s/he returned to the pressed leaf tissue collected from that plant and performed a new DNA preparation.
Setting up PCR reactions from stocks of Taq, buffer, nucleotides, and MgCl2 can be problematic because the students must combine very small volumes of a variety of reagents, and their errors can be very expensive for the lab budget. Although there is value in having students do all of the dilution calculations needed to assemble a PCR reaction and being forced to be diligent in their technique, we have gone to simpler methods. We have found that using beads containing all reagents except template and primer, such as PureTaq Ready to go PCR beads (GE Healthcare Life Sciences, Piscataway, NJ) is worth the expense.
Finally, the students use polyacrylamide minigels to resolve the microsatellite PCR products. The polyacrylamide minigels provide sufficient resolution to distinguish microsatellite marker alleles for the markers that we use in our class, and silver staining is sensitive enough to detect the bands of the microsatellite alleles (Figure 2). Not all microsatellite markers can be clearly resolved by this method, but we have found a set of markers that do so reliably, as described below. After staining, the gels can be dried onto white filter paper or scanned with a document scanner for a permanent record for the student to analyze. Scanning the files and comparing the data in class provide the instructor with an indication of student understanding and interpretation and allows the instructor to determine first hand what students do not comprehend.
We note that microsatellite markers can be resolved in agarose gels (Becker and Heun, 1995), but it requires special agarose such as MetaPhor and NuSieve agarose (Cambrex, Walkersville, MD) because conventional agarose cannot give the necessary resolution of small fragments needed to distinguish alleles. However, we have not had satisfactory results with such gels for this project. It is a technical aspect that should be explored further because it would make the exercise available to instructors who do not have vertical gel apparatus available in their teaching lab.
MICROSATELLITE MARKERS FOR B. rapa
Because the Brassica genus contains many important crop plants, a large and growing number of microsatellite markers have been developed (MBGP, 2003), but we find that they vary in how well they work on B. rapa using the techniques described above. Therefore, we screened a large set of markers based on a series of criteria that reflect their suitability to the teaching laboratory. First we identified those that would amplify a band from B. rapa DNA that was easily detectable by silver staining of gels. Second, we tested for polymorphism in common strains of B. rapa available from Carolina Biological Supply. Third, we chose the polymorphic markers for which the size difference between alleles made them easy to distinguish on a nondenaturing polyacrylamide minigel. The markers Na12-H09 and Ra2-E07 (Lowe et al., 2004) have been most useful (Table 1).
An additional criterion for the selection of markers was low production of extraneous bands. When microsatellite PCR products are resolved on nondenaturing polyacrylamide gels, a series of extraneous bands of higher molecular weight can be observed (Figure 4), which makes it more difficult for the students to read their gels. However, after some training, the students are able to independently distinguish the microsatellite allele from the artifact bands. These artifacts are produced by the denaturation and reannealing of PCR products without extension during the later cycles of PCR, and their production can be minimized by limiting the number of PCR cycles (Bovo et al., 1999). Therefore, the thermal cycling protocol used for PCR must be optimized to find the minimum number of cycles that produce a consistently detectable product. It has been our experience that these extraneous bands can be reduced but not eliminated because the reduction of cycles needed to eliminate most of them reduces the sensitivity of detecting the bands of the microsatellite alleles. The best way to combat this problem is to choose markers that have the lowest tendency to produce these extraneous bands.
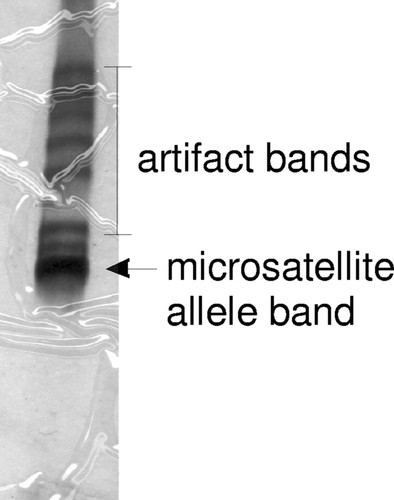
Figure 4. When microsatellite PCR products are resolved on nondenaturing polyacrylamide gels, in addition to the expected band from amplification of the genomic DNA, many extraneous bands are also observed.
RESULTS FROM USING THE PROJECT IN GENETICS LAB
To evaluate these materials, we used this paternity exclusion project in a general genetics laboratory course that accompanies a sophomore/junior-level general genetics lecture course at Oakland University. (Our evaluation plan was reviewed and approved by the Oakland University Institutional Review Board and ruled exempt. All student participation was by consent.) We made observations on the project both for technical success (Did the methods work in the hands of the students?) and for teaching of concepts (Did the students understand what they were doing and learn important concepts of genetics?). Evaluation of technical success came from in-class observation and examination of students' experimental results. The evaluation of the learning of concepts came from an examination of final lab reports compared with a pretest given at the beginning of the semester, from in-class observations, and from interviews with student volunteers. Because we wanted the students to respond as freely and honestly as possible, the faculty member who evaluated the students' responses (D.P.) did not share specific student responses by name with the faculty member who graded the students' work for the course (D.W.).
Although our objective was to evaluate the specific materials for the paternity exclusion project, our observations also provided insights on the students' general preparation for lab work. From the baseline data collected at the beginning of the semester, we knew that more than 80% of the students had little to no experience using simple equipment common in teaching labs. We observed inappropriate technique in the most basic of molecular biology methods such as measuring with micropipettors and mixing the microliter-scale volumes of liquids as must be done for DNA purification and analysis. Without specific and direct discussion about how to use the micropipettes, some liquids end up at the top of vials, whereas other components get pipetted to the bottom or middle of the vials. Detection of this problem and coaching of proper technique reduced this problem.
Generally, there are three points in this laboratory project at which students may experience technical failure: obtaining DNA, staining of gels, and setting up PCR reactions. At each of these points, students were given the opportunity to repeat the step. It became evident to us how critical it is that time for students to redo things be built into the class schedule. As scientists, we all know that science is about experimentation, and we also know that experiments do not always work. Students should learn to improve their technique and to be accustomed to the idea of having to do something over if it does not work the first time. [It should be noted that technical failure is one of the reasons teachers cite for not doing experimentation in science with children (Fuller, 1969; American Association for the Advancement of Science, 1998).]
Success in DNA purification is defined as a preparation of DNA that is not degraded and has at least 10 ng/μl (Figure 3). In the genetics laboratory course, students had a success rate of at least 80% for the first attempt on each sample. Among failed preparations, low yield was the most common problem. Occasionally we have observed degraded DNA, as evidenced by no high-molecular-weight material but only a low-molecular-weight smear. In the event of a failed purification, students were allowed a second attempt, and all second attempts were successful.
Failure to obtain microsatellite genotype data can occur either because a PCR reaction did not produce a product or because the silver staining of the gel failed. In all gels, the DNA size standard (Apex 100-base pair low DNA ladder; Genesee Scientific, San Diego, CA) allowed the students to determine if a bad result was due to failure of their PCR (DNA ladder visible but no microsatellites) or their staining (neither DNA ladder nor microsatellite bands visible; Figure 5A). Failure in staining appeared to be due to either excessive incubation with the developing solution or simply using the wrong reagent at a given step in the protocol. Both types of failure were reduced with repeated experience (Figure 5B). In the case of a failed PCR reaction, it appeared that the most common reason was error in combining the components of the reaction mixture, because a second attempt performing PCR from the same original DNA sample was almost always successful.
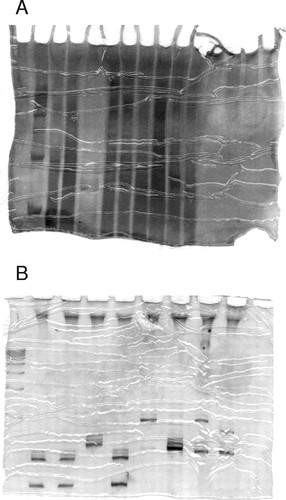
Figure 5. Two gels demonstrating the value of giving the students a second attempt. The student's first gel of his/her microsatellite PCR products (A) was overstained and the resolution of the microsatellite bands was poor. The student was allowed to repeat the PCR and gel with much better results (B).
All students attempted to genotype their subjects for two different microsatellite markers, and most obtained enough data to work with. Almost two-thirds of students obtained microsatellite data on all four of their individuals for at least one marker. Among the rest, almost all still obtained enough data to perform interpretation. Only one-eighth of students obtained genotype data on all four of their plants for both markers (as in Figure 2), and out of a class of 29 students, only one failed to obtain any microsatellite genotype data by the end of the semester.
An example of incomplete data that can still provide the student with experience in interpretation is given in Figure 6, in which the student was unable to obtain marker data for the Mother. In the analysis, the student first had to realize that because of missing data from the Mother, both of the Child's alleles must be viewed as potentially coming from its father. (Compare this to the results of a different student shown in Figure 2 in which the Child is heterozygous, but it can be clearly determined which of its two alleles came from the Mother.) In this run of the experiment, the correct conclusion is that the available data do not allow the exclusion of either Alleged Father. Note that though the case shown in Figure 6 was unsuccessful for paternity exclusion, it was fully successful for requiring the student to practice analytical thinking skills.
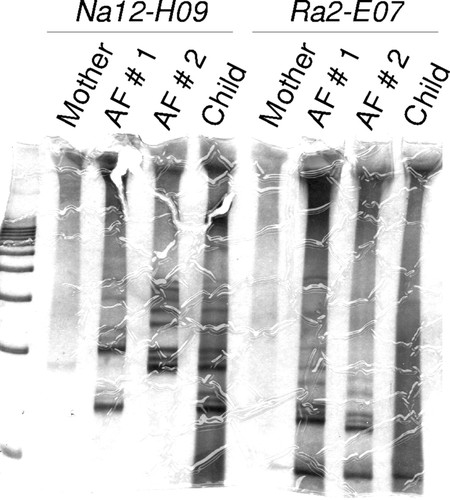
Figure 6. Example of a gel in which a student did not obtain microsatellite data on all individuals in the experiment but was still able to perform some analysis. Data are missing for the Mother. The student can still perform analysis, though with the given data, neither Father can be excluded.
The effect of the lab on conceptual learning was more difficult to evaluate because most students in the genetics lab course were taking the genetics lecture at the same time. However, we were able to draw a few conclusions. We knew from the same baseline data set that roughly two-thirds of the students had difficulty answering simple inheritance questions about Mendelian genetics. These students, for example, could not articulate inheritance patterns given a specific example. By the end of the paternity exclusion laboratory experience, all students asked during exit interviews could explain and respond to questions about linkage relationships and inheritance patterns, using data sets or information different from their own data set. More importantly, however, all laboratory write-ups from all students enrolled in the genetics class clearly indicated that they had an understanding of the paternity exclusion concepts and could interpret their own data sets appropriately. (Copies of the format for laboratory write-ups can be obtained at http://personalwebs.oakland.edu/%7Ewendell/Mustard.htm.) Student responses in independently conducted focused interviews before, during, and after the completion of the course indicated that students were able to articulate a growing depth of understanding both of laboratory techniques in DNA extraction processes and interpreting data collected from PCR and silver staining. Laboratory write-ups also indicated understanding of specific processes and data interpretation. A critical component to student understanding of this paternity exclusion laboratory exercise was instructor observation and questions posed to students as they conducted their laboratory work. For example, the believability factor discussed previously was an issue (e.g., if a sample substance cannot be seen with the naked eye, it does not exist) for students.
In summary, in this article we have described the development, use, and evaluation of a series of what we believe to be cost-effective, paternity exclusion laboratory exercises suitable for a 14- to 16-wk undergraduate genetics laboratory course. The protocols used have been successfully implemented for 2 yr and have provided students with opportunities to develop technical laboratory skills and gain confidence in using common laboratory apparatus. Additionally, students were able to successfully collect and interpret unique data sets from DNA extraction, purification, PCR, and gel electrophoresis, having enough time to repeat procedures where necessary. The ability to repeat procedures allowed students to critically reanalyze their procedures and refine their techniques, giving them confidence in their abilities to conduct viable investigations and draw conclusions from their unique data sets. We invite the reader to download protocols and instructor manuals from our project website (http://personalwebs.oakland.edu/%7Ewendell/Mustard.htm), use them in college laboratory settings, and provide feedback. We are especially interested in determining whether our findings are replicated and in ways to further improve the protocols.
ACKNOWLEDGMENTS
We thank the reviewers for useful suggestions about the experiments. Oakland University undergraduates Letizia Judd and Evelyn Miller provided valuable assistance in the lab in the development of these materials and lab manuals. This work was funded by the National Science Foundation Division of Undergraduate Education Grant 0340910 and by an Educational Development Grant from the Oakland University Senate Teaching and Learning Committee.


