Make Microarray Data with Known Ratios
We want to share with CBE—Life Sciences Education readers a free resource that will benefit teachers and students alike. We have developed an electronic resource (Spot Synthesizer; www.bio.davidson.edu/projects/GCAT/Spot_synthesizer/Spot_synthesizer.html) that permits faculty to generate simulated DNA microarray data for use in their teaching. The Spot Synthesizer allows teachers to produce novel microarray data output in just a few minutes, and these data can be used for training and testing purposes.
Since the seminal paper by DeRisi et al. (1997), DNA microarrays have become an increasingly powerful and popular research tool. The most common use for DNA microarrays is to measure, simultaneously, the level of gene expression for every gene in a genome. A single microarray is a glass slide with a tiny spot of DNA for each gene in the genome; yeast microarrays contain ∼6500 spots for the 6500 genes in the yeast genome (for an animated overview, see Campbell, 2000). Typically, the level of experimental mRNA expression is measured relative to a control sample of mRNA. The two populations of mRNA are converted to cDNAs, tagged red and green, incubated with the spotted DNA on the microarray, and scanned to detect the hybridized cDNA. Red gene spots were active in one condition, green spots indicate genes active in the other condition, whereas yellow spots represent genes active in both conditions. Two tiff image files, representing the intensity of each color for all spots on the microarray, are the raw data output from a DNA microarray experiment. The final step is to quantify the intensity of each color for each spot on the microarray and to calculate a ratio to determine relative gene expression levels for every gene in the genome.
The development of microarrays for research was followed shortly by the use of DNA microarrays in education and research by undergraduates through the Genome Consortium for Active Teaching (GCAT; Brewster et al., 2004; Campbell and Heyer, 2004; Bradford et al., 2005; Campbell et al., 2006a, 2006b, 2007; Kushner, 2007) as well as other projects (Kumar, 2005). Use of DNA microarrays is technically more challenging than the typical undergraduate laboratory protocol, but students have been successful on many campuses. However, undergraduates very quickly learn what research scientists have found in working with DNA microarrays: data production is easier than data analysis. To help students learn how to analyze microarray data, GCAT has developed data analysis software (MAGIC Tool) that works on all computer platforms, is free for everyone, is simple to learn, and provides educational benefits due to its flexibility in algorithms and parameters (Heyer et al., 2005). The one tool still lacking has been an easy way to generate data output in the form of images showing spot intensities (tiff files) with known ratios for experimental and control cDNAs, for use in training and testing students.
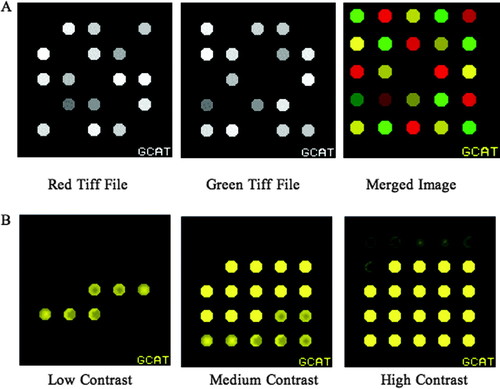
We have developed a Web-based tool called the Spot Synthesizer that enables faculty to generate their own tiff files for student use. The Spot Synthesizer is simple to use; it requires only a Web browser, a program that can produce tab-delimited text files (e.g., Excel), and access to the Internet. Instructors simply produce a set of three columns: one column for the gene name, one column for the intensity of red signal (from 0 to 65,535), and one column for the intensity of the green signal (from 0 to 65,535). The Spot Synthesizer produces two grayscale tiff files, one file for each color (Figure 1A). The images are produced five spots to a row and as many rows as are needed. Spot Synthesizer always completes the last row by inserting blanks if necessary to facilitate analysis in MAGIC Tool. A gene list is produced as well, although the instructor also can use the first column of the tab-delimited file submitted to Spot Synthesizer. The benefit of the Spot Synthesizer is that instructors can produce novel images within minutes for students to use for practice. If real experimental tiff files are used, students must spend large amounts of time gridding the microarray rather than learning how to analyze data given the user-defined options. Using Spot Synthesizer, students can spend more time learning how to analyze the data. Later, the Spot Synthesizer can be used again to produce new tiff files for proficiency testing before working with experimental data sets. Because the instructor generated the files, it is easy to check student work for correct results, which presents the option of generating new test questions for evaluation purposes.
Figure 1. Data output from Spot Synthesizer. (A) Spot Synthesizer produces two tiff files that are downloaded from the results Web page; constant pixel values. The merged image is from an intermediate step of analysis using MAGIC Tool. Note that the colors and intensities vary for the 25 spots. (B) Six spot patterns are available: doughnut-shaped, center-weighted, and crescent with no random variation, and the same three general shapes but with 20% random noise added to each iteration. The six patterns are shown at three different intensities. MAGIC Tool allows the user to adjust the contrast, which illustrates the patterns are present but can be swamped by too much intensity in a given spot.
In addition to the default spot type—consistent spots with the same value at every pixel—we have added the capacity to produce spots with random variation (uniform or normal distribution), or with one of six predetermined patterns (Figure 1B). The purpose of these patterns is to provide a more realistic image in which the spots are not perfect. Furthermore, students can experiment with different algorithms for quantifying spots and determine whether the shape of the spot affects the outcome. The spot variation capacity of Spot Synthesizer is easy to use; simply tell Spot Synthesizer which of the six patterns you want to use by entering numbers 1–6 in a slightly expanded tab-delimited text file (four columns instead of three).
In closing, we have developed Spot Synthesizer, a Web-based electronic resource that teachers can use to train students how to analyze microarray data and to assess their proficiency. Spot Synthesizer can be used free of charge by anyone and is ideal for teaching students how to analyze microarray data, especially undergraduates and high school students who want to go beyond the wet lab DNA simulation described in Campbell et al. (2006b).
ACKNOWLEDGMENTS
This work was supported by Howard Hughes Medical Institute grant 52005120 (to Davidson College); National Science Foundation grants DBI-0099720, DBI-0520908, and DBI-0627478; and Davidson College.


