Assessing the Influence of Field- and GIS-based Inquiry on Student Attitude and Conceptual Knowledge in an Undergraduate Ecology Lab
Abstract
Combining field experience with use of information technology has the potential to create a problem-based learning environment that engages learners in authentic scientific inquiry. This study, conducted over a 2-yr period, determined differences in attitudes and conceptual knowledge between students in a field lab and students with combined field and geographic information systems (GIS) experience. All students used radio-telemetry equipment to locate fox squirrels, while one group of students was provided an additional data set in a GIS to visualize and quantify squirrel locations. Pre/postsurveys and tests revealed that attitudes improved in year 1 for both groups of students, but differences were minimal between groups. Attitudes generally declined in year 2 due to a change in the authenticity of the field experience; however, attitudes for students that used GIS declined less than those with field experience only. Conceptual knowledge also increased for both groups in both years. The field-based nature of this lab likely had a greater influence on student attitude and conceptual knowledge than did the use of GIS. Although significant differences were limited, GIS did not negatively impact student attitude or conceptual knowledge but potentially provided other benefits to learners.
INTRODUCTION
Problem-based learning (PBL) is learner-centered approach to education that allows students to “conduct research, integrate theory and practice, and apply knowledge and skills to develop a viable solution to a defined problem” (Savery, 2006). First developed in the 1950s and 1960s, PBL has become popular in science education as it engages students, develops higher-order thinking skills, improves knowledge retention, and enhances motivation (MacKinnon, 1999; Dochy et al., 2003; Savery, 2006). Techniques for creating PBL environments vary, but field experience is often cited as an effective tool to increase student interest and learning by creating an authentic, interactive atmosphere in which students can creatively solve problems (Kern and Carpenter, 1984; Karabinos et al., 1992; Walker, 1994; Hudak, 2003). In addition, use of computers and other instructional and information technologies can support PBL and has also been shown to increase motivation and conceptual knowledge (Kerfoot et al., 2005; Taradi et al., 2005).
One such technology is geographic information systems (GIS). GIS has long been used by researchers as a tool to store, manage, analyze, and display spatial data, but they are also increasingly being used by educators as a means to support PBL (Summerby-Murray, 2001; Drennon, 2005). GIS has the potential to enhance learning by creating a student-centered inquiry environment, creating links between policy and science to help students solve real-world problems, enhancing interdisciplinary learning, enabling students to use the same tools as professionals, and being accessible to a wide range of learners (National Research Council [NRC], 2006). These functions of GIS in education meet the NRC's recommendations for effective learning, which include creating an environment that is learner-, knowledge-, assessment-, and community-centered (NRC, 1999). In addition, GIS has been shown to improve student attitude by increasing the relevance of the subject to the student (West, 2003).
Despite the increased interest in GIS in the classroom, there is much discussion as to the appropriate use of GIS in an education setting (Brown and Burley, 1996; Chen, 1998; Bednarz, 2004). The lack of teacher training, unavailability of computer resources, inherent complexity of GIS, and time spent teaching technology at the expense of science content are some barriers to bringing GIS into the classroom (Lloyd, 2001; Baker, 2005). Additionally, the effectiveness of GIS in terms of student impact is still under debate. This is due, in part, to scant empirical evidence as to its effectiveness as a teaching tool. Much of the literature that considers impacts of GIS in teaching is based on subjective, anecdotal case studies. Some research, however, has shown potential benefits for GIS to be used in secondary and undergraduate classrooms. For example, AP high school students that used GIS outperformed college undergraduate students who did not in terms of geographic skills and concepts (Patterson et al., 2003). Using GIS has also improved high school students' interest in geography and was particularly helpful in raising final course grades for average and below-average students (Kerski, 2003). Lloyd (2001) reports that most students in an undergraduate geography course valued their time spent on computer-based instruction as opposed to other learning styles and concluded that “students learn at least as well using computer-based instructional materials as they do with traditional approaches to learning.” However, another study found that undergraduate student performance in a geography course was similar between those that used computer-based maps and those that used paper maps, but students preferred paper maps because of a general dislike of computers and the inability to view the entire map on the computer monitor (Pedersen et al., 2005). Likewise, Proctor and Richardson (1997) found little improvement in learning outcomes of students who used a multimedia GIS in an undergraduate human geography course.
The inconsistencies reported between studies illustrate the need for further understanding of the effects of GIS on student attitude and conceptual knowledge under different learning environments. Furthermore, most research on GIS education in undergraduate classrooms has been conducted in geosciences and assessed impacts on students' spatial abilities, but no study considers the use of GIS as a means to teach ecological concepts. While some suggest that integrating field experience with technology may improve student motivation and understanding (Lo et al., 2002), research combining field experience with GIS is limited, and it is unknown whether the field exercise or GIS has more of an impact on student attitude and learning. The objectives of this study were to (1) compare attitudes and knowledge gain between students in a field lab and those with field and GIS experience and (2) determine whether GIS could be used in an introductory ecology lab to enhance knowledge of ecological concepts without the need for students to have a fundamental understanding of GIS technology. Of additional interest was how field versus GIS exposure might affect attitudes and conceptual knowledge based on student grade level, major, and achievement level.
METHODS AND ASSESSMENT
Participants and Experimental Design
This study was conducted in an undergraduate Fundamentals of Ecology Laboratory at Texas A&M University during fall of 2004 (year 1) and fall of 2005 (year 2). The lab served as an elective science course for nonscience majors and a required course for natural-science majors. Ten lab sections were included each year with up to 14 students per lab. Data analysis was based on 102 students in year 1 and 100 students in year 2 according to students' willingness to participate and numbers of completed surveys and tests.
This course was designed as a field-based inquiry lab addressing fundamental principles of ecology and methods of ecological inquiry. Teaching methods included a short lecture-style introduction to ecological concepts followed by field-based research and hands-on data collection. All 10 sections were taught in this traditional way, but five sections (referred to as Field+GIS) were randomly selected to include the addition of GIS. In year 1, an informal headcount indicated that few students had ever used GIS (up to two students per section), and in year 2, 24 students indicated that they had taken a course that included instruction on GIS. The same instructor taught all 20 sections over both years.
All students were instructed in the basic principles of habitat features and requirements (e.g., food, cover, disturbance) and spatial attributes (e.g., habitat size and adjacency, distribution, and density of patch types). They were then introduced to the Aggie Squirrel Project in which researchers at Texas A&M were tracking fox squirrels (Sciurus niger) on campus fitted with radio collars for the purpose of gaining an understanding of urban fox squirrel population ecology (McCleery et al., 2005). Students were instructed to make a prediction describing what type of habitat squirrels would utilize on campus and why. They were divided into groups of three to four students and given frequencies of collars for specific squirrels and radio telemetry equipment to locate them. The data students recorded included the location of each squirrel, a description of the general environment, and estimates of distances from squirrels to walkways, buildings, trees, and open grassy fields. In year 2, most of the batteries in the squirrels' collars had expired making the tracking exercise impossible, but the collars had not yet been removed from the squirrels. In an attempt to maintain the consistency of the experience between years, the instructor hid active collars in trees, and students were instructed to use the telemetry equipment to find them. In addition, students were given the radio frequency of an active collar on one squirrel, but this squirrel was never located. Some students reported locating collared squirrels they thought they were tracking, but a few students found the collars in the trees. At the conclusion of the experiment the instructor explained that the collared squirrels they had seen were not the ones they were actually tracking and that the collars were placed in trees as an attempt to duplicate an authentic experience. Following the field exercise, the students returned to the lab to discuss their findings and to compare them with initial hypotheses.
The five Field+GIS sections were then provided an additional 1300 squirrel locations that were obtained by the Texas A&M researchers and imported into a GIS (ArcView 3.2a). Students were able to view squirrel locations represented by points on an aerial photo image of campus (Digital Ortho Quarter Quadrangle). They were then given step-by-step instructions on how to generate grids of distances of squirrels to trees and squirrels to buildings. The databases created in ArcView were exported to Microsoft Excel to create frequency distributions of distances of squirrels to trees and buildings. The results of these analyses were compared with original student-generated hypotheses, and additional question and hypothesis formulation ensued. The entire procedure was conducted during one 3-h lab period.
Following the year 1 study, it was recognized that the time of exposure to the concepts in the lab was different between the groups as the Field+GIS labs took 30–45 min longer to complete than the Field-only labs. To equalize the time of exposure in year 2, an additional discussion was given to the Field group following the field exercise. During the discussion, the instructor provided information on the habitat requirements and features of fox squirrels in rural environments, and the students discussed similarities and differences between these features with those they encountered on campus.
Learning Products and Assessment
A five-scaled pre/postsurvey, composed of 27 attitude questions adopted from West (2003), was used to assess students' attitudes toward the ecology course. The five scales included attitudes and perceptions of (1) how much effort students put into the course, (2) relevance of the subject to the student, (3) satisfaction level, (4) performance, and (5) understanding. A five-point Likert scale was used to measure the level of agreement of the student with the statement, with a score of 5 = Strongly Agree, 4 = Agree, 3 = Neutral, 2 = Disagree, and 1 = Strongly Disagree. The same attitude survey was used both years. A rubric was developed to assess students' responses to a pretest and posttest to determine gains in understanding of conceptual knowledge based on teaching methods. The rubric assessed conceptual understanding of habitat features, spatial attributes, and techniques of wildlife population sampling. The same pretest was given in both years; however, the posttest used in year 1 to determine conceptual understanding was partially invalid as it was spatially oriented in nature. This test may have focused students' attention on spatial attributes at the expense of habitat features (see Results and Discussion) or given students less of an opportunity to comment on habitat features than on spatial attributes. The posttest used in year 2 was adjusted to match the pretest to more accurately assess student understanding of all three concepts of interest. Cohen's kappa (Cohen, 1960) was used to determine interrater reliability for the use of the rubric. Initial kappa between two raters for 15 tests was 0.63. Following additional rater training, kappa improved to 0.82.
The magnitude of change from pre- to postsurvey and test scores within treatment groups was assessed using Cohen's d effect size analysis (Cohen, 1988). A value of 0.20 was considered a small effect, 0.50 was considered a medium effect, and 0.80 was a large effect (Cohen, 1992). In addition, multivariate analysis of variance (MANOVA) procedures were used to determine significant changes from pre- to postassessment scores for Field and Field+GIS groups separately. MANOVA was also used to determine significance of time (changes from pre- to postassessment scores) by treatment interactions (Field vs. Field+GIS). Analysis of covariance (ANCOVA) was used to determine differences between treatments (Field and Field+GIS groups) with preassessment scores used as covariates. This analysis revealed whether one group changed significantly more than the other from pre- to postassessment scores. MANOVA and ANCOVA analyses were also performed to determine treatment effects based on categories of students, namely class (underclassmen and upperclassmen), major (science and nonscience majors), and achievement level. Achievement level was based on pretest grades, which were used to separate students into higher (the top half of the scores) and lower (the bottom half of the scores) achievement groups. Statistical analyses were performed in SAS version 9.1 (SAS Institute, Cary, NC).
RESULTS
Attitudes
In year 1, attitudes for both Field and Field+GIS groups generally improved from pre- to postsurveys as indicated by effect sizes (Figure 1a), although the magnitude of the changes were small (d = 0.3 or less). There were few significant differences between groups (Figure 2). Nonscience majors in the Field+GIS group showed a significant improvement over the Field group in Effort (ANCOVA, F = 5.41, P = 0.03) and a slight increase in Relevance (ANCOVA, F = 3.46, P = 0.07). However, higher achieving students in the Field group showed a slightly greater increase in Understanding scores than those in the Field+GIS group (ANCOVA, F = 2.94, P = 0.10). Scores for Effort, Relevance, Performance, and Understanding increased for some categories of students, but there were no differences between Field and Field+GIS groups (Figure 2). Satisfaction scores remained the same for all categories of students for both Field and Field+GIS groups.
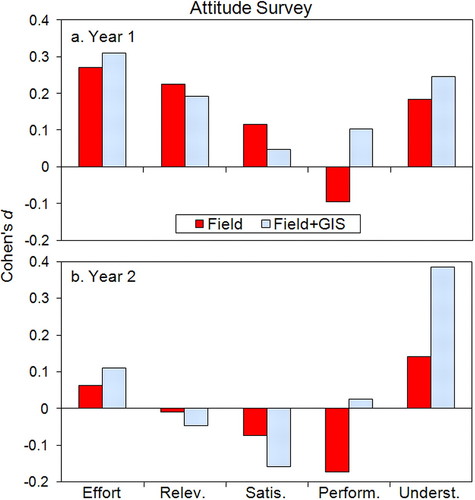
Figure 1. Results of effect size analysis on attitude surveys from the Field and Field+GIS groups in (a) year 1 and (b) year 2. Interpretations of the scales on the x-axis are as follows: Effort reflects students' perceptions of how much effort they put into the course; Relev. indicates relevance of the subject matter to the students; Satis. indicates students' level of satisfaction with the course; Perform. measured students' perceived performance; and Underst. indicates how well students felt they understood the course material.
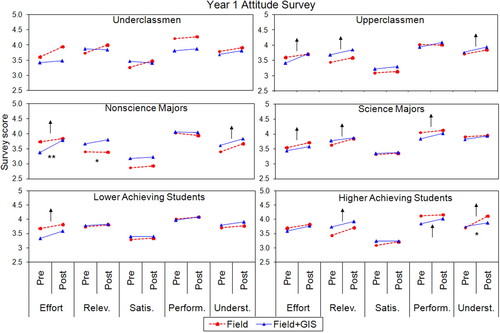
Figure 2. Pre/postsurvey scores from year 1 measuring changes in student attitude. Arrows indicate a significant change from pre- to postsurveys (MANOVA, P < 0.10). The direction of the arrow indicates a significant increase or decrease from pre- to postsurvey scores within groups. A single arrow indicates that scores for both Field and Field+GIS groups changed in the same direction. Opposing arrows indicate an increasing score for one group and a decreasing score for the other group. Asterisks (* and **) indicate significant changes between Field and Field+GIS groups at P < 0.10 and 0.05, respectively, based on ANCOVA. Interpretations of abbreviations used on the x-axis are the same as described for Figure 1.
In year 2, changes in attitude were negligible (Figure 1b). Unlike year 1 when changes were positive, attitudes declined in the Relevance, Satisfaction, and Performance scales, but the Field+GIS group indicated a small to medium increase in their perception of understanding (d = 0.38). MANOVA also indicated significant increases in understanding for upperclassmen, science and nonscience majors, and higher achieving students, but there were no differences between Field and Field+GIS groups (Figure 3). Scores for the Satisfaction scale declined for underclassmen in both groups (MANOVA, F = 4.28, P = 0.05, Figure 3), but ANCOVA results indicated the score for the Field+GIS group declined slightly less than the Field group (F = 3.05, P = 0.10). Satisfaction scores also declined for science majors and higher achieving students, but there were no differences between Field and Field+GIS groups (Figure 3). ANCOVA and MANOVA analyses indicated that the Field+GIS scores for Performance increased from pre- to postsurveys for upperclassmen, science majors, and higher achieving students, but scores declined in these three categories for students in the Field group (Figure 3). Effort scores remained the same for all groups of students.
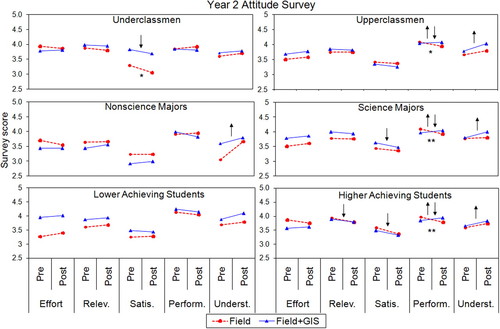
Figure 3. Pre/postsurvey scores from year 2 measuring changes in student attitude. Arrows indicate a significant change from pre- to postsurveys (MANOVA, P < 0.10). The direction of the arrow indicates a significant increase or decrease from pre- to postsurvey scores within groups. A single arrow indicates that scores for both Field and Field+GIS groups changed in the same direction. Opposing arrows indicate an increasing score for one group and a decreasing score for the other group. Asterisks (* and **) indicate significant changes between Field and Field+GIS groups at P < 0.10 and 0.05, respectively, based on ANCOVA. Interpretations of abbreviations used on the x-axis are the same as described for Figure 1.
Conceptual Knowledge
Effect size analysis of pre- and posttests in year 1 revealed a small improvement in conceptual knowledge for the Field group as indicated by total score (d = 0.29), but little change occurred in the Field+GIS group (d = 0.10, Figure 4a). Scores for habitat features declined for both groups, but the Field+GIS group's decline was large (d = −0.94). Alternatively, scores for spatial attributes increased for both groups, but scores improved more for the Field+GIS group (d = 0.99 and d = 1.41 for Field and Field+GIS groups, respectively; Figure 4a). MANOVA analyses corroborate effect size results in that conceptual knowledge of spatial attributes, population sampling techniques, and total scores generally increased for both Field and Field+GIS groups, while scores on habitat features generally declined (Figure 5). However, habitat scores for underclassmen, nonscience majors, and lower achieving students in the Field group increased significantly, while those in the Field+GIS group decreased.
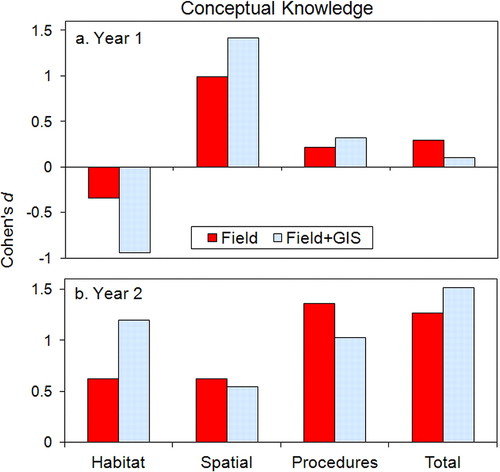
Figure 4. Results of effect size analysis on tests of conceptual knowledge from the Field and Field+GIS groups in (a) year 1 and (b) year 2.
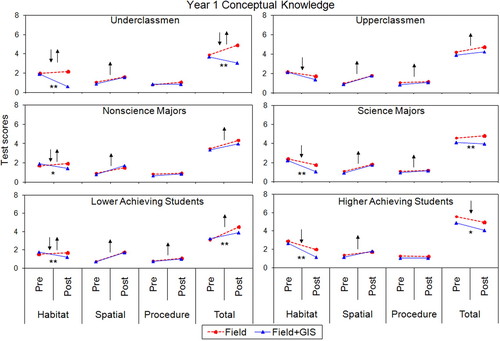
Figure 5. Pre/posttest scores from year 1 measuring conceptual understanding of habitat features, spatial attributes, population sampling techniques (labeled “procedures”), and total scores. Arrows indicate a significant change from pre- to posttests (MANOVA, P < 0.10). The direction of the arrow indicates a significant increase or decrease from pre- to posttest scores within groups. A single arrow indicates that scores for both Field and Field+GIS groups changed in the same direction. Opposing arrows indicate an increasing score for one group and a decreasing score for the other group. Asterisks (* and **) indicate significant changes between Field and Field+GIS groups at P < 0.10 and 0.05, respectively, based on ANCOVA.
In year 2, scores improved for all components of the test for both groups (Figure 4b). Knowledge of habitat features increased more for the Field+GIS group (d = 1.20) than the Field group (d = 0.62). ANCOVA also showed a small change in scores on habitat features between groups (ANCOVA, F = 3.06, P = 0.08), while MANOVA indicated increases for Field and Field+GIS groups in almost all categories (Figure 6). Scores on habitat features improved more for upperclassmen and science majors in the Field+GIS group than in the Field group (ANCOVA, F = 5.57, P = 0.02 and F = 4.62, P = 0.03, respectively), but scores for wildlife population sampling procedures improved more for higher achieving students in the Field group than in the Field+GIS group (ANCOVA, F = 3.07, P = 0.09).
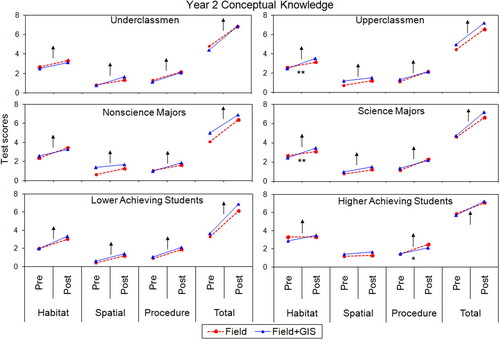
Figure 6. Pre/posttest scores from year 2 measuring conceptual understanding of habitat features, spatial attributes, population sampling techniques (labeled “procedures”), and total scores. Arrows indicate a significant change from pre- to posttests (MANOVA, P < 0.10). The direction of the arrow indicates a significant increase or decrease from pre- to posttest scores within groups. A single arrow indicates that scores for both Field and Field+GIS groups changed in the same direction. Opposing arrows indicate an increasing score for one group and a decreasing score for the other group. Asterisks (* and **) indicate significant changes between Field and Field+GIS groups at P < 0.10 and 0.05, respectively, based on ANCOVA.
DISCUSSION
Attitudes
In year 1, student attitudes improved from pre- to postsurveys (Figure 1a); however, the extent of the improvement varied between groups of students and for different scales. Nonscience majors in the Field+GIS group reported a greater increase in perceived effort and relevance of the subject than nonscience majors in the Field group, and higher achieving students' perception of understanding increased more for the Field group than the Field+GIS group (Figure 2). Although there were some differences between treatment groups, these differences may be outweighed by the fact that attitudes improved for both treatment groups in effort, relevance, understanding and, to a lesser degree, performance. The nearly equal improvement in attitude between the Field and Field+GIS groups indicates that something other than the GIS treatment improved students' attitudes. Because the field experience was similar for both groups of students, it is probable that improved attitudes resulted from the field-based nature of the lab. This finding is in agreement with Hudak's (2003) report that students enrolled in introductory geoscience courses preferred outdoor lab exercises to indoor lab exercises because they viewed outdoor lab exercises to be more interactive, interesting, and realistic. Additionally, Karabinos et al. (1992) found that outdoor field exercises make students active participants, thus creating enthusiasm for the subject. The field portion in this lab probably generated similar enthusiasm as attitudes improved for students in both Field and Field+GIS groups.
With the exception of students' perception of understanding, attitudes in year 2 changed little or declined from pre- to postsurveys (Figure 1b). It is again thought that the field component of the lab had greater impact on attitude than the use of GIS. In year 2, students did not track radio-collared squirrels because the batteries in the collars had expired. Instead, students tracked collars that had been previously hidden in trees. Although some students reported finding squirrels with collars, many students expressed frustration and displeasure in not finding the squirrels. This resulted in decreased attitudes for some of the students as satisfaction scores declined for underclassmen, science majors, and higher achieving students (Figure 3). However, there were some significant time by treatment interactions; scores for the Field+GIS group increased on the performance scale while scores for the Field group declined. Perhaps using a novel technology such as GIS to create a problem-based learning environment helped to compensate for students' displeasure with the field experience. It has been reported that GIS coupled with field observation increases motivation (NRC, 1999), and in an undergraduate geomorphology course, Wentz et al. (1999) found that students enjoyed and valued the use of GIS when coupled with more traditional teaching methods. Likewise, Lo et al. (2002) reported high satisfaction from students enrolled in an environmental literacy class that used a combined GIS-field approach. Although not definitive, the results of this study corroborate these previous findings as well as indicate that GIS helped dampen the effects of a disappointing field experience.
Tangential to the impacts of GIS, but nonetheless important, are the differences in attitude between years. These differences are likely due to the change in authenticity of the field experience. Authentic scientific inquiry is rarely taught in classrooms; science taught in schools is often done through simplified scientific tasks. These simple tasks, however, do not represent cognitive processes required for authentic scientific inquiry (Chinn and Malhotra, 2002), nor do they maximize the potential for students to become engaged and motivated (Stronge, 2002). As student motivation is a vital component of learning (Northwest Regional Educational Laboratory, 2001), authentic scientific inquiry should be used in undergraduate classrooms to foster critical thinking, enhance engagement, and maximize motivation (Oliver, 2006). The results of this study clearly indicate the difference in students' attitude when an authentic experience is conducted (in year 1) and when they are exposed to a fabricated science experience (in year 2).
Conceptual Knowledge
Because the instrument used in year 1 to determine change in conceptual knowledge was ineffective, meaningful comparisons between years are difficult to make. However, comparisons can be made between treatment groups within the same year, and those comparisons yield interesting results. First of all, scores on habitat features declined for both groups in year 1, but knowledge of spatial attributes improved (Figure 4a). This is thought to be a result of the spatial nature of the posttest in year 1 not lending itself well for students to be able to address questions related to habitat features. But while scores on habitat features declined for both groups, between-group comparisons show large and significant differences in the performance of students as the Field+GIS group scored worse than the Field group (Figures 4a and 5). Effect size analysis shows a threefold difference in the magnitude of the decline between groups. Although interviews with students would be needed to determine reasons behind these results, it follows that because GIS is a tool used to view, analyze, and manipulate spatial data, students who used GIS and then were given a test that was predominantly spatial in nature might have focused more heavily on the spatial aspect of the test at the expense of questions regarding habitat features. Students in the Field+GIS group may not have had a poorer understanding of habitat features than the other students, but their attention may have been drawn toward what they were more familiar with. Students in the Field group did not have GIS to reinforce spatial concepts, and therefore may not have been influenced the same way as the Field+GIS group in completing the test. This interpretation is consistent with student responses to the spatial attributes section of the test where the Field+GIS group improved more than the Field group.
In year 2, the posttest was changed to more accurately assess student understanding of all three concepts of interest. Students' conceptual knowledge increased in all categories for both groups, but there were some differences between groups in habitat features and population sampling techniques. The Field+GIS group scored higher than the Field group on habitat features (Figure 4b). This was particularly true for upperclassmen and science majors (Figure 6). These two groups of students are typically more experienced and probably have greater knowledge of the subject matter due to previous course enrollment. Also, upperclassmen may be more skilled using computer technology than underclassmen (Lo et al., 2002). GIS could have assisted these students more than others in making connections to ecological concepts because of their advanced levels of knowledge and familiarity with computers.
Higher achieving students in the Field group scored marginally higher than higher achieving students in the Field+GIS group on population sampling techniques, but scores for both groups of students improved. It was expected that students who used GIS would have scored higher on this category as a result of exposure to additional techniques, but this was not the case. This study also tested students' knowledge of spatial attributes such as adjacency of cover types, density and distribution of habitat types, and size requirements and limitations of suitable habitat. GIS is thought to improve spatial cognition by enabling students to visualize, analyze, and manipulate spatial data sets (NRC, 2006); however, GIS did not improve students' conceptual knowledge of spatial attributes as assessed by the rubric (Figure 4b). There may be a number of reasons for this: The assessment did not effectively measure gain in student knowledge pertinent to the use of GIS; navigation in the field improved students' spatial awareness for both groups of students so that differences were negligible (Thorndyke and Hayes-Roth, 1982); or since the entire lab, including field and GIS portions, was conducted within one 3-h lab period, the time of student exposure to GIS may have been too short to induce a measurable change and findings were due to this weak treatment (Gall et al., 2003).
CONCLUSION AND IMPLICATIONS
The results indicate comparable benefits for field experiences coupled with GIS and for field experiences coupled with follow-up lectures. The field-based nature of the lab had a large impact on both attitude and conceptual knowledge and may have had a greater influence than students' use of GIS. Others have also indicated improved student attitudes and conceptual understanding following field labs as students become engaged in learning activities (Kern and Carpenter, 1984; Karabinos et al., 1992). Kern and Carpenter (1986) found that while lower-order learning was similar between students in a traditional classroom setting and those in a field lab, students in the field lab exhibited increased levels of higher-order thinking over students in the classroom. Likewise, conceptual knowledge of students in an undergraduate earth science course improved more from their field and lab experience than from classroom lectures (Trop et al., 2000). The results of this and other studies support calls in science-education reform that advocate incorporating hands-on, inquiry-based field activities into undergraduate courses to improve student learning (National Science Foundation, 1996).
Results of this study also clearly indicate that providing an inquiry-based field activity is not enough to improve students' attitudes. Students' attitudes only improved when the inquiry-based field exercise reflected authentic scientific inquiry (year 1), while an unauthentic prefabricated field experiment resulted in declining attitudes (year 2). It was thought that hiding active radio collars in trees would preserve the nature of the experience between years. Based on students' attitudes, this was not the case. While providing an authentic inquiry experience has been shown to increase student motivation and interest in the subject material (Oliver, 2006), Chinn and Malhotra (2002) conclude that most inquiry tasks performed in schools are fundamentally different from authentic inquiry performed by researchers. Results of this study further indicate the need for implementing authentic research experiences in undergraduate courses.
Because of the complexity of the technology, GIS has been reserved for use by advanced students or those enrolled in advanced college courses (Carstensen et al., 1993). Although this study found only marginal benefit of using GIS as a teaching tool, it is important to note that GIS did not negatively affect performance or attitude of students in an introductory undergraduate ecology lab. The approach taken in this lab was to teach with GIS as opposed to teaching about GIS, i.e., teaching applications of GIS with a focus on education instead of teaching GIS technology with a focus on training (Sui, 1995). While teaching about GIS is important for students interested in using it extensively as a tool to analyze spatial datasets, teaching with GIS allows a focus on geographical and spatial knowledge acquisition without the need to teach the technicalities of the technology (Sui, 1995). Reducing the complexity of GIS for students by creating automated GIS applications or using web-based GIS can result in rich learning experiences while not limiting GIS use to advanced students (Brown and Burley, 1996; Lloyd, 2001; Baker, 2005).
The findings of this study indicate that attitude and conceptual knowledge of students in an undergraduate ecology lab can increase through field exercises without teaching with GIS. This result is particularly important for instructors who do not have access to GIS in their classrooms. But for those with access to GIS, the question remains whether time and resources should be devoted to teaching with GIS when similar results can be accomplished with a field exercise and traditional lecture. Although the instruments used in this study found few differences between treatments, using GIS can potentially provide benefits to students that were not assessed in this study. For example, education technology has been found to meet the principles suggested by the NRC (1999) needed to create an effective learning environment (Boylan, 2004). Additionally, GIS has benefits that are not directly linked to attitude and content knowledge. The NRC (2006) suggests that GIS supports the K–12 educational system by providing a challenging, real-world, problem-solving context that embodies the principles of student-centered inquiry. This extends to undergraduate classrooms as well, and the use of GIS by undergraduates prepares natural and social science majors to be able to use this tool as professionals. However, further research is needed to substantiate these claims.
Further studies may also assess the effectiveness of GIS as a teaching tool depending on the spatial and temporal scale of the investigation. In this study, students used GIS to examine phenomena operating at relatively small spatial scales—associations between squirrels, trees, and buildings. Students were able to observe these same phenomena during their field exercise. There may be limited benefit to using GIS as a teaching tool when the spatial phenomena are small scale and simple in nature. Additional studies could determine benefits of teaching with GIS when students analyze large-scale or spatially complex patterns and processes that are not easily observed during a field exercise. Furthermore, because exploring spatial phenomena at multiple scales over time is difficult without GIS, studies are needed to determine whether using GIS to explore temporal dynamics of spatial pattern across multiple scales could bring appreciable benefits to student learning.
ACKNOWLEDGMENTS
The authors thank Janie Shielack, Kimber Callicott, Susan Pedersen, Carol Stuessy, Cathy Loving, Lisa Brooks, and Dale Bozeman for their support in developing the theoretical framework behind this study. Thanks also go to Feng Liu for assisting with interrater reliability, Robert McCleery for assistance with radio-telemetry equipment and GIS datasets, and to the many teaching assistants who allowed this research to be conducted in their classrooms. We also thank two anonymous reviewers whose comments greatly improved this manuscript. This material is based on work supported by the National Science Foundation under Grant No. 0083336. Any opinions, findings, and conclusions or recommendations expressed in this material are those of the authors and do not necessarily reflect the views of the National Science Foundation.


