A Campus-Wide Study of STEM Courses: New Perspectives on Teaching Practices and Perceptions
Abstract
At the University of Maine, middle and high school science, technology, engineering, and mathematics (STEM) teachers observed 51 STEM courses across 13 different departments and collected information on the active-engagement nature of instruction. The results of these observations show that faculty members teaching STEM courses cannot simply be classified into two groups, traditional lecturers or instructors who teach in a highly interactive manner, but instead exhibit a continuum of instructional behaviors between these two classifications. In addition, the observation data reveal that student behavior differs greatly in classes with varied levels of lecture. Although faculty members who teach large-enrollment courses are more likely to lecture, we also identified instructors of several large courses using interactive teaching methods. Observed faculty members were also asked to complete a survey about how often they use specific teaching practices, and we find that faculty members are generally self-aware of their own practices. Taken together, these findings provide comprehensive information about the range of STEM teaching practices at a campus-wide level and how such information can be used to design targeted professional development for faculty.
INTRODUCTION
A recent, comprehensive meta-analysis of articles from 1942 to 2009 indicates that students learn more in and are less likely to drop out of science, technology, engineering, and mathematics (STEM) courses that use active-engagement instructional approaches (Freeman et al., 2014). Notably, these engaging approaches are also associated with better retention and learning gains for students from underrepresented groups (see Freeman et al., 2007; Preszler, 2009;Eddy and Hogan, 2014). Therefore, the importance of teaching STEM courses in this manner has been stressed in multiple recent national reports (American Association for the Advancement of Science, 2010; President's Council of Advisors on Science and Technology, 2012; Singer et al., 2012). Despite these strong, evidence-based recommendations, higher education institutions do not typically collect systematic data on how many faculty members are teaching in an active-engagement manner (Wieman and Gilbert, 2014).
The absence of such information can be a barrier to systematic efforts to improve instruction. Indeed, the lack of robust baseline data makes it difficult for faculty professional development programs to optimize information to the actual, rather than the suspected, needs of faculty. Without insight into the strengths and weaknesses of faculty instructional practices, such programs often focus on introducing instructional strategies of which faculty members are often already aware (Henderson and Dancy, 2008). Moreover, if professional development leaders contrast different instructional styles to lecture, there is a risk that participating faculty members may feel they are being unfairly categorized as traditional instructors who solely lecture. Such messages, whether intended or not, can be off-putting to faculty and thus counterproductive to catalyzing change (Henderson and Dancy, 2008; Hora and Ferrare, 2014).
To address the calls of policy makers and educators to improve STEM instruction through the adoption of active-engagement instructional strategies, meaningful faculty professional development requires information about the current status of STEM teaching practices. Furthermore, systematic data collection at the campus-wide level is imperative for efforts to assess the impact of professional development programs designed to support instructional change (PULSE, 2013; Smith et al., 2013; Hora and Ferrare, 2014; Wieman and Gilbert, 2014).
What tools are available to institutions seeking to gather information about teaching practices at a campus-wide level? One option is peer observation. During peer observation, instructors observe one another and provide feedback. Observers often use open-ended protocols in which they attend class, make notes, and respond to statements such as “Comment on student involvement and interaction with the instructor” (Millis, 1992). Although responses to these types of questions can provide useful information to observers and instructors, the data cannot easily be standardized at a campus-wide level. Furthermore, finding time to train faculty to use these protocols and then complete the observations during the academic year can be difficult. Also, faculty members may be sensitive to having colleagues observe their courses, due to concerns related to the impact of such observations on tenure and promotion decisions (Millis, 1992; Cosh, 1998; Martin and Double, 1998; Shortland, 2004).
Another option for gathering data on campus-wide STEM teaching practices is to survey instructors about their active-engagement practices. These types of surveys often ask faculty members whether they use broad strategies such as cooperative learning in their classrooms. However, a study that compared instructor survey responses with the results of an analysis of video from their courses using the Reformed Teaching Observation Protocol (RTOP; Sawada et al., 2002) found that faculty members often describe their own instruction in surveys as being more active than it actually is (Ebert-May et al., 2011). These results suggest that relevant stakeholders (instructors, STEM education researchers, etc.) do not necessarily use the same criteria for identifying active-engagement instruction.
Recently, a new response-validated survey called the Teaching Practices Inventory (TPI) was developed to measure the extent of research-based teaching practices and can be used for self-assessment by faculty and departments (Wieman and Gilbert, 2014). This survey asks faculty members how often they use several different specific teaching practices instead of whether they use broad active-engagement practices more or less frequently. A detailed scoring system is then used to give faculty members points if their answers to questions are aligned with research-based practices that have been shown to increase student learning. For example, the TPI asks instructors for the percentage of a typical class period they spend lecturing, defined as: “presenting content, deriving mathematical results, presenting a problem solution,” and they can select one of five options (0–20%, 20–40%, etc.). On this question, faculty members are given 2 points if they indicate that they lecture between 0 and 60% of the time, 1 point if they lecture 60–80% of the time, and no points if they spend more than 80% of their time lecturing. In total, the TPI has 25 questions, and faculty members can earn up to 67 points based on how often they select teaching practices aligned with increased student learning.
To overcome issues with peer observation and to determine how well faculty members are aware of their own teaching practices, we partnered with 20 middle and high school STEM teachers in order to collect detailed information on the active-learning nature of classes at the University of Maine (UM). Teachers are particularly well positioned to carry out such observations, due to their interest in issues of teaching and learning and their expertise, drawn from both experience and course work, in promoting active-engagement instruction in STEM classes. To conduct standardized observations, the teachers used the Classroom Observation Protocol for Undergraduate STEM (COPUS; Smith et al., 2013). The COPUS protocol allows observers, after a relatively short training period, to reliably characterize how faculty and students spend their time in the classroom. Observers indicate whether or not 25 different student or instructor behaviors occur during 2-min intervals throughout the duration of the class session. For example, observers indicate whether the instructor is lecturing, asking questions, moving throughout the classroom, and so on. At the same time, observers indicate whether students are listening, discussing questions, asking questions, and so on. The COPUS was adapted from the Teaching Dimensions Observation Protocol (TDOP; Hora et al., 2013; Hora and Ferrare, 2014). To determine whether UM faculty members are aware of their general instructional behaviors, they completed the TPI (Wieman and Gilbert, 2014), and their responses were compared with the COPUS observation data.
In total, the middle and high school teachers observed 51 courses across 13 different STEM departments attended by more than 4300 undergraduate students. These results give a comprehensive view of the diversity of STEM instruction and student in-class behavior across campus. We also explore whether variables such as class size have an impact on the instructional strategies used by faculty members and whether they are aware of how often they are using specific instructional practices. Finally, we discuss how these results can inform the design and implementation of targeted professional development.
METHODS
Selection of UM Classes
To recruit faculty members to participate in this study, we sent emails to faculty members teaching introductory-level courses in 13 different STEM departments (biochemistry; microbiology and molecular biology; biology and ecology; chemical and biological engineering; chemistry; civil and environmental engineering; earth sciences; electrical and computer engineering; marine science; mathematics and statistics; mechanical engineering; physics and astronomy; and plant, soil, and environmental science). In addition, we also contacted instructors in a small number of upper-division courses, because these courses were required for a major and had enrollments of more than 40 students. In the email, faculty members were told that the teachers were helping to capture a snapshot of STEM instruction at UM; we did not describe the observation protocol being used or what instructional practices the teachers were capturing until the study was complete.
We have found UM faculty members to be receptive to allowing middle and high school teachers to observe in their classrooms. In total, 58 faculty members were contacted via email (two emails were sent to the faculty members); 43 responded by indicating that the teachers were welcome to observe in their classrooms. Although three faculty members said that the teachers could not observe courses, the reasons were purely logistical and did not reflect an unwillingness to be observed in general; rather, they declined because students were taking an in-class or online exam, the instructor would not be present on the observation date, or their classrooms were too full to accommodate additional visitors. An additional 12 faculty members did not respond to the email. What is perhaps most notable is the fact that we did not receive any emails from faculty members stating that they simply did not want observations to be conducted in their classrooms.
Altogether, the teachers observed 51 courses, 44 at the introductory level and seven at the upper-division level. Five faculty members were observed teaching two different courses, such as introductory calculus-based physics and introductory algebra-based physics, and results from each course are reported separately. Additionally, two faculty members coteach their courses, and both members of the team agreed to be observed. In this paper, we also report these results as different courses, because faculty members were collaborating on the course as a whole but teaching class sessions individually.
To capture teaching practices that are indicative of the class as a whole rather than a particular class meeting, observations were conducted in both February and April during the Spring 2014 semester, when possible. Indeed, most courses were observed twice (Table 1). In addition, some courses were observed more than twice, because the instructor taught multiple sections of the same course or, since each observation period ran from Tuesday to Thursday, the instructor agreed to be observed more than once in the same week.
| Observed once | Observed twice | Observed three or more times | |
|---|---|---|---|
| Number of courses | 13 | 33 | 5 |
All faculty members who agreed to be observed were given a human subjects consent form. Approval to evaluate teacher observation data of classrooms (exempt status, protocol no. 2013-02-06) was granted by the institutional review board at UM. Because of the delicate nature of sharing observation data with other faculty members and members of the administration, the consent form explained that the data would only be shared in aggregate and would not be subdivided according to variables such as department. However, faculty members were given access to observation data from their own course(s) upon request after we collected all observation and survey data for this study.
Selection and Training of Middle and High School Teachers
For recruitment of observers for this program, middle and high school teachers throughout the state of Maine were sent an email inviting them to apply. In total, 20 teachers were selected based on teaching experience, interest in participating, and their status as teachers of primarily STEM content. The teachers were compensated $200/day.
The middle and high school teachers were trained to use the COPUS protocol according to the training outlined by Smith et al. (2013). In February, the training began by displaying the 25 COPUS codes and code descriptions (Table 2). There are 12 codes that describe instructor behaviors and 13 codes that describe student behaviors. The authors of this paper went through each code with the teachers and led a discussion about the different student and instructor behaviors described in the protocol.
| Collapsed codes | Individual codes | |
|---|---|---|
| Instructor is: | Presenting (P) | Lec: Lecturing or presenting information |
| RtW: Real-time writing | ||
| D/V: Showing or conducting a demo, experiment, or simulation | ||
| Guiding (G) | FlUp: Follow-up/feedback on clicker question or activity | |
| PQ: Posing nonclicker question to students (nonrhetorical) | ||
| CQ: Asking clicker question (entire time, not just when first asked) | ||
| AnQ: Listening to and answering student questions to entire class | ||
| MG: Moving through class guiding ongoing student work | ||
| 1o1: One-on-one extended discussion with individual students | ||
| Administration (A) | Adm: Administration (assign homework, return tests, etc.) | |
| Other (OI) | W: Waiting (instructor late, working on fixing technical problems) | |
| O: Other | ||
| Students are: | Receiving (R) | L: Listening to instructor |
| Talking to class (STC) | AnQ: Student answering question posed by instructor | |
| SQ:: Student asks question | ||
| WC:: Students engaged in whole-class discussion | ||
| SP: Students presenting to entire class | ||
| Working (SW) | Ind: Individual thinking/problem solving | |
| CG: Discussing clicker question in groups of students | ||
| WG: Working in groups on worksheet activity | ||
| OG: Other assigned group activity | ||
| Prd: Making a prediction about a demo or experiment | ||
| TQ: Test or quiz | ||
| Other (OS) | W: Waiting (instructor late, working on fixing technical problems) | |
| O: Other |
Next, the teachers were given paper observation sheets, which included the codes along the top row and time divided in 2-min intervals down the first column (sample COPUS protocol sheets can be found in Smith et al., 2013, and at www.cwsei.ubc.ca/resources/COPUS.htm). Teachers practiced coding 2-min, 8-min, and 10-min videos of STEM courses. After coding each video, the authors of this paper (M.K.S., E.L.V., J.D.L., and M.R.S.) and the teachers discussed which student and instructor codes they selected for each 2-min time interval. Codes that were not unanimously selected were further discussed and clarified. In April, there was an additional refresher training using 8- and 10-min videos. The videos were paused every 2 min and the group discussed any coding disparities.
Observations
Teachers observed each class in pairs and used either a 2-min small hourglass sand timer or a stopwatch to ensure they were recording data in the same 2-min time intervals. Each teacher had his or her own printed COPUS protocol, which was later transferred to an Excel document (Microsoft, Redmond, WA). Teachers were instructed to record their COPUS results independently and to describe any behaviors coded as “Other” in the comments section. While we tried to have the same pairs of teachers observe the same courses in February and April, scheduling conflicts made it necessary for us to rotate several of the pairs.
Analyzing COPUS Data
To compare observer reliability, we calculated Cohen's kappa interrater scores for each observation pair. In February, the average kappa was 0.85, and in April, the average kappa was 0.91. These are high kappa values and indicate strong interrater reliability (Landis and Koch, 1977).
To determine the prevalence of each code, we added up the total number of times each code was marked by both observers and divided by the total number of codes shared by both observers. For example, if both observers marked “Instructor: Lecture” during the same 13 time intervals in a 50-min class period and marked the same 25 instructor codes total for the duration of the class, then 13/25 or 52% of the codes would be lecture.
As mentioned above, course observations were conducted in both February and April in order to try to capture teaching practices that are indicative of the course rather than a particular day of instruction. For all courses that were observed more than once (Table 1), the codes were averaged. For example, in a given course, if 51% of the codes were lecture in February and 53% of the codes were lecture in April, the lecture code would be reported as 52%.
It was difficult to get a general sense of trends in student and instructor behavior when comparing 25 possible COPUS codes in 51 different courses. Therefore, in addition to looking at all the COPUS codes individually, we also collapsed them into four categories describing what the instructor is doing and four categories describing what the students are doing (Table 2; F. Jones, personal communication).
The four instructor code categories include: 1) presenting (P): the instructor is lecturing, possibly using techniques such as real-time writing or showing demonstrations/videos; 2) guiding (G): the instructor is asking and answering questions, including clicker questions, and could be moving throughout the classroom; 3) administration (A): the instructor is making announcements of upcoming due dates, returning assignments, and so on; and 4) other (OI): the instructor is either waiting for the students to complete a task without interacting with them or is engaging in an activity that cannot be easily characterized by the COPUS protocol, such as listening during student presentations.
The four student code categories include: 1) receiving (R): the students are listening to the instructor/taking notes; 2) students talking to class (STC): the students are talking to the whole class, for example, asking and answering questions; 3) students working (SW): the students are working on problems, worksheets, and so on, either individually or in groups; and 4) other (OS): the students are either waiting for the instructor or doing an activity that cannot be easily characterized by the COPUS protocol, such as collecting and preparing materials for an upcoming experiment.
Surveying the Faculty on Teaching Practices
All faculty members observed were asked to take the TPI (Wieman and Gilbert, 2014) online using Qualtrics (Qualtrics, Provo, UT) between the February and April observations. We sent three email reminders to the faculty. Thirty-three of the 43 faculty members observed completed the survey. This response rate is comparable to the average rate in another survey-based research study of faculty (Ebert-May et al., 2011).
All statistical analyses were performed using SPSS (IBM, Armonk, NY).
RESULTS
Categorizing the Range of Instructor Practices and Student Experiences across STEM Courses
At the beginning of this project, we hypothesized that UM faculty members would likely fit into two general groups: those who present material for the majority of the class period and those who use a variety of active-engagement approaches and present material relatively infrequently. To examine our hypothesis, we compared the collapsed COPUS instructor codes across all 51 STEM courses (Figure 1). We found that faculty cannot simply be divided into two groups; instead we observed a continuum from 2 to 98% presenting. While we cannot rule out self-selection effects impacting the data collected, 74% of the faculty members originally contacted were observed, suggesting that our findings would be only minimally different had data from the remaining faculty members been collected.
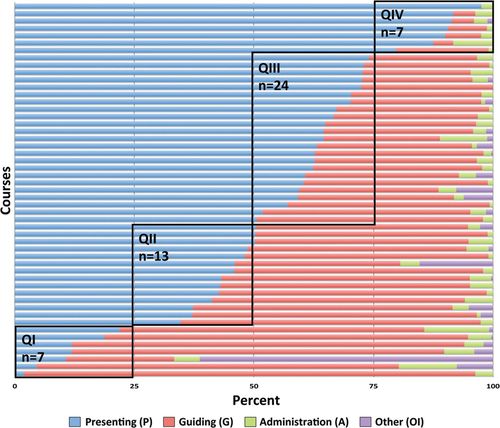
Figure 1. Percentage of collapsed COPUS codes for all observations by course. Each horizontal row represents a different course. When more than one observation was taken of the same course, the codes were averaged across the time periods (see Methods for details). Faculty were divided into four quadrants (QI–QIV) based on the percentage of codes devoted to presenting. The number of courses in each of the quadrants is indicated.
Given the large range of instructor teaching practices across the various courses, we divided the courses into four quadrants based on the percentage of presenting codes (quadrant I: 0–25%; quadrant II: 26–50%; quadrant III: 51–75%; and quadrant IV: 76–100%; Figure 1). We chose to divide the data into quadrants so we could compare characteristics of courses with different levels of presentation. We then constructed pie charts of the instructor and student behaviors for all 25 individual COPUS codes across these four quadrants (Figures 2 and 3).
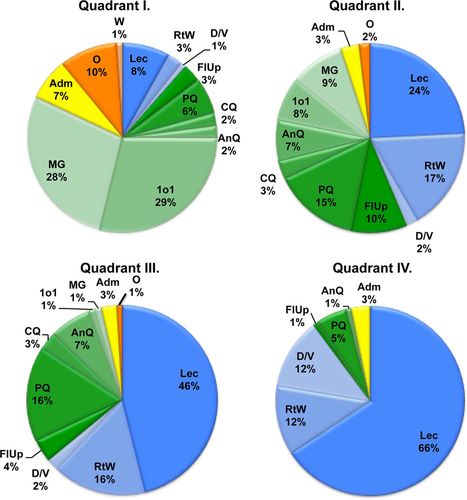
Figure 2. Instructor COPUS codes across all four quadrants. Percentages indicate the frequency of each individual code averaged across all courses in a given quadrant. For the instructor codes: presenting (P) codes are shown in shades of blue; guiding (G) codes are shown in shades of green; administration (A) codes are shown in yellow; and other instructor (OI) codes are shown in shades of orange. See Table 2 for abbreviations within each colored section.
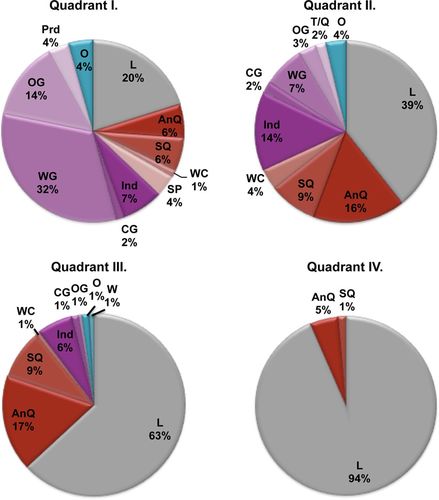
Figure 3. Student COPUS codes across all four quadrants. Percentages indicate the frequency of each individual code averaged across all courses in a given quadrant. For the student codes: the receiving (R) code is shown in gray; students talking to class (STC) codes are shown in shades of red; student working (SW) codes are shown in shades of purple; and student other (SO) codes are shown in shades of teal. See Table 2 for abbreviations within each colored section.
As expected, the instructor presenting codes (Figure 2, shown in shades of blue) increased from quadrant I to quadrant IV. We find that lecture (Lec) and real-time writing (RtW) make up the largest fraction of the presenting codes in all four quadrants. Conversely, the instructor guiding codes (shown in shades of green) decrease across the four quadrants. Notably, the codes moving and guiding (MG), which describes the instructor moving through the classroom, and one-on-one (1o1), which describes an instructor having an extended discussion with one or a small group of students, make up a large portion of the codes in quadrant I but account for <1% of the codes in quadrants III and IV.
We also explored the range of student experiences in classes that make up these four quadrants by examining the individual COPUS codes for student behaviors (Figure 3). On average, students who attend classes in quadrant I spend the majority of the time working either individually or in groups (shown in shades of purple). As the student receiving code increases (gray), the time students spend working either individually or in groups decreases until it is nonexistent in quadrant IV. Interestingly, codes collapsed into the Students Talking to Class category (shown in shades of red), which includes students asking and answering questions (codes SQ and AnQ), are present in all four quadrants. This result suggests that even students in classes in which presenting (P) is common are asking and answering questions.
Assessing the Impact of Class Size on Teaching Practices
Given the diversity of instructional experiences across campus, we wanted to explore whether class size correlates with instructor teaching practices (Figure 4). There is a significant but not large positive correlation between class size and the percentage of presenting (Pearson's r = 0.401, p < 0.05), meaning that instructors who teach large-enrollment classes tend to present more often. However, we also looked at the range of class sizes across the four quadrants and found that, while classes in quadrant I were generally small, quadrants II–IV all have a broad range of class sizes (Figure 5). These results indicate that there are both large-enrollment classes on campus that employ a wide range of teaching practices and smaller-enrollment classes in which faculty members mostly present material.
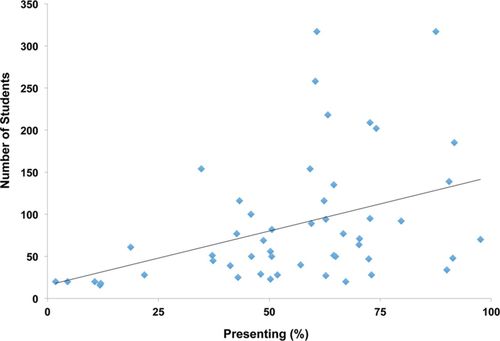
Figure 4. Correlation between percentage of presenting and class size by course.
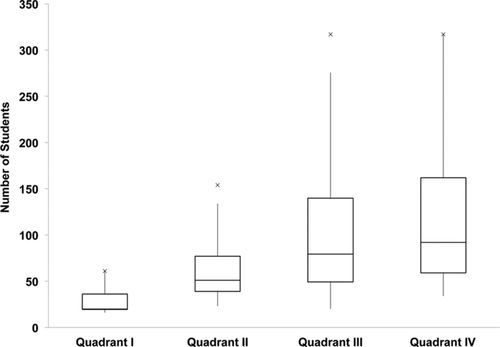
Figure 5. Comparison of class size and quadrants divided by the frequency of the instructor presenting code. The line in the middle of the box represents the median class size for the courses in each quadrant. The top of the box represents the 75th percentile, and the bottom of the box represents the 25th percentile. The space in the box is called the interquartile range (IQR), and the whiskers represent the lowest and highest data points no more than 1.5 times the IQR above and below the box. Data points not included in the range of the whiskers are represented by an “x.”
Are Instructors Aware of Their Teaching Practices?
We also examined the extent to which observed faculty members are aware of their own teaching practices by asking faculty members to fill out the TPI (Wieman and Gilbert, 2014). To determine whether there are differences between the faculty members who completed the survey (n = 33) and those who did not (n = 10), we compared the collapsed presenting code percentages between the two groups and did not find a significant difference (one-tailed Wilcoxon two-sample test, p = 0.141).
The TPI measures the extent of research-based teaching practices in STEM courses via a detailed scoring system—the more teaching practices an instructor uses, the higher the score. Therefore, we started by comparing the scores on the TPI with the percentage of presenting. We found a significant negative correlation between the two variables (Pearson's r = −0.467, p < 0.05), meaning that the more an instructor presents, the fewer research-based teaching practices he or she claims to employ.
Because the TPI measures a variety of teaching practices that occur outside the classroom (e.g., assigning graded homework and the frequency of exams), we also examined the scores on the In-class Features and Activities section of the survey, which specifically asks questions that relate most directly to the COPUS observation data. We again found a significant negative correlation between the two variables (Pearson's r = −0.509, p < 0.05; Figure 6).
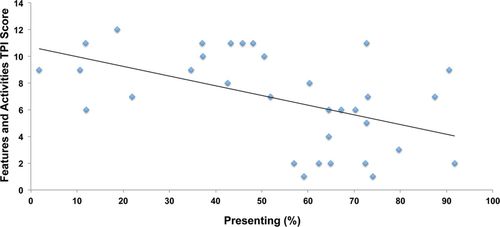
Figure 6. Correlation between percentage of presenting and instructor TPI score by course on the Features and Activities section. The maximum score in this section is 15.
Examples of the variation in instructor response to two of the questions in the In-class Features and Activities section are also shown (Figure 7). In particular, the TPI asks instructors to answer a multiple-choice question about how often they lecture, and we found a general trend that faculty members in quadrant IV report lecturing more often than those in quadrant I. Conversly, we found the opposite trend when faculty members responded to multiple-choice questions about the average number of times students have small-group discussions in class. Faculty members in quadrant I report engaging in this practice more often. Taken together, these results suggest that many faculty members are aware of how often they are using a subset of practices recorded in the COPUS observations.
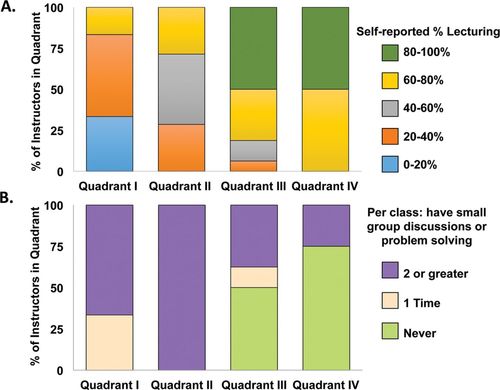
Figure 7. Faculty members self-report on: (A) the fraction of a typical class period they spend lecturing (presenting content, deriving mathematical results, presenting a problem solution, etc.) and (B) the average number of times per class that have small-group discussions or problem solving.
Finally, three questions on the TPI focus on how often faculty members share and learn about teaching practices. It is important to note that the responses to questions such as these have important implications for the design of professional development. These questions ask faculty members to rate on a scale from 1 (never) to 5 (very frequently) how often they discuss how to teach a course with colleagues, read literature about teaching and learning, and sit in on colleagues’ classes. We again find a general trend in which faculty members who teach courses in quadrant I are more likely to claim to engage in these activities compared with faculty members who teach courses in quadrant IV (Figure 8).
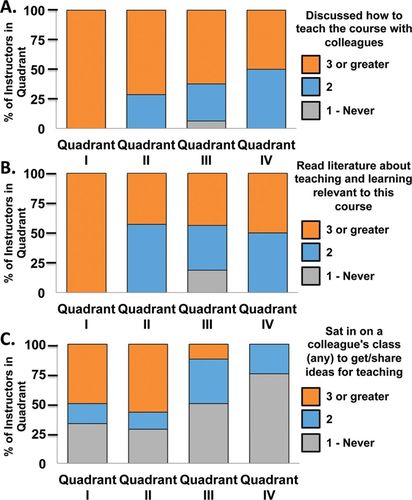
Figure 8. Faculty members self-report about how often, from 1 (never) to 5 (very freqently), they: (A) discussed how to teach the course with colleague(s), (B) read literature about teaching and learning relevant to their course, and (C) sat in on a colleague's class to get/share ideas for teaching.
DISCUSSION
Do Traditional Teaching Practices Dominate Undergraduate STEM Instruction?
Collecting data on teaching practices on a campus-wide scale has allowed us to answer broad questions about STEM instruction. In particular, we were interested in determining whether or not traditional teaching practices dominate undergraduate STEM instruction at a given institution such as UM. We found a broad continuum of the presenting code frequency, ranging from 2 to 98% (Figure 1). UM is a public research-intensive institution, and we expect that the diversity of instructional practices is similar to that at comparable institutions. Furthermore, our observation data are consistent with data collected using the TPI at the University of British Columbia (Wieman and Gilbert, 2014). Namely, TPI scores were spread across a large range in five departments at this institution.
These results are important in light of recent work arguing that common categorizations of STEM instruction as either lecturing or using active-engagement instruction, for example, lack sufficient detail and may actually be undermining efforts to provide effective professional development, because faculty members find it off-putting to be classified into one of two oversimplified groups (Henderson and Dancy, 2008; Hora and Ferrare, 2014). While we are unsure of the exact development of this apparent binary classification, we suspect it may have emerged because it is often easier and more practical to compare extremes. Notably, national reports in the 1980s and early 1990s recommended that higher education faculty adopt active modes of teaching, such as peer discussion, and contrasted these recommendations with traditional lecturing (National Institute of Education, 1984; Bonwell and Eison, 1991).
The traditional presentation of material via lecturing is, of course, an efficient way to deliver information, and we find that faculty members across all four quadrants are spending some amount of time presenting (Figure 2, shades of blue), typically combining lecture (Lec) and real-time writing (RtW). Our results show that, as presenting increases throughout the four quadrants, the percentage of instructor guiding codes (shades of green) decreases. We also see important shifts in student behavior when instructor behavior shifts (Figure 3). For example, students in quadrant I courses spend the majority of the class working on problems in groups (Figure 3, shades of purple). However, as the student listening code increases, group work decreases until it is nonexistent in quadrant IV. The reduction in group work is notable, because previous work has shown that students are able to learn more from listening to instructor explanations after having a chance to develop a related idea, discuss questions with their peers, and so on (Schwartz and Bransford, 1998; Smith et al., 2011). Thus, students in quadrant IV are not given the opportunity to engage with the content in interactive ways compared with students in other courses.
Interestingly, students in classes in all four quadrants answer instructor questions (AnQ) and pose questions (SQ; Figure 3, shades of red). These results indicate this form of communication between students and instructors is common to STEM courses at a campus-wide level, regardless of other characteristics of the course instruction, and may therefore be used as a point of reference to frame future professional development for faculty.
What Role Does Class Size Play in the Diversity of Teaching Practices?
One factor that has been consistently shown to impact the amount of time devoted to presenting material is class size (Murray and Macdonald, 1997; Ebert-May et al., 2011). Namely, faculty members who teach large-enrollment courses are more likely to view lecture as their only option. In this study, we found that class size is positively correlated with percent presenting (Figure 4), but we also observed that the instructors of several large courses are teaching in active ways (Figure 5), suggesting that class size alone should not prevent a faculty member from trying different teaching practices in the classroom. This finding is consistent with previous studies documenting the effective use of active learning in large-enrollment classes (e.g., Hake, 1998; Crouch and Mazur, 2001; Allen and Tanner, 2005; Knight and Wood, 2005; Freeman et al., 2007, 2014; Derting and Ebert-May, 2010). Furthermore, identifying faculty members who teach large-enrollment courses in active ways can be a useful first step in finding faculty members who are well positioned to help facilitate professional development programs. In addition, we anticipate that such faculty members, once identified, may be willing to open up their classrooms to colleagues, so other faculty members can see firsthand what active-engagement teaching looks like in large-enrollment courses.
Are Faculty Members Aware of Their Own Teaching Practices?
Another concern among researchers investigating faculty professional development is that there is often a disconnect between how faculty members describe their own teaching practices and what is observed (Fung and Chow, 2002; Ebert-May et al., 2011). This disconnect can have profound implications for professional development, because faculty members may believe they are using ideas learned during professional development workshops more often than is the case. Using the TPI (Wieman and Gilbert, 2014), we found negative correlations when examining: 1) overall survey score versus the percentage of presenting by faculty and 2) the In-class Features and Activities Section score versus the percentage of presenting (Figure 6). These results suggest that faculty members who use a variety of teaching practices score higher on the survey. Furthermore, when we looked at specific questions that asked faculty members how often they lecture and hold small-group discussions in class, we see responses across the four quadrants indicating that faculty members are generally reporting what happens in their classes on the TPI (Figure 7).
The differences between our results and those reported in previous studies are likely due, at least in part, to the types of survey and observation protocols used. For example, Ebert-May et al. (2011) asked about the frequency of using general teaching practices and compared the responses with the RTOP (Sawada et al., 2002), which has observers use a Likert scale to rate statements such as “The teacher had a solid grasp of the subject matter content inherent in the lesson.” Our study asked faculty members to rate how often they use practices such as lecture and compared their responses with observation results from the COPUS protocol (Smith et al., 2013), which specifically examines how often the lecture code is marked throughout the duration of the class. The implication of these contrasting outcomes is that faculty members may be able to more accurately estimate the time they use specific learning strategies rather than whether or not broad instructional strategies, such as cooperative learning, are frequently used in their courses. In addition, there is greater alignment between the TPI questions and the COPUS codes than was the case for the teaching surveys and observation protocols used in previous studies.
One additional difference between the Ebert-May et al. (2011) study and our study is the relationship between the faculty and the researchers administering the surveys. The faculty members surveyed by Ebert-May and others were participating in ongoing faculty professional development led by the authors. It is possible that the faculty members felt the need to indicate on the survey that they were, in fact, implementing the kinds of teaching strategies targeted in the professional development sessions. The authors of this study have not yet provided professional development at UM, so the desire to indicate a certain level of active-engagement learning may not have been as strong in our case. It is worth noting that efforts to provide professional development for faculty are often tightly integrated with efforts to document faculty practices. While there are many reasons why this integration is valuable, it is possible that the apparent discrepancy between our findings and those of Ebert-May et al. (2011) may serve to highlight some limitations of this practice.
Limitations of Our Study
Although this work provides a comprehensive view of STEM teaching at a campus-wide level, we do not yet know which combination of teaching practices are most effective for student learning. Based on a recent meta-analysis of the STEM literature comparing lecture-based courses with active-learning courses, active-learning courses improve student performance and decrease drop rates (Freeman et al., 2014). There have also been several studies indicating that student learning improves when instructors modify their current teaching practices in different STEM disciplines (e.g., Hake, 1998; Knight and Wood, 2005; Derting and Ebert-May, 2010). Future work combining COPUS observation data and observation protocols that focus on instructor quality (Sawada et al., 2002; Weiss et al., 2003) and learning gains on validated assessments of student content knowledge (e.g., Hestenes et al., 1992; Ding et al., 2006; Epstein, 2007; Smith et al., 2008; Shi et al., 2010) will help us more precisely investigate how different combinations of teaching practices lead to varied learning outcomes.
The Impact of COPUS Results on Professional Development
Creators of observation protocols such as the COPUS (Smith et al., 2013) and the TDOP (Hora and Ferrare, 2014) have suggested that the data gathered during systematic observations of faculty on a campus-wide level can be used to create targeted, meaningful professional development. Broadly, the results presented here suggest that those who provide professional development should gather information about the diversity of teaching practices used by faculty attendees by, for example, using surveys such as the TPI (Wieman and Gilbert, 2014), observation data, questions about challenges and expectations for the professional development experience, and/or clicker questions that gauge pedagogical sophistication. Future work examining the impact of honoring the diversity of faculty teaching practices during professional development activities will likely lead to important insights for determining how to best support faculty members who want to transform their classes.
The data presented here also suggest that COPUS and TPI are highly synergistic resources for obtaining complementary and comprehensive data about the nature of course instruction. The two instruments overlap in the area of in-class teaching practices, and the COPUS observation data provide external structure validity evidence (reviewed in Campbell and Nehm, 2013) for the Features and Activities section of the TPI (Figure 6). However, these two instruments also address different aspects of instruction. For example, the COPUS documents student behavior in the classroom, whereas the TPI targets multiple aspects of the course, including those that do not take place in the classroom. From our perspective, both instructor and student behaviors are critical to effective instruction, and we thus recommend that institutions collect a combination of survey and observational data in order to create snapshots of their local instructional practices.
At UM, for example, anonymized, aggregated COPUS and TPI data across all departments are being shared with the Center for Excellence in Teaching and Assessment so that workshops can be developed. In recent years, the professional development programming at UM has focused on the mechanics of using clickers, mobile devices as clickers, and online survey instruments; teaching research-based laboratory courses; time management for new faculty; weaving fieldwork into courses; and using multiple-choice testing to assess student learning (UMaine ADVANCE Rising Tides Center Web page; UMaine Center for Excellence in Teaching and Assessment Web page; UMaine Faculty Development Center Web page). On the basis of the COPUS results, we are now designing workshops on integrating active-engagement strategies into large lecture courses, retooling general questions asked of students into clicker questions and worksheet activities, and using different teaching techniques, such as clicker questions, to stimulate peer discussion. In addition, because onetime workshops raise faculty awareness but are not enough to foster lasting and substantive instructional transformations (Davidovitch and Soen, 2006; Henderson et al., 2011), faculty members will partner with someone in a different STEM discipline but at a comparable professional level and will use the COPUS to observe their partners and provide peer coaching (Gormally et al., 2014).
Finally, while the focus of this paper has been on the data generated about teaching practices at UM, research on classroom observation programs indicates that both the observer and the instructor being observed benefit from the observation experience. Indeed, observers have opportunities to see different instructional practices and reflect on their own teaching (Cosh, 1998; Bell, 2001; MacIsaac and Falconer, 2002; Henderson et al., 2011). Interviews with middle and high school teachers conducting the observations indicate that this program provided opportunities to: 1) experience objective evaluation of classrooms and teachers, 2) reflect on their own practice, 3) make meaningful contributions to STEM education reform, and 4) discuss STEM education with colleagues from around the state. Furthermore, the majority of teachers participating in this program have never observed colleagues teach at their school; those who have observed colleagues typically do so only once a year for a subset of a single class period. Because this program also impacts the teacher conducting the observations, we are currently investigating how the teachers reflect on their observations of university instruction and whether that reflection varies based on their own teaching practices.
CONCLUSION
Our work provides a comprehensive, campus-wide view of STEM teaching at a university. We found that faculty members: 1) demonstrate a range of teaching practices that impact student experience, 2) are generally but not always influenced by class size when selecting practices, and 3) have an awareness of how often they use specific teaching practices in their courses. This work has important implications for faculty professional development. In part, it provides further confirmation that providers of professional development should explicitly speak to and build upon the fact that most faculty members fall somewhere in the continuum between pure lecturing and primarily active-engagement instruction. Emphasis should be on programs that increase awareness of teaching practices currently in use across campus and on strategies that can help faculty members gradually shift where they are on the continuum in order to better meet the needs of their students. In addition, our findings suggest that many faculty members have experiences that could contribute substantively to faculty professional development programs. Indeed, drawing upon the diverse levels of faculty teaching expertise during professional development also offers an opportunity to effectively model a valuable instructional strategy: honoring the prior knowledge of the learners. Perhaps most importantly, this strategy helps learners “remember, reason, solve problems, and acquire new knowledge” (National Research Council, 2000) and, by extension, will also help maximize the impact of the professional development experience on faculty.
ACKNOWLEDGMENTS
The authors very much appreciate the contributions of the middle and high school teachers who served as observers (Elizabeth Baker, Stacy Boyle, Tracy Deschaine, Lauren Driscoll, Andrew Ford, Kathryn Priest Glidden, Marshall Haas, Kate Hayes, Beth Haynes, Bob Kumpa, Lori LaCombe-Burby, Melissa Lewis, John Mannette, Lori Matthews, Nicole Novak, Patti Pelletier, Meredith Shelton, Beth Smyth-Handley, Joanna Stevens, and Thomas White) and the University of Maine faculty members who welcomed the teachers into their classes for observations. We also thank Paula Lemons, Scott Merrill, Mary Tyler, Jill Voreis, and Carl Wieman for helpful feedback on this article. This work is supported by the National Science Foundation under grants 1347577 and 0962805.


