Identifying Novel Helix–Loop–Helix Genes in Caenorhabditis elegans through a Classroom Demonstration of Functional Genomics
Abstract
A 14-week, undergraduate-level Genetics and Population Biology course at Morgan State University was modified to include a demonstration of functional genomics in the research laboratory. Students performed a rudimentary sequence analysis of the Caenorhabditis elegans genome and further characterized three sequences that were predicted to encode helix–loop–helix proteins. Students then used reverse transcription–polymerase chain reaction to determine which of the three genes is normally expressed in C. elegans. At the end of this laboratory activity, students were 1) to demonstrate a rudimentary knowledge of bioinformatics, including the ability to differentiate between“ having” a gene and “expressing” a gene, and 2) to understand basic approaches to functional genomics, including one specific technique for assaying for gene expression. It was also anticipated that students would increase their skills at effectively communicating their research activities through written and/or oral presentation. This article describes the laboratory activity and the assessment of the effectiveness of the activity.
INTRODUCTION
The significance of the Human Genome Project and other recent advances in molecular genetics is often lost on undergraduate students. Many do not understand how research scientists use bioinformatics and functional genomics to investigate the genetics of human disease and development (see van Ommen, 2002). The lecture and laboratory components of a 14-week introductory Genetics and Population Biology course at Morgan State University were modified to include a demonstration of functional genomics in the research laboratory. During a 2-week period that consisted of four 2-h laboratory sessions, 24 biology majors worked in six groups of 4. Each group was assigned one of three DNA sequences predicted to encode a helix–loop–helix (HLH) protein in Caenorhabditis elegans. The groups performed a sequence analysis of their gene using various database search engines. To determine if their gene is expressed in wild-type C. elegans, each group analyzed RNA production using reverse transcription–polymerase chain reaction (RT-PCR). During the 2-week period, students were required to keep a detailed record of all laboratory activities. Upon completion of this lab, each student submitted a laboratory report written in an acceptable scientific paper format. Students were also encouraged to present their findings at Morgan State University's annual undergraduate research symposium.
By the end of the investigations described here, students were expected to meet the following objectives: 1) Students were to demonstrate a rudimentary knowledge of bioinformatics, including the ability to differentiate between“ having” a gene and “expressing” a gene; and 2) students were to understand basic approaches to functional genomics, including one specific technique for assaying for gene expression. It was also anticipated that students would increase their skills at effectively communicating their research activities through written and/or oral presentation. Student assessment was based on their laboratory notebooks, research articles, and one in-class examination. To measure how strongly these investigations influenced student knowledge and understanding of bioinformatics, students completed pre- and post-activity surveys.
In addition to providing an in-class demonstration of functional genomics, this activity allowed students to participate actively in an ongoing research project aimed at identifying new HLH proteins that regulate C. elegans development. Student motivation and enthusiasm for this project increased once they realized that this activity was not a “canned” laboratory exercise and that their results would be used to analyze actual genes of interest. Since the implementation of this activity, professors in the biology department have seen an increase in the number of students who express an interest in gaining research experience. It seems likely, then, that the implementation of this activity into our curriculum will increase the number of undergraduate students who pursue professional careers as has been suggested previously (Boyer Commission on Educating Undergraduates in the Research University, 1998).
With traditional approaches to studying genetics, a scientist would associate a particular phenotype with a disease or disorder and work to identify the abnormal gene product thought to cause the disease. One classical example of such a traditional approach is the identification of the gene responsible for sickle cell anemia. J. Herrick officially described the phenotype for sickle cell anemia in 1910. This phenotype includes the characteristic sickle shape that deoxygenated red blood cells maintain in patients with the disease (Herrick, 1910). Once the phenotype was described, E.A. Beet and J.V. Noel each proposed in 1949 that sickle cell anemia is a recessive disorder, that an individual must inherit one “bad” or mutant copy of the unknown gene from each parent to display the sickle phenotype (Scott, 1983). Hemoglobin was suggested to be that “bad” protein after Pauling and others used electrophoresis to show that hemoglobin from sickle cell patients did not have the same electrical charge as hemoglobin from patients without the disease. Finally, in 1956, V. Ingram showed that the amino acid sequence of the hemoglobin protein is different in patients with sickle cell anemia. Scientists have since sequenced the gene for hemoglobin and have identified exactly which nucleotide is changed in people with sickle cell disease (for reviews see Schroeder, 1981; Scott, 1983).
In the case of sickle cell anemia, an animal model was not required. The role of hemoglobin in red blood cells was known before the mutation for sickle cell anemia was identified. Sometimes, however, scientists will create animal models of a particular disease and use those models to understand the function of the gene.
Functional genomics is defined as the study of gene expression to describe the functions of all genes in a genome (Griffiths, 1999). It is based entirely on the premise of the central dogma for molecular genetics, that DNA sequences are used as the template for RNA synthesis and that the RNA is subsequently used as a template for protein synthesis. A gene is expressed when RNA and protein are produced because of the sequence information provided within a specific region of DNA (Crick, 1970).
Functional genomics may be considered the reverse of traditional genetic approaches. For functional genomics, the genome of a model organism, such as the fruit fly, Drosophila melanogaster, or the flowering plant, Arabidposis thaliana, is sequenced (Reinke and White, 2002), and the sequencing data are stored in large databases. Powerful computer programs are then used to predict which sequences represent genes and which gene regions code for proteins, as well as to identify motifs characteristic for specific protein functions. The science of identifying genes and predicting protein products and functions through various computer algorithms is called bioinformatics. Molecular geneticists use bioinformatic approaches to select a gene for study, perhaps by first identifying a human gene of interest and looking for predicted similar genes in the model organism. Once predicted genes are identified, RNA analysis is used to determine if the predicted gene is expressed. Various techniques are then used to interfere with normal expression of the gene. The model organism is observed closely, and the resulting changes in the animal's phenotype indicate possible functions of the gene product. Molecular geneticists then design experiments to characterize the gene product further at the protein level (Baxevanis, 2001).
Caenorhabditis elegans is a nonparasitic soil nematode and is ideal for these types of functional genomics studies. First, C. elegans has been used extensively as a model of eukaryotic development and is ideal for classroom use because it is so inexpensively maintained. Second, the C. elegans genome has been completely sequenced and geneticists have already characterized hundreds of morphological, behavioral, and neurological phenotypes using traditional approaches (Kim, 2001). The availability of gene sequences makes it feasible to perform database searches and rudimentary sequence analysis in the classroom. Third, techniques for selectively eliminating gene expression have been fully developed in this organism. These techniques are easily modified for use in the classroom. Furthermore, DNA and RNA purification from mutant and/or normal strains of C. elegans can be completed within a single 2-h class period. For a brief introduction to C. elegans, visit the Caenorhabditis elegans Server at http://elegans.swmed.edu.
The C. elegans life cycle depends on the temperature at which it is grown. When maintained at 25°C, these animals complete their life cycle within 3 to 4 days. At 16°C, their life cycle is approximately 7 to 9 days. C. elegans are either hermaphrodites, which are capable of self-fertilization but cannot fertilize each other, or males, which can fertilize the hermaphrodites. When unfertilized, a normal hermaphrodite produces 300 progeny, while a hermaphrodite fertilized by a male will produce approximately 1000 progeny. Because the hermaphrodites are capable of self-fertilization, a single culture of C. elegans contains animals at different stages of their life cycles (Epstein and Shakes, 1995). These stages include fertilized eggs, four larval stages, and adult animals (see Figure 1).
SEQUENCE ANALYSIS OF THE Caenorhabditis elegans GENOME
The Laboratory of Developmental and Molecular Genetics at Morgan State University is interested in identifying HLH transcription factors that affect C. elegans development. Transcription factors are proteins that help in regulating the initiation of transcription by RNA polymerase. Usually transcription factors are capable of binding to DNA, through a specialized DNA binding domain, and of interacting directly with RNA polymerase or other transcription factors, through a transactivating domain (Gilbert, 2000). HLH proteins are one of many eukaryotic transcription factor families. This family is characterized by a stretch of basic amino acids that act as the DNA binding domain and a dimerization domain that consists of two helices connected by a loop (Ledent and Vervoort, 2001). HLH proteins regulate several developmental processes in humans, including brain and eye morphogenesis, skeletal muscle development, and neural development. Because C. elegans has both neural and muscular features, it is not surprising that functional HLH proteins have already been identified in this organism (Massari and Murre, 2000). After a preliminary search of the C. elegans genome for predicted HLH genes by undergraduate research assistants, three genes were selected for further study in the classroom.
Figure 1. Wild-type Caenorhabditis elegans hermaphrodites collected from a single culture. Pictured are the adult animal (with fertilized and unfertilized oocytes), early larvae, and an unhatched embryo.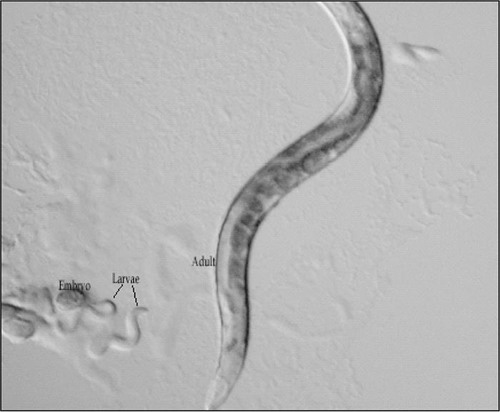
As part of the laboratory exercise, students used three databases to perform a rudimentary sequence analysis of the selected genes. Sequence information is available in its simplest and most direct form at the C. elegans web site known as WormBase ( http://www.wormbase.org). Students performed a sequence search in WormBase using the cosmid ID for their predicted gene, C17C3.8, F31A3.2, or F31A3.4. In WormBase, students were able to select links to display the spliced or unspliced DNA sequence or the deduced amino acid sequence for their gene. WormBase also provided students with information about the number and boundaries of the exons for their gene and the gene's chromosomal location.
To identify functional domains within the protein, students copied the deduced amino acid sequences into the SMART database ( http://smart.embl-heidelberg.de/). In SMART, symbols are used to represent protein domains. Students used SMART to determine which amino acids within their protein make up the HLH domain. Finally, they also used the BLAST engine ( http://www.ncbi.nlm.nih.gov) to identify non-C. elegans homologues of the predicted proteins. BLAST was also useful for performing alignments of their predicted proteins with other HLH proteins. After the 2-h laboratory session, students worked with their laboratory partners to address twelve questions pertaining to the sequence of their genes (see Table 1). They used their responses to write the results section of their research articles, which included a schematic of their assigned gene. Figure 2 is a sample of one student's schematic for the sequence C17C3.8.
| Function Genomics in Caenorhabditis elegans Specific aim 1: To perform a DNA and protein sequence analysis of the predicted HLH protein“—” |
|---|
| Directions: This laboratory assignment will not take place in class. After the in-class demonstration, you and the members of your group will use BLAST, SMART, and WormBase search engines to answer the following questions. While this work will be on the computer, indicate in your laboratory notebook the steps you take for completing this aim. When you write your laboratory report, the data here should be organized as charts, tables, and/or sequence alignments. |
|
RNA ANALYSIS OF GENE EXPRESSION
Gene expression involves the transcription of a DNA template into RNA and the subsequent translation of that RNA into protein. Often, prior to translation, an mRNA is further modified in the eukaryotic cell. One modification involves the removal of introns or non-protein-coding regions from the immature RNA molecule. This process is known as splicing. As a result of splicing, a given mRNA molecule in a eukaryotic cell will be significantly shorter than the original DNA strand from which it was made. RT-PCR is a means of selectively comparing the sizes mRNA molecules to the DNA for the same gene. Because an unexpressed gene would not produce RNA, RT-PCR is also a means for determining if a gene is expressed. For RT-PCR, total RNA is purified from animal cells. That RNA is treated with a DNA polymerase that synthesizes a complementary DNA (cDNA) strand by using mRNA as a template, thus the name reverse transcriptase. When a gene-specific primer that is complementary to the 3′ end of the mRNA is included in the RT reaction, a cDNA is made only for the gene of interest. If a particular gene is not expressed, there will be no mRNA corresponding to that gene in the total RNA and the RT reaction will not be successful. PCR is then used to amplify the cDNA further so that it can be easily detected. If a control tube is included in the PCR containing genomic DNA as a template rather than cDNA, the sizes of the two products can be compared by agarose gel electrophoresis.
To determine if their specific gene is expressed, students isolated total RNA from mixed-stage populations of wild-type Caenorhabditis elegans hermaphrodites. Samples of the student protocols are available from the authors upon request. Students visualized their RNA by agarose gel electrophoresis and determined the RNA concentration by UV spectroscopy. Students then used approximately 1 μg of the total RNA in RT reactions. They subsequently used one-fourth of the RT reaction as the template in the PCR. As a negative control, total RNA that was not treated with reverse transcriptase was used as the template in the PCR. The positive control for the PCR contained genomic DNA as a template. After agarose gel electrophoresis, students correlated their sequence analysis data with the RT-PCR data. In the results section of their research articles, they were required to discuss these data and to suggest methods for confirming their preliminary RT-PCR data. Figure 3 shows sample RT-PCR results and analysis for one student group.
ASSESSMENT OF STUDENT LEARNING
The goals of this exercise were to increase student awareness of bioinformatics and to increase their understanding of laboratory approaches to functional genomics. At the end of the exercise, each student wrote a“ research article” to demonstrate his/her understanding. In the introduction to their final research article, students were required to include basic definitions of bioinformatics and functional genomics, as well as a brief rationale of why C. elegans is a useful organism for these types of studies. They also included information on HLH proteins and their roles in human disease and disorders. Students were required to write a brief description of gene expression and to explain the difference between“ having a gene” and “expressing a gene.” In the methods section, students gave succinct descriptions of the techniques used without including the detailed protocols. The results and discussion sections of their paper included detailed explanations of their laboratory results. Although the writing skills varied from one student to another, the use of a rubric established prior to the exercise was useful for scoring student understanding (see Figure 4). Basic information in the reports of 100% of the students included descriptions of the RT-PCR results. Students correctly identified positive and negative controls and explained why lanes of an agarose gel did or did not contain PCR fragments. The students were also able to tell whether or not the RT-PCR was successful (as indicated by the presence or absence of a PCR fragment) for their gene. These descriptions were an indication that the students understood the techniques used.
Figure 2. Student sample of sequence analysis for C17C3.8. The top panel represents the genomic DNA for C17C3.8. As indicated, this gene contains three exons and two introns. The genomic DNA contains 744 base pairs (bp) when unspliced and 633 bp when spliced. The bottom panel represents the cDNA for C17C3.8. The bars represent the nucleotides within the cDNA that would encode the helix–loop–helix domains within the protein. The amino acid linker between the domains is 14 amino acids long.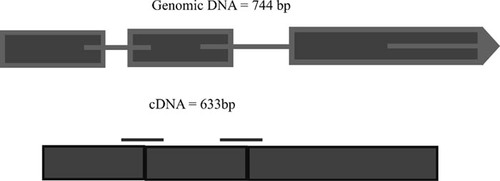
Figure 3. Student sample of RT-PCR results for F31A3.4. RT was carried out for 1 h at 37°C. PCR was carried out for 30 cycles using an amplification temperature of 50°C. Lanes 1 and 4: positive controls using genomic DNA as the template for PCR. Lane 2: RT reaction as the template for PCR. Lane 3: negative RT control. RNA in this control was never incubated with reverse transcriptase. Lane 5: RT reaction as the template. In this case, the RT was performed using the opposite primer. Lane 6: negative PCR control. This lane contained no DNA polymerase.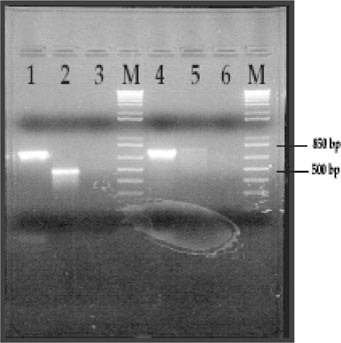
When interpreting the results, however, approximately one student per group (25% of the class) did not associate the size differences between the genomic DNA and the cDNA fragments with splicing. The remaining 75% of the class clearly used the sequence analysis data to interpret the RT-PCR data. Namely, they were able to predict the sizes of the fragments to be expected from RT-PCR and they were able to suggest methods for confirming their preliminary data.
Further assessment included a weekly inspection of their laboratory notebooks. Students who kept detailed and accurate notes were more likely to understand the objectives of these exercises. Their notes often included questions about the theoretical aspects of the lab and indicated topics they needed to study further. For example, one question during the sequence analysis was to determine the expected size of the PCR products for their gene. One student made notes reminding herself to review how to determine where a given primer would bind. Likewise, students who simply copied the protocols were not able to provide well-written research articles at the end of the laboratory activity.
ASSESSMENT OF LABORATORY EFFECTIVENESS
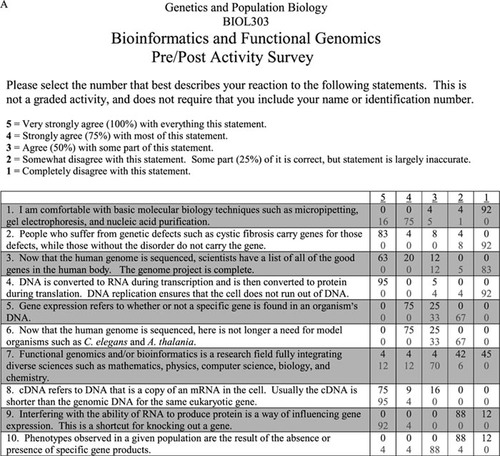
To measure the effectiveness of this laboratory exercise, all 24 students in the class were given pre-activity and post-activity surveys. These surveys are provided in Figure 5, A–C. Part A of the pre-/postactivity survey (Figure 5A) consists of 10 statements. Students were asked to indicate how strongly they agreed or disagreed with the accuracy of each statement. These statements were intended to assess prior exposure to basic research and the students' general understanding of molecular genetics. Because the same questions were used in both surveys, the differences in the responses were used to measure the effectiveness of the activity. Through their responses to statement 1, for example, students indicated that they were more comfortable with basic molecular biology techniques after participating in this activity. Student responses also indicated that they better understood that all members of a species have the same genes. Prior to the activity, most students believed that phenotypic differences in people were due to the presence or absence of genes rather than to differences in alleles for that gene (see statements 2, 5, and 10).
Figure 4. Rubric for laboratory report assessment. Students wrote laboratory reports formatted as research articles. Students were provided with detailed instructions on how to format the reports and general instructions on the type of information to include. The rubric was used as an assessment of student understanding.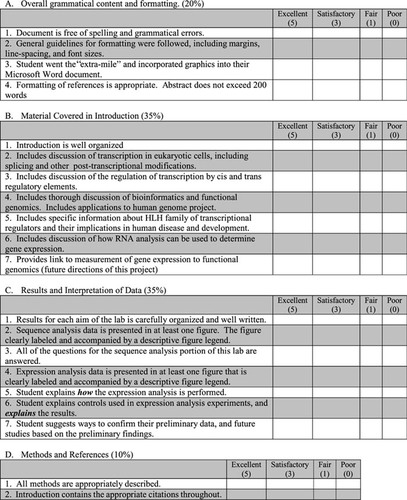
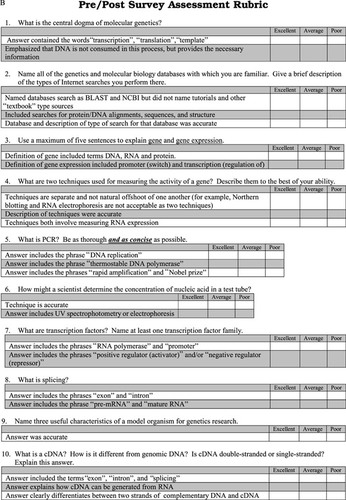
Part B of the pre-/postactivity survey (Figure 5B) consists of 10 short-answer questions that deal with students' knowledge of gene expression, transcription, and the central dogma of genetics. The rubric used to assess the survey is included in Figure 5B. Many of the questions in this section of the survey were discussed during the lecture component of the class. As such, approximately 30% of the students were able to describe accurately the central dogma (question 1), gene expression (question 3), PCR (question 5), transcription factors (question 7), splicing (question 8), and cDNA (question 10) in the preassessment survey. During the postsurvey, 87% of the class gave at least an average description in response to each of those questions. Thirty percent of the students gave an excellent description in response to each of those questions. Prior to the activity, students were not able to name molecular biology or genetics databases (question 2) and were not able to describe nucleic acid quantitation accurately (question 6). Both of these questions were answered by 100% of the students after the activity was completed.
Figure 5. The effectiveness of this of this laboratory activity was assessed by preactivity and postactivity surveys that consisted of three parts. (A) The first part of the assessment consists of 10 statements. Students indicated how strongly they agreed with or disagreed with the statements. Numbers given indicate the percentage of students who chose a particular response prior to (top line) and after (bottom line) the activity. (B) The second part of the assessment consist of 10 short-answer questions that require the students to describe or define key terms and concepts. Student responses were measured for accuracy using the rubric shown. Rubrics were not included when the survey was given to students. (C) The third part of the assessment was given only during the postactivity survey. This section was not assessed but used to improve the activity for future classes. (Figure continues on next page.)
Part C of the survey (Figure 5C) was included only with the postactivity survey. This section consists of five questions that solicit comments and suggestions from the students about ways to improve the activity for future classes. Most students made comments that were extremely useful for improving the laboratory exercise. When asked, “Which activity in the sequence analysis segment best demonstrated how DNA sequence and protein sequence are related?” one student gave the following response.
It was really difficult to figure out which exons of my gene contained the helix–loop–helix domain. I was forced to go back and forth between SMART and Worm-Base because my answers didn't make sense. Then I realized I had to convert the amino acid numbers that SMART gave me to nucleotide number before I could use WormBase to find the exon. I hated doing that part but I will never forget how to do it.
When asked to describe the least helpful portion of the sequence analysis lab one student wrote,
Using WormBase to determine the sizes of the unspliced and spliced DNA could be done differently. Although the site clearly said spliced and unspliced, I did not connect that to introns and exons and splicing that we talked about in class until it was too late. You should give the students the unspliced sequence and make them pick out the spliced sequence themselves.
Students were asked for ways to improve this laboratory activity. They suggested adding another week to give them more time. The strongest suggestion was that another week be added where students are able to include assays to confirm their RT-PCR data. Another good suggestion from the students was that future classes look for genes that are more obviously related to human development.
CONCLUSION AND FUTURE PLANS
The laboratory activity described here demonstrated how functional genomics is a logical outcome of the Human Genome Project. This activity was performed with undergraduate biology majors. At Morgan State University, Genetics and Population Biology is offered to students during their junior year. These students have already taken 1 year of Introductory Biology and 1 semester each of Ecology and Developmental Biology. They have also completed 1 year of Organic Chemistry. Students may or may not have taken one semester of Cellular and Molecular Biology and one semester of Biochemistry. To make sure that students have the background needed to understand the concepts demonstrated here, this activity is scheduled after essential information about DNA replication, transcription, and PCR is introduced in the lecture component of the course.
Many of our students choose to major in biology because they are interested in medical or dental school. Very few of them have been exposed to basic biomedical research, and many of the students believe that research is very much like the packaged, classroom laboratory exercise. One of the major goals in adapting this laboratory activity was to expose students to the actual research environment. This 2-week activity served as a reasonable“ long-term” project that required students to keep accurate and detailed notes of their laboratory activities. Additionally, this was an activity where the answer was not predetermined, and in fact, there was no“ correct” answer. This activity also stressed the essentials of experimental design and encouraged students to consider the next logical step in completing the goals of the research project. Students seemed more excited about the laboratory activity after they realized that their results provided preliminary data for an ongoing research project. At the end of the activity, more students (approximately 20% of the class) expressed an interest in summer internships and graduate programs.
Because student awareness of function genomics and bioinformatics did increase, and because more students were interested in information about research careers, this activity will remain a part of our course. The number of students who take this course during one semester varies between 16 and 25. As luck would have it, 24 students were enrolled in this course when this activity was first implemented. Students worked in groups of four to complete the laboratory exercises. Four was chosen as the maximum number of students in a group so that each student could be an active participant. Prior to each lab, students split the protocols so that each member of the group was responsible for a given segment. The best example of this is during the RNA isolation procedure. All four students were given cultures of nematodes to wash and pellet. These pellets were frozen and combined in one container and ground to a fine powder. While two students were working to grind the worms, the other two students were gathering the materials needed for the subsequent RNA isolation, labeling the microcentrifuge tubes, and preparing any of the necessary dilutions. Likewise, during the analysis of the RNA, one pair of students worked to make serial dilutions for spectrophotometric readings while the other pair prepared the agarose gels needed for electrophoresis. While the large number of students in this course was certainly not an ideal situation, it had the advantage of providing two sets of data for each gene sequence assayed. The undergraduate research assistants were given the job of resolving any conflicts between the two sets of data.
Clearly, one advantage of implementing this laboratory activity is that every biology major at Morgan State University will have some experience in laboratory research. It should be noted, however, that the size of the class will drastically affect the amount of time and effort that goes into preparing for the laboratory. We were able to implement this activity for the first time, despite the large class size, because of the efforts of two undergraduate students. These students helped with medium preparation and strain maintenance and optimized the PCR conditions for this activity. These students also prepared aliquots of buffers and other reagents provided in the commercial kit. Finally, the students did follow-up experiments that included repeating the RNA purifications and RT-PCR to confirm the results obtained by the class. Recent funding from the National Science Foundation will provide a laboratory technician to help with these activities in future classes.
Although this laboratory activity was considered a success, it is still a work in progress. There are several modifications planned for future classes. First, the laboratory activity will be extended another 4 weeks, so that it covers the entire first half of the semester. With this modification, students will have more time to isolate and quantitate the total RNA prior to RT-PCR. Second, students will clone their products from RT-PCR into a vector containing T7 and T3 promoter sequences. These vectors allow in vitro transcription using either T7 or T3 polymerase. Third, the students will synthesize double-stranded RNA in vitro and use that RNA for RNA interference assays. With the addition of by these activities, students will actually be able to see if the functions of their gene products are required for normal development. Adding these sections will also allow students to link the molecular aspects of genetics to the more classical aspects of gene transmission.
In this activity, students used sequences predicted to encode HLH transcription factors because these proteins regulate several critical processes in eukaryotic development and because that is the current research focus for our laboratory. Future implementations of this lab will probably use genes that produce more dramatic affects during RNA interference or analogues of human genes that are of interest to the students. This activity can easily be modified to assay the activity of any gene or gene family and to use RNA isolated from other eukaryotic systems. As a whole, it provides a wonderful mechanism for demonstrating the relevance and importance of functional genomics to understanding eukaryotic gene expression.
APPENDIX
Preparations for the Laboratory Activity
Sequence Analysis of the Caenorhabditis elegans Genome
Approximately 8 weeks before the laboratory activities were to begin, undergraduate research assistants used BLAST and WormBase to identify predicted helix–loop–helix (HLH) genes in the C. elegans genome. This activity could be easily modified at this point to include any gene of interest to the course instructors. Once a gene had been selected, BLAST was used to identify C. elegans homologues. Information about cosmid sequences identified in this manner can be found in WormBase. At the WormBase home page, the cosmid and gene name is entered in the search panel. For the activity described here, C17C3.8 represents gene 8 on cosmid C17C3. From the search results page, the sequence option is chosen. Information for that particular gene will appear on the gene's home page. In addition to sequence information, this page will indicate if gene expression has been confirmed, the chromosomal location for the gene, and other useful information. If RNA expression data have been collected for this gene, they will also be indicated on this page.
Oligonucleotide Design for RT-PCR
Oligonucleotide primers were ordered from Integrated DNA Technologies ( www.idtdna.com) 6 weeks prior to the class activity. Primers corresponded to the termini of the coding region so that the entire gene or cDNA would be amplified in PCR. Primers were typically 15 to 21 nucleotides that were complementary to either strand of DNA and were designed so that their melting temperatures (Tm) were within 4°C of one another. Undergraduate research assistants optimized the PCR amplification conditions 4 weeks prior to the class activity. Primer sequences used for this study and PCR conditions are listed in Table A1.
| Primer name | Primer sequence (5′ → 3′) | Tm, 50 mM NaCl | Restriction enzyme site |
|---|---|---|---|
| C17.8kpn | GGT ACC ATG TCT TCC TCT CCA ACT TCG | 62.1 | KpnI |
| C17.8bam | GGA TCC TCA GCC AAC AAT ATC GAT ATC TTT | 60.3 | BamHI |
| F31.2kpn | GGT ACC ATG CGG GCC ATT GCA TT | 64.3 | KpnI |
| F31.2bam | GGA TCC TCA GCC AAT AAT ATC GAT ATC TTC CTC | 61.4 | BamHI |
| F31.4kpn | GGT ACC ATG CCA AAA GTA CAT CAA GCA AC | 62.2 | KpnI |
| F31.4bam | GGA TCC GCC AAT AAT ATC GAT ATC TTC CTC | 60.2 | BamHI |
Growth and Maintenance of Caenorhabditis Elegans Cultures
The wild-type strain of C. elegans (N2) and the bacterial strain OP-50 (used for feeding C. elegans) can be obtained from the Caenorhabditis Genetics Center ( http://biosci.umn.edu/CGC) by submitting a request by E-mail to [email protected]. This request should be submitted at least 10 weeks ahead of time and should include a one-sentence description of what you will do with the strain. Strains are usually shipped by U.S. mail within 10 days of the request. Educational and nonprofit organizations receive the strains gratis.
Preparation for these laboratory activities will involve growing large cultures of Caenorhabditis elegans for purification of DNA and total RNA. Techniques for preparing the media, bacteria, and nematodes for use have been described previously in this journal (Guziewicz et al., 2002) and by Epstein and Shakes (1995).
Nematode Preparation for DNA Extractions. These nematodes were prepared (minimally 10 days before genomic DNA preparation. Twenty seeded 100 × 15-mm NGM agar plates were inoculated with 10 to 15 adult hermaphrodites 6 days prior to collection. Plates were incubated at 22°C, with the lid facing down, for the 6-day period. During this time, approximately two generations of hermaphrodites were produced. Since each hermaphrodite laid approximately 300 eggs, a total of approximately 18,000,000 animals was produced. At the end of 6 days, the animals were rinsed off the surface of the agar into a 50-ml conical centrifuge tube using sterile water. All 6 plates could be combined into a single tube. The animals were then centrifuged for 3 min at 3000g. The water was siphoned off using a sterile pipette and discarded. The worms were then resuspended in 50 ml of fresh sterile water and centrifuged again. After the water was removed, worm pellets were resuspended in 6 to 8 ml of EN buffer (100 mM NaCl, 10 mM EDTA, pH 7.6). Aliquots of 50 μl were transferred to 1.5-ml microcentrifuge tubes and frozen using a dry ice–ethanol bath. These frozen stocks could be stored indefinitely until used for DNA isolations.
Nematode Growth for RNA Isolations. Six days prior to the laboratory activity, four to eight seeded 100 x 15-mm NGM agar plates were inoculated with 10 to 20 wild-type hermaphrodites (adult animals) for each laboratory group. Animals were allowed to reproduce for 6 days at 22°C.
Isolation of Genomic DNA
For the class of 24 students, six tubes of 50-μl worm aliquots were allowed to thaw on ice. After thawing, 450 μl of worm lysis buffer (0.1 M Tris, pH 8.5, 0.1 M NaCl, 50 mM EDTA, 1% sodium dodecyl sulfate [SDS]) and 20 μl of 20 mg/ml proteinase K (in Tris-EDTA [TE], pH 7.4) was added to each tube. The tubes were vortexed vigorously and then incubated at 62°C for 45 min. The tubes were vortexed at 5-min intervals throughout the incubation period. Clearing of the solution was used as an indication of worm lysis. After the incubation, each tube was first extracted with 500 μl of phenol, followed by a phenol:chloroform extraction and a subsequent chloroform extraction. The DNA was precipitated for 10 min at room temperature by adding 40 μl of 10 M NH4Oac and 750 μl of ethanol. Following centrifugation at 18,000g for 5 min, the DNA pellet was washed with 70% ethanol and centrifuged again. All of the ethanol was removed, and the pellet was air-dried prior to resuspension in 50 μl of TE, pH 7.4. After precipitation, genomic DNA could be stored at –20°C indefinitely.
Total RNA Purification
Total RNA was purified using the RNeasy Total RNA Purification Kit (catalog No. 74104) from Qiagen, Inc. (Valencia, CA; www.qiagen.com). Each group of students was given four 100 x 15-mm NGM agar plates containing mixed-staged populations of C. elegans hermaphrodites. The animals were rinsed from the plates with approximately 12 mL of sterile distilled water per plate. The worms were pelleted by centrifugation at 3000g for 15 min and rinsed with an additional 50 ml of sterile water. The animal pellets were quick-frozen on dry ice, ground to a fine powder using a mortar and pestle, and homogenized using a Qiashredder column from Qiagen, Inc. (catalog No. 79654). The total RNA was treated with DNAfree (catalog No. 1906) from Ambion, Inc. (Austin, TX; www.ambion.com) to remove contaminating genomic DNA. The yield of RNA was determined spectrophotometrically, and the quality of the RNA was checked by gel electrophoresis. In the classroom, the purification process took 1.5 h. The most time involved collecting the animals and grinding them for subsequent purification. To streamline this process, instructors might consider collecting and freezing the animals prior to the class activity, but this may decrease the levels of RNA obtained. RNA quantitation and gel electrophoresis were not performed in the same class period as the purification step.
RT-PCR Analysis of Gene Expression
RT and PCR were performed in separate tubes. Generally, students used 1.0 μg of total RNA in RT reactions with a 1.0 μM concentration of each oligonucleotide primer. Prior to the addition of buffers and enzyme, students incubated the primers with the RNA at 70°C for 10 min. The RNA–primer mixture was placed immediately on ice. Reaction components were then added and RT was carried out using the OmniScript Reverse Transcriptase Kit (catalog No. 205110; Qiagen, Inc.), following the manufacturer's directions. As a negative control, each group handled a second 1.0-μg aliquot of total RNA in the same manner but did not add the enzyme reverse transcriptase.
PCR was performed using the Taq PCR Core Kit (catalog No. 201223) from Qiagen, Inc. Control tubes as the PCR contained 100 ng of genomic DNA as template. For RT-PCR, one-fourth of the RT reaction (or the RT control) was added to the tube for PCR. PCR was performed in a Perkin–Elmer thermocycler. The program consisted of an initial denaturation step at 95°C for 5 min, followed by 30 cycles at 94°C for 1 min, 58°C for 1 min, and 72°C for 1 min. The program ended with a final elongation step at 72°C for 10 min.
Students completed the RT and PCR setup in one class period. The reactions were removed from the thermocycler by the instructors and frozen at– 20°C until the next class period. At that time, PCR products were analyzed by gel electrophoresis.
FOOTNOTES
Monitoring Editor: William B. Hood
ACKNOWLEDGMENTS
We thank William Nelson for helpful discussions and critical reading of the manuscript. We also thank Tuesday Tibbs, a participant in the Summer High School Internship Program (SHIP), for purifying the genomic DNA used in this activity. The SHIP program is sponsored by NASA. The wild-type strain of Caenorhabditis elegans was provided by the Caenorhabditis Genetics Center. This work was supported by NSF Grants MCB9986640 and MCB0212336 to C.J. V.G. is an undergraduate Minority Access to Research Careers fellow, supported by NIH Grant 5T34CM07977-19. T.M. is a master's degree candidate and an NIH Bridges Fellow supported by NIH Grant 1R25GM60191-01. E.J. is an undergraduate student supported by NSF Grant MCB0212336.


