Developing Information Fluency in Introductory Biology Students in the Context of an Investigative Laboratory
Abstract
Students of biology must learn the scientific method for generating information in the field. Concurrently, they should learn how information is reported and accessed. We developed a progressive set of exercises for the undergraduate introductory biology laboratory that combine these objectives. Pre- and postassessments of approximately 100 students suggest that increases occurred, some statistically significant, in the number of students using various library-related resources, in the numbers and confidence level of students using various technologies, and in the numbers and confidence levels of students involved in various activities related to the scientific method. Following this course, students should be better prepared for more advanced and independent study.
INTRODUCTION
In recent years, introductory science laboratory courses at many colleges and universities have evolved from being a series of exercises designed simply to demonstrate scientific principles to being investigative experiments designed to engage students in the scientific method (National Research Council, 2002). Scientific educators advocate that student participation in the scientific method (i.e., following the steps from observation to hypothesis formulation to data analysis, conclusions, and presentation) at an earlier stage of the academic career provides more effective teaching and training of future scientists (Siebert and McIntosh, 2001). However, while using hands-on experimentation (laboratory research) to boost student interest and comprehension (Biological Science Curriculum Study, 1993), professors face the additional challenge of teaching students the information-gathering skills required of real-life researchers.
Students must learn to seek previously published information (library research), both to guide their hypothesis formulation and also to place their own results in context. In years past, students would consult abstracts, books, and journals within the physical confines of the library. With the advent of digital citation databases and electronically published journals, students are now likely to conduct much of their library research online. However, because most lack formal training in the nature of scientific information, many students possess insufficient skills to discriminate between valid and invalid electronic sources. As Lyman (2001) notes, “The Internet is now used as an information resource of first resort, including Web pages, Usenet, and electronic mail. The Web represents the end of authorship, because the Web erases the distinction between writing and publishing, thereby abandoning the quality control that makes printed information efficient, but it is more democratic because it lets the reader be the judge” (p. 30). Furthermore,“ Unofficial documents used to be a private matter—like photo albums or letters that were occasionally archived and preserved in public institutions. But the network includes everything, public and private, true and false, good and bad” (p. 31).
With these statements, Lyman (2001) attracts our attention to a fundamental issue facing education. Previously, educators could direct students to written literature with some faith in the process of careful and informed peer review that preceded the publication. The scientific community relies on such peer review to provide validity to its literature (Bloom, 1999). However, now educators must train students themselves to assess the validity of what they encounter. What defines information as valid has not changed over the years, but what defines publishable information has certainly changed with increased use of the Internet. The official documents to which Lyman (2001) alludes used to be the only documents readily available. Now unofficial documents may appear official to the indiscriminate viewer. With much less than 1% of new information produced in 1999 being printed on paper (Lyman, 2001) and knowing that much of the vast amount of information published digitally is unofficial, we see that the proverbial problem now facing students is finding the official needle in the haystack. One might argue that proper search technique allows one to find the needle, yet it is increasingly clear that search technique may only limit the quest to one of many haystacks. Instead, knowledge of how information is generated, reviewed, published, and referenced in a particular field is necessary to serve as the magnet for the needle. Therefore, it must be the goal of educators to provide students with this magnet early in their undergraduate careers.
The Associated Colleges of the South ( http://www.colleges.org), a consortium of 16 distinguished liberal arts institutions, defines information fluency in the following way. “Using critical thinking skills and appropriate technologies [the information-fluent individual], integrates the abilities to collect the information necessary to consider a problem or issue, to employ critical thinking skills in the evaluation and analysis of the information and its sources, and to formulate logical conclusions and present those conclusions in an appropriate and effective way” (Associated Colleges of the South, 2002).
The juxtaposition of information fluency and the scientific method has been one goal of an introductory biology laboratory course at our institution for several years. Our initial experience with fostering information fluency in the context of laboratory research underscored the need for a more refined and collaborative approach. Despite more careful guidance in assignments, incoming students seemed less and less able to evaluate information sources critically. We conjectured that while incoming students show a growing propensity to use the Internet as their primary information resource, they are perhaps even less familiar with the ways in which information is generated and reported in the field of biology. Thus, we felt it critical to collaborate with information services staff, librarians, and students to formulate the most effective approaches for fostering information fluency among our students and ourselves. Although our efforts were initially directed toward an introductory zoology laboratory, we have adapted the approach to our new introductory course focusing on molecular and cellular biology.
METHODS
Pedagogical Design
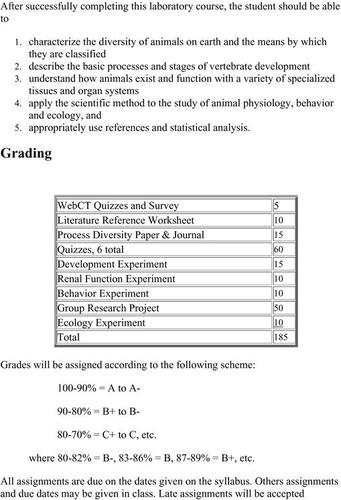
The introductory biology laboratory highlighted here occupies one semester, with multiple sections of approximately 24 students meeting one afternoon per week for 3 h. We sought to provide students with practice and understanding of the scientific method. This included the ability to find and evaluate primary (peer-reviewed) and secondary literature and use that information in supporting hypotheses and conclusions, to conduct experiments and analyze results, to present results and conclusions orally and in writing, and to document and reference information appropriately. Instruction included a class presentation by the campus library's electronic resources librarian; a written description of the modes of reporting information in biology describing the roles of primary literature, reviews, academic texts, and popular press; and a worksheet illustrating important points of each. Students then used this instruction to guide their library research and writing on a course-related topic assigned by the professor. Throughout the semester, we provided students with assignments, exercises, and hand-outs to lead them through individual steps of these processes. Each assignment built on the previous ones and gave the students progressively more autonomy. Finally, the semester's activities culminated with independent laboratory research projects designed and conducted by the students. Students reported their work in oral presentations facilitated by PowerPoint. Project proposals, course syllabus, exercises, and survey with results are available online (Lindquester, 2002). The course syllabus and exercises are also available in the following Appendices.
Appendix 1: Syllabus
Appendix 2: Schedule of Assignments
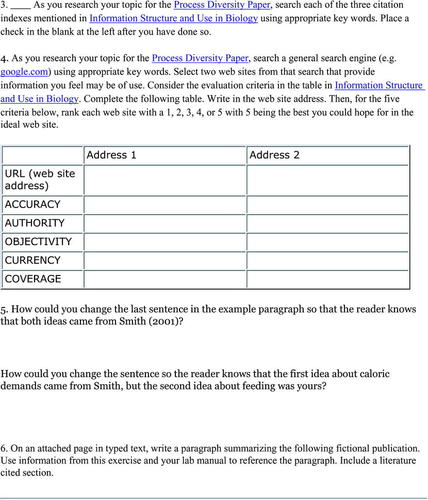
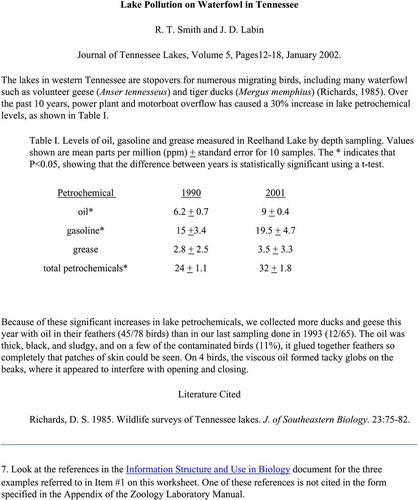
Appendix 3: Literature Reference Worksheet
Appendix 4: Information Structure and Use in Biology
Appendix 5: Citation Guidelines
Appendix 6: Process Diversity Paper Instructions
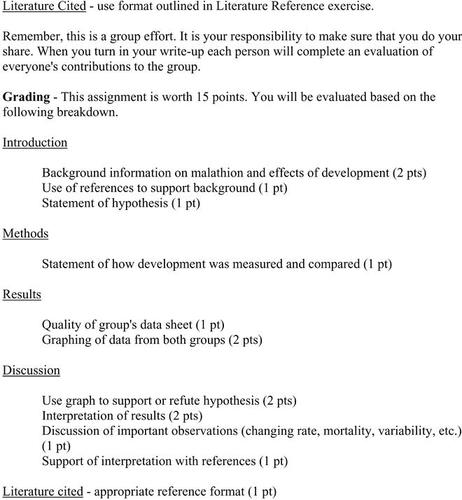
Appendix 7: Development Experiment Report Guidelines
Appendix 8: Renal Function Experiment Worksheet
Appendix 9: Behavior Experiment Report Guidelines
Appendix 10: Proposal Preparation Guidelines
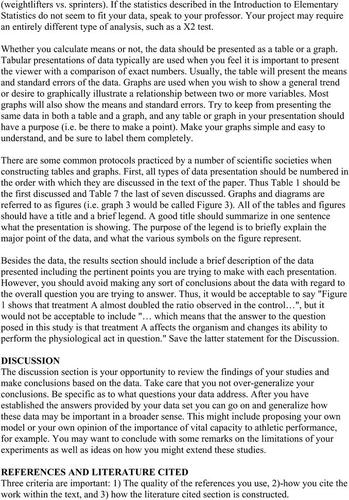
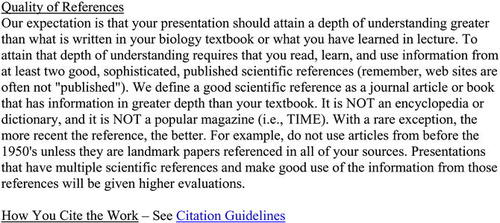
Appendix 11: Scientific Presentation Guidelines
Appendix 12: Ecology Experiment Worksheet
Assessment Survey
We designed the survey to evaluate the influence of the introductory biology laboratory on the perceptions and abilities of students to gain confidence regarding different technologies, information sources, and research skills. Students answered whether or not they used a particular program, skill, or resource (Table 1). If affirmative, students then rated their level of confidence in the use of that particular program, skill, or resource. Ratings ranged from 1 to 5, with 5 being the most confident. We used the same web-based survey at the beginning and end of the course. Students knew that the course required completion of the survey, and they received credit for completing the survey. However, all responses were confidential; students were informed that instructors had no way to correlate respondents and their responses.
| Programs | Critical thinking skills | Library activities |
|---|---|---|
| • Word processor (e.g., MS Word) | • Worked with others to identify research topic | • Used a general Web search engine |
| • Spreadsheet (e.g., Excel) | • Gathered Web-published background information | • Used a scientific Web search engine (e.g., Medicine) |
| • Presentation software (e.g., PowerPoint) | • Gathered print-published background information | • Used online database (e.g., InfoTrac) |
| • HTML Editor (e.g., FrontPage) | • Modified or changed a topic based on background research | • Used Rhodes online catalogue |
| • e-mail with file attachments | • Started background research 4 weeks prior to due date | • Consulted with a Rhodes librarian |
| • Scanner | • Started background research 2 weeks prior to due date | • Used hard copy periodicals in library |
| • File Servers (e.g., Student_Vol) | • Started background research 1 week prior to due date | • Used hard copy scientific journals in library |
| • Prepared a formal proposal | • Used hard copy books in library | |
| • Conducted scientific experiment of own design | • Used abstracts only of online scientific journals | |
| • Conducted statistical analysis of experiment | • Used full-text of online scientific journals | |
| • Prepared formal written report of experiment | • Asked for an interlibrary loan | |
| • Prepared formal oral report of experiment | ||
| • Developed own, new ideas or experiments |
Statistical Analyses
We assembled the before and after responses in an Excel spreadsheet and calculated the percentage of users for each program, skill, or resource in addition to the mean confidence level for affirmative users only. We did not include confidence levels reported by negative users. End usage for each variable, percent change, and mean confidence levels before and after the course comprised our results. For before and after comparisons, the survey data did not fit a normal distribution in most cases and could not be transformed successfully. Therefore, we used nonparametric statistics. To evaluate the impact of the laboratory course statistically, we ran Mann-Whitney U (MWU) tests on the before and after confidence levels.
Comparisons between Skills or Activities
For questions that are directly related to each other, we compared confidence levels before and after using a two-way analysis of variance (ANOVA). Although the data did not meet a normal distribution and could not be successfully transformed, we employed two-way ANOVAs for these analyses. We lacked the software necessary to do nonparametric, multiway analysis. Although nonparametric tests would be preferable, ANOVA is robust for the assumption of a normal distribution (Zar, 1996). We give the significance term of the variable, which gives information about whether the two or three variables significantly differ, regardless of time. If three variables occurred, we performed a Tukey's Multiple Comparison Test (MCT) to elucidate the specific differences between variables. The significance term of the time-by-rating interaction specifies if the confidence level significantly changed between variables over time. For example, a twoway ANOVA could evaluate whether the confidence levels of students differed in giving written versus oral reports before and after the course. We performed all statistical analyses using SPSS version 10.1 and created graphs in Excel.
Graphical Analyses
In addition to evaluating use of programs, skills and resources, the survey asked students to evaluate the qualities of four information sources (i.e., textbook, review paper, Web site, or journal article). For these questions, inferential statistics are not appropriate so we simply plotted the change in response before and after the course or the evaluation breakdown. In this case, a negative number denotes that fewer students reported that a particular source best matched the question. In addition, we did test for a change in confidence over time regarding assessing these four information sources using MWU tests.
Independent Data
In addition to student self-reporting in the survey, throughout the semester we tracked usage statistics for the three databases introduced to the students at the beginning of the term and compared database usage to the same months the previous year.
RESULTS
Nearly 100 students participated fully in both surveys (98 before and 95 after). Tables 2, 3, 4 provide the results of statistical tests.
| Program | Responses (N) before course | Responses (N) after course | p value |
|---|---|---|---|
| • Word processor (e.g., Word) | 97 | 94 | .002 |
| • Spreadsheet (e.g., Excel) | 88 | 88 | <.001 |
| • Presentation software (e.g., PowerPoint) | 98 | 94 | <.001 |
| • HTML Editor (e.g., FrontPage) | 32 | 34 | .008 |
| • e-mail with file attachments | 87 | 90 | <.001 |
| • Scanner | 63 | 54 | .433 |
| • File Servers (e.g., Student_Vol) | 86 | 92 | <.001 |
| Critical thinking skill | Net change in users (%) | Responses (N) before course | Responses (N) after course | p value |
|---|---|---|---|---|
| • Worked with others to identify research topic | +10.2 | 88 | 94 | .036 |
| • Gathered Web-published background information | +3.1 | 95 | 94 | .051 |
| • Gathered print-published background information | +3.0 | 93 | 93 | .774 |
| • Modified or changed a topic based on background research | −3.0 | 83 | 76 | .119 |
| • Started background research 4 weeks prior to due date | −22.4 | 63 | 42 | .185 |
| • Started background research 2 weeks prior to due date | −1.3 | 85 | 82 | .009 |
| • Started background research 1 week prior to due date | +5.9 | 85 | 88 | .233 |
| • Prepared a formal proposal | +42 | 46 | 86 | .161 |
| • Conducted scientific experiment of own design | +48.8 | 45 | 89 | .001 |
| • Conducted statistical analysis | +30.6 | 66 | 94 | .030 |
| • Prepared formal written report of experiment | +24.8 | 64 | 93 | .003 |
| • Prepared formal oral report of experiment | +51.7 | 36 | 82 | .001 |
| • Developed new ideas or experiments based on background information | +41.3 | 39 | 77 | .003 |
| Library activity | Net change in users (%) | Responses (N) before | Responses (N) after | p value |
|---|---|---|---|---|
| • Used a general search engine | −1.1 | 98 | 93 | .115 |
| • Used a scientific search engine | +64.2 | 33 | 92 | .254 |
| • Used an online database | −3.0 | 63 | 66 | .225 |
| • Used campus online catalogue | +19.3 | 75 | 90 | .041 |
| • Used online catalogues of other local libraries | +17.3 | 46 | 60 | .507 |
| • Consulted with a librarian | +16.3 | 49 | 61 | .062 |
| • Used hard copy general periodicals in the library | −2.3 | 59 | 55 | .066 |
| • Used hard copy scientific journals in the library | +23.4 | 39 | 60 | .846 |
| • Used hard books in the library | +16.4 | 77 | 91 | .343 |
| • Used only abstracts in online scientific journals | +47.8 | 48 | 92 | .469 |
| • Used full text articles in online scientific journals | +44.6 | 46 | 87 | .731 |
| • Asked for an interlibrary loan | −1.6% | 16 | 13 | .268 |
Programs
Nearly 100% of participants reported that they used word processing (Word), spreadsheet (Excel), and presentation (PowerPoint) programs by the end of the course. Fewer students used HTML programs (FrontPage) and a scanner. The use of these programs also did not increase dramatically with the course. We found generally high confidence in use of programs, and confidence significantly increased with time, except in the use of scanners (Figure 1; Table 2). Confidence in spreadsheet, presentation, and HTML programs ranked lower than with word processing, e-mail, or use of the file server (i.e., an on-campus network). Note that this course did not incorporate use or instruction in HTML or scanning, although students did have access to a scanner and some may have used it when preparing PowerPoint presentations.
Skills
We witnessed relatively large increases (20%-60%) in the numbers of students preparing proposals, conducting independent research, conducting statistics, and presenting their work (Table 3). Student confidence levels also generally rose with each skill (Figure 2), some statistically significant (Table 3). Significantly more students reported consulting with people about topics after taking the course (MWU, p = .036). Nearly all students reported gathering both print and Web-based information both before and after the course (MWU, p > .05). After taking the course, 22.4% fewer students stated that they begin a project 4 weeks early (Table 3). Confidence levels did not increase in proposal writing (MWU, p = .161), which may be understandable given the rigorous critique of proposals by professors during the course. However, we did find significant increases in students' confidence levels regarding performing experiments, conducting statistics, giving written and oral presentations, and coming up with original ideas (Figure 2; Table 3).
Library Resources
We found the greatest increase in the number of students reporting their use of a scientific search engine (64.2% Table 3). Less than 80% of our students used online databases or the online catalogue of an off-campus, local university library. In addition, only 49% of students requested help from a campus reference librarian (Table 4). A significant increase (19.3%) in the number of students using the campus online catalogue led to nearly 100% end usage (MWU, p = .041). Trends indicate that more students reported consulting hard copies of books and journals, in addition to online journals, after taking the course (Table 4), although changes in confidence levels of these activities did not meet the criteria for statistical significance (Figure 3). Only 16.3% of our students used interlibrary loan, and participation in the course did not dramatically increase use of this resource (only 3.5%), possibly due to the relatively short time frame of each assignment. Confidence ratings for most library skills did not significantly differ with time (Figure 3), although two approached significance (MWU, p = .062 and .066 for asking a reference librarian and using hard copies of periodicals, respectively; Table 4).
Figure 1. How students perceive their confidence in using different programs. Errors represent standard error. Confidence in program use (* denotes p < .05 from Mann-Whitney U-tests) significantly increased for all programs except the ability to scan.
Figure 2. How students perceive their confidence in performing different skills. Errors represent standard error. An * denotes a significant increase in confidence in skill performance (p < .05 from Mann-Whitney U-tests).
Figure 3. How students perceive their confidence in performing different library activities. Errors represent standard error. An * denotes a significant increase in confidence in skill performance (p < .05 from Mann-Whitney U-tests). A denotes confidence values that neared significance (i.e., a p value > .05 but < than .10).
As an assessment of usage of library resources independent of student self-reporting, we tracked database usage during the semester of the course and compared usage levels with the same months the previous year when no specific library instruction had been given to introductory biology students. Table 5 indicates a large increase in usage of the databases that were recommended for student use for this course. The large increases occurred in the first month when a worksheet specifically required database usage. Furthermore, high usage levels persisted throughout the semester, suggesting that students continued to use the databases for research in later assignments.
| Database | Month | Usage 2001 | Usage 2002 | % Increase |
|---|---|---|---|---|
| Cambridge | September | 134 | 1181 | 781 |
| Scientific | October | 514 | 1742 | 239 |
| Abstracts | November | 1081 | 2066 | 91 |
| December | 628 | 1320 | 110 | |
| BioOne | September | 0 | 135 | |
| October | 15 | 145 | 867 | |
| November | 7 | 105 | 1400 | |
| December | 19 | 146 | 668 | |
| Medline | September | 117 | 192 | 64 |
| October | 83 | 160 | 93 | |
| November | 115 | 247 | 115 | |
| December | 19 | 115 | 505 |
Figure 4. Students' confidence levels in work started 4, 2, or 1 week before the deadline. Open bars represent ratings before the course and shaded bars indicate responses following the course. Errors are 1 SE.
Figure 5. Confidence levels reported by students regarding using Web search engines. Open bars represent ratings before the course and shaded bars indicate responses following the course. Errors are 1 SE.
Figure 6. Students' confidence in using different hard copy sources. Open bars represent ratings before the course and shaded bars indicate responses following the course. Errors are 1 SE.
Comparison of Skills or Activities
Confidence in work increased with the amount of preparation time (Figure 4; two-way ANOVA, prep time, F2, 439 = 3.533, p = .03) and from the beginning to the end of the semester (time, F1, 439 = 9.427, p = .002). However, we did not find a significant interaction (prep time by time, F2, 439 = .30, p = .741). Similarly, students showed a higher confidence level in using general versus scientific search engines (Figure 5; two-way ANOVA, search engine, F1, 312 = 65.565, p = .001) and confidence in use of both search engines increased over time (time, F1, 312 = 3.987, p = .047), resulting in a nonsignificant interaction (search engine by time, F1, 312 = .256, p = .613). Although not provided as a graph, we also found a statistical difference in confidence levels between using the campus library's online catalogue versus a catalogue from an off-campus, local university library (two-way ANOVA, library, F1, 267 = 4.446, p = .036; time, F1, 267 = 4.229, p = .041). However, confidence levels in the use of information from print sources versus Web sources did not differ (two-way ANOVA, source, F1, 371 = .745, p = .389; time, F1, 371 = 3.307, p = .70). Statistics from either of these skills (library or print source) did not result in significant interactions.
In terms of print sources, students showed the highest confidence in their use of hard copy books compared with journals and periodicals (Figure 6; two-way ANOVA, source, F2, 375 = 17.174, p < .001), and this did not differ significantly with time (time, F1, 375 = 2.854, p = .092) or with a time by source interaction (time by source, F2, 375 = .588, p = .556). Confidence use did not differ significantly between hard copy journals and periodicals (Tukey's MCT, p = .967). Student confidence in giving reports significantly increased (two-way ANOVA, time, F1, 225 = 23.401, p < .001), regardless of report type (F1, 225 = .653, p = .420). Because of statistical constraints, we could not test confidence levels between using hard-bound versus online journals or reading abstracts versus full-text of journals online.
Source Evaluation
After taking the biology course, 19.5% more students thought journal articles provided the most detailed information (74.7%; Figure 7a) and rated their opinion with significantly higher confidence (Figure 7b; MWU, p< .001). Textbooks lost recognition (-22.8%) as source of the most detailed information (Figure 7a) but gained as the source of the best overview (18.5%), although not significantly (Figure 7c; p = .362). By the end of the course, students generally thought that review papers (43.3%) and journals (51.6%) equally published the results of research reviewed by scholars in the field (Figure 8a) and confidence in this opinion also increased significantly (Figure 8b; MWU, p< .001). Before the course, mixed responses occurred regarding the source that could cite the largest number of scientific studies reporting common themes. By the end (Figure 8c), students increased their confidence (Figure 8d; MWU, p < .001) in identifying review articles (60%) as the best source for citation, followed by journal articles (27.4%).
Figure 7. Change in student opinion (panels a, c, e, g) and confidence levels (b, d, f, h) regarding the accuracy and information content of four sources (review article, textbook, Web site, or journal article). See Table 1 for complete descriptions of questions. Panels a, c, e, and g report change in opinion as a percentage. Significant results are reported with p values from Mann-Whitney U-tests of confidence levels before and after the course. Error = SE.
Figure 8. Student opinion (panels a, c, e) and change in confidence levels (b, d, f) regarding the accuracy and information content of four sources (review article, textbook, Web site, or journal article). See Table 1 for complete descriptions of questions. Panels a, c, and e show pie graphs to indicate which sources students reported best fit the category during the survey conducted at the end of the course. Significant results are reported with p values from Mann-Whitney U-tests of confidence levels before and after the course. Error = SE.
Students also possessed mixed opinions regarding which source provided the most bias. However, by the end of the course, most students (Figure 8e; 73.7%, a 21.6% increase) agreed with higher confidence (Figure 8f; MWU, p = .035) that Web sites are most likely to have the greatest bias. Most students also suggested Web sites as the most likely source of inaccurate information (81% and 74%, before and after, respectively). Interestingly, in the second survey, more students (10.6%) thought journal articles could provide inaccurate information (Figure 7e), although this did not prove to be a significant increase (Figure 7f). In contrast, students increased their opinion that journal articles would be the least likely to be inaccurate (12.9%). With this increase, the likelihood that textbooks served as the sources least likely to be inaccurate declined (31%; Figure 7g). Confidence levels for the assessment of most and least likely inaccurate did not differ significantly (Fig. 7f and h).
DISCUSSION
The similarities in the steps of the scientific method and the Associated Colleges of the South's definition of information fluency are readily apparent (Associated Colleges of the South, 2002). In fact, to train students fully in the scientific method, we must necessarily train them to be information fluent. By addressing both goals in a concerted fashion, we ensure that our students know how to use the most current tools to access information, evaluate the information in ways appropriate to the discipline and the problem they wish to address, use the information to inform their scientific study, carry out and analyze their study, and ultimately add to the body of information with new results presented in a relevant forum. Thus, information fluency is requisite to proficiency with the scientific method.
The exercises developed for this course introduced students in a progressive, increasingly complex manner to the principles and practices of information fluency. They began with basic introduction to library resources and led to use of such skills and resources in the development, implementation, and presentation of an independent research project. Our survey results indicate that following the course, increases occurred, some statistically significant, in the number of students using various library-related resources, in the numbers and confidence levels of students using various technologies, and in the numbers and confidence levels of students involved in various activities related to the scientific method. We must caution that the survey method of assessment used here is limited in that it only represents student opinion of progress in the course. Anecdotal evidence of student performance reported by the teaching faculty supports the survey results; however, we did not perform an independent, systematic analysis of student improvement in this study. Nevertheless, we anticipate that with the foundation gained in this introductory course, students will build on their skill and confidence in upper-level biology courses as well as other disciplines.
Although these exercises were developed initially for an introductory course in zoology, the lessons learned can be applied to any introductory level biology course. The essential elements are that students are instructed in both the scientific method and in the proper use of library resources to support scientific research. The instruction should include series of exercises ranging progressively from simple worksheet and essay assignments that require library research and citation to independent laboratory projects leading to oral, poster, written presentation, or a combination of these. In fact, our current introductory cell biology laboratory includes three such projects, each with a different presentation format (Biology I, 2003).
CONCLUSION
In general, students reported an increase from the beginning to the end of the semester in information fluency as measured by confidence in computer technology, critical thinking skills, and library activities. However, this study still points to the need to train our students to evaluate scientific resources critically. As more and more information pours on to the Internet daily, it becomes harder and harder to distinguish “good” science from “bad.” Until guidelines are established for peer review of scientific content of Web sites, educators must design laboratory exercises that train and test students' ability to process information.
Despite increases in the students' confidence with regard to information fluency, we could still identify several areas in which students still need to increase their level of confidence: execution and analysis of experiments, use of online resources, and familiarity with interlibrary loan. Library skills overall seemed to show lower confidence ratings. In addition, student opinion varied as to the accuracy, potential bias, and content of different information sources. These results further emphasize the need for academic departments to work with library staff in hopes of increasing the information fluency of students. Collectively, our efforts as educators can have profound impact on our students' ability to navigate the world of scientific information now available to us on the Internet.
Appendix 1: Syllabus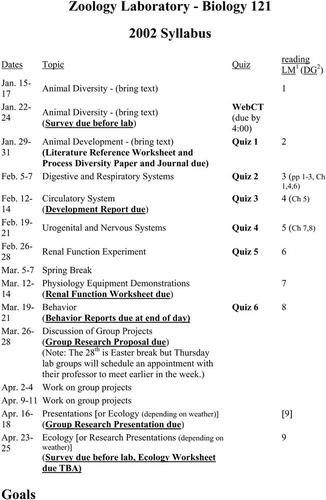
Appendix 2: Schedule of Assignments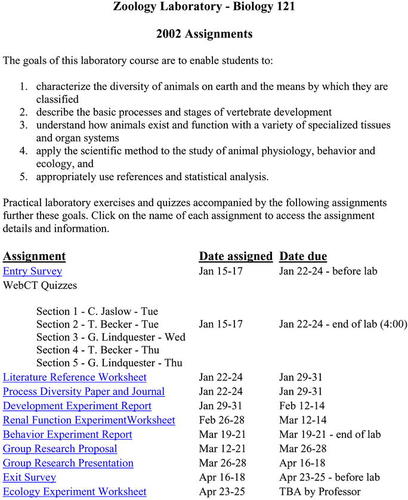
Appendix 3: Literature Reference Worksheet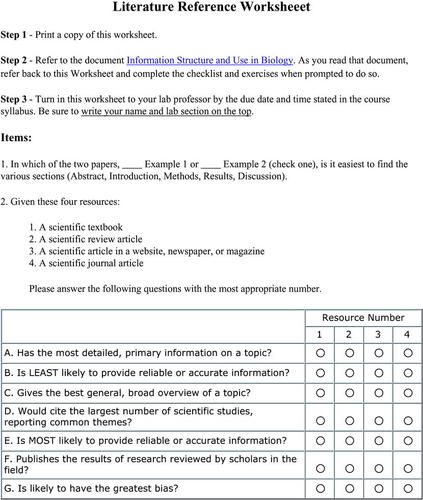
Appendix 4: Information Structure and Use
Appendix 5: Citation Guidelines
Appendix 6: Process Diversity Paper Instructions
Appendix 7: Development Experiment Report Guidelines
Appendix 8: Renal Function Experiment Worksheet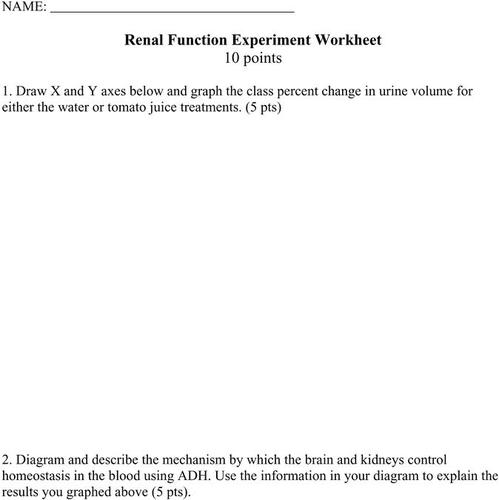
Appendix 9: Behavior Experiment Report Guidelines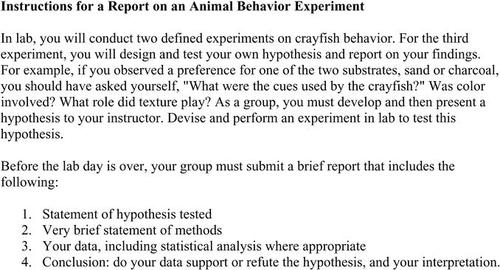
Appendix 10: Proposal Preparation Guidelines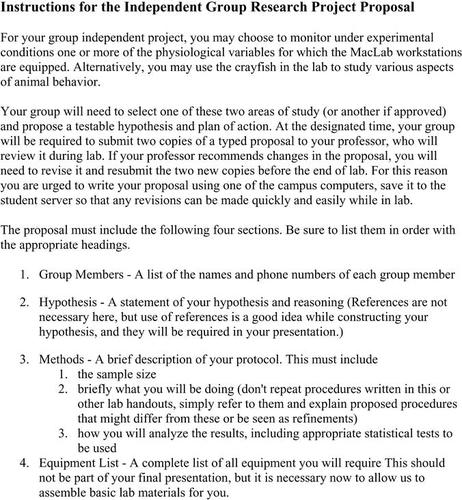
Appendix 11: Scientific Presentation Guidelines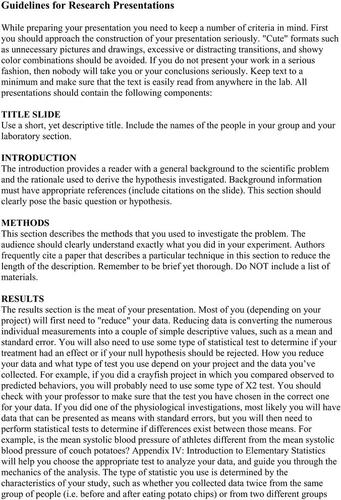
Appendix 12: Ecology Experiment Worksheet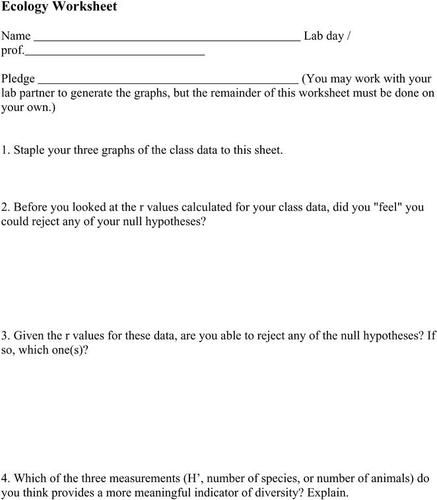
FOOTNOTES
Monitoring Editor: Erin Dolan
* Present address: Department of Biology, Southwestern University, Georgetown, TX 78626.
ACKNOWLEDGMENTS
The authors appreciate the advice and participation of the other professors in the introductory biology laboratory (Tony Becker, Jay Blundon, Alan Jaslow, David Kesler), and of Allison Gratzer (Rhodes Class of 2002), Darlene Brooks (Electronic Resources Librarian), and Robert Johnson (Dean of Information Services). A grant from the Andrew W. Mellon Foundation to the Associated Colleges of the South provided support for this work.