Increasing URM Undergraduate Student Success through Assessment-Driven Interventions: A Multiyear Study Using Freshman-Level General Biology as a Model System
Abstract
Xavier University of Louisiana leads the nation in awarding BS degrees in the biological sciences to African-American students. In this multiyear study with ∼5500 participants, data-driven interventions were adopted to improve student academic performance in a freshman-level general biology course. The three hour-long exams were common and administered concurrently to all students. New exam questions were developed using Bloom’s taxonomy, and exam results were analyzed statistically with validated assessment tools. All but the comprehensive final exam were returned to students for self-evaluation and remediation. Among other approaches, course rigor was monitored by using an identical set of 60 questions on the final exam across 10 semesters. Analysis of the identical sets of 60 final exam questions revealed that overall averages increased from 72.9% (2010) to 83.5% (2015). Regression analysis demonstrated a statistically significant correlation between high-risk students and their averages on the 60 questions. Additional analysis demonstrated statistically significant improvements for at least one letter grade from midterm to final and a 20% increase in the course pass rates over time, also for the high-risk population. These results support the hypothesis that our data-driven interventions and assessment techniques are successful in improving student retention, particularly for our academically at-risk students.
INTRODUCTION
Xavier University of Louisiana (XU) is a small, private, undergraduate-level minority-serving institution. Its strong liberal arts base is reflected in a 60–credit hour general education requirement for all students, including science majors. Currently, it ranks highly in the nation in the 1) awarding of bachelor’s degrees to African-American students in biological, biomedical, and physical sciences; 2) number of African-American graduates who complete medical school; and 3) number of graduates who go on to obtain a PhD in the life sciences (National Science Foundation, 2013; www.nsf.gov/statistics/2015/nsf15311/tables/pdf/tab7-10.pdf).
Based on this track record, it is not surprising that the majority of its students (∼70%) enter as science, technology, engineering, and mathematics (STEM) majors, with ∼33–35% in biology alone. However, the university is not immune to the challenges in higher education faced by the nation. For example, as seen in several reports (Chen and Carroll, 2005; National Science Board [NSB], 2014; Association of American Colleges and Universities [AAC&U, 2015a,b) serious inequalities exist in our postsecondary education system. The deep economic gaps that persist for Latino and African-American households restrict their access to earlier educational opportunities that would prepare them well for a college-level education (AAC&U, 2015a,b). Degrees of attainment gaps continue to exist, with only 21% of African Americans completing college compared with 51% of Asians and 35% of whites (AAC&U, 2015a,b). In addition, too many students choose to leave STEM fields during their college education. To retain the U.S. historical ranking in science and technology, the proportion of students who attain STEM undergraduate degrees would have to be increased substantially above existing rates (President’s Council of Advisors on Science and Technology [PCAST], 2012). By graduating a robust number of students in STEM, particularly biology, XU is indeed responding positively to these calls. However, it too faces the challenges of higher than desired student attrition rates, particularly during the first 2 years of college. For example, since the average retention of XU first-time freshmen after 2 years is about 61% (internal data), one of our goals is to increase retention without compromising academic standards and expectations from students.
While XU’s distinctions are being recognized (Hannah-Jones, 2015), what is perhaps not known widely is that it was founded specifically to offer opportunities to young men and women of color who would not otherwise be able to acquire a college education. Students considered “high-risk” but who otherwise exhibit the desire and will to succeed are accepted routinely. Many approaches have been used previously in science education to better understand factors that can predict student achievement in college. These include the use of incoming freshman ACT and Scholastic Aptitude Test (SAT) scores, the GALT (Group Assessment of Logical Thinking) test, placement tests, student surveys, and/or measuring a student’s development of formal thought ability (Carmichael et al., 1986; Bunce and Hutchinson, 1993; McFate and Olmsted, 1999; Benford and Newsome, 2006; Lewis and Lewis, 2007). At XU, an “academic risk model” has been developed to better elucidate the role of academic risk in freshman persistence, thereby providing a framework for intervention to improve retention rates. Based on historic retention rates of incoming XU freshmen, an internal matrix generates an academic risk grid for each incoming freshman based on his or her high school grade point average (GPA) and composite ACT score. Information specific to each freshman places him or her in one of the cells, labeled as high, medium, or low academic risk, as determined by the intersection of the measures of the matrix. This methodology has proven to be robust over time and across risk groups in predicting retention and graduation rates (XU Office of Planning, Institutional Research, & Assessment). Because XU freshmen begin college with a declared major, unlike at many institutions, the biology department is faced with the challenge of having a number of students who are not ready to withstand the rigors of its program. In fact, even with excellent institution-wide support systems (Xavier University of Louisiana, 2014) for academic and nonacademic issues (time and stress management, developing study skills, etc.), high-risk students tend to have difficulty in their first introductory biology course. Of course, this does not help their self-esteem or persistence in our program. To address such significant differences in academic preparedness of our freshman students, introductory science courses at XU are coordinated with common syllabi and tests (as discussed in Methods).
The current study focuses on freshman/introductory-level General Biology (Biol 1230), a gateway course that is a prerequisite for all other biology courses. With the recent start in 2012 of the Howard Hughes Medical Institute (HHMI)-funded Project Scicomp, which is centered on competency-based education as outlined in the Vision and Change report (American Association for the Advancement of Science [AAAS; 2009] and the Scientific Foundations for Future Physicians (SFFP) report (American Association of Medical Schools and Colleges and Howard Hughes Medical Institute [AAMC/HHMI], 2009), this course also serves as a model system for curricular reforms within our department. The goal of this study was to evaluate the impact of targeted approaches involving assessment techniques and evidence-based interventions on classroom learning and academic performance of high-, medium-, and low-risk students in Biol 1230 over a 5-year period (Fall 2010–Spring 2015).
METHODS
Curriculum, Course Design, and the Role of the Course Coordinator
Nearly all of the 750-plus majors in the department of biology are either on a biology (BS) or a biology-premed track. Functionally identical, they require a total of 38 h in biology, including 15 h of biology electives. At the center of XU biology’s success is its curriculum, in which all majors take a sequenced series of required courses (Foundations in Biology I and II, General Biology 1230 and 1240 Lecture and Lab, Biodiversity Lecture and Lab, Microbiology Lecture and Lab, and Genetics Lecture and Lab). Three of these, General Biology 1230 (referred to from now on as Biol 1230), General Biology 1240 (referred to from now on as Biol 1240), and Biodiversity (Biol 2000), address introductory topics typically found in a two-semester introduction to biology course for science majors. Students must complete each of the required courses with a grade of “C” or better to progress to the next course in the curriculum. Following the required biology courses, students take elective courses that align with their interests.
Beginning in 2012, to introduce and foster scientific competencies early, two freshman-level courses, Foundations in Biology I and II (Biol 1210L and 1220L), were added to the curriculum as part of the HHMI-funded Project Scicomp. These courses focus on reading primary scientific literature, interpreting data, and developing basic skills in biophysics, biochemistry, biomathematics, and scientific experimental design. It is important to note that, as of Fall 2012, all biology majors enroll simultaneously in Biol 1230, Biol 1230L, and Biol 1210L. All three are stand-alone courses and serve as excellent platforms for active learning, a key component of transforming undergraduate biology education (National Research Council, 2003; AAAS, 2009). Biol 1230, the focus of this study, is a required course for all life sciences majors and also a prerequisite for all other biology courses. This means that, unless students earn at least 70% (a grade of “C” or better), the computer system prevents them from enrolling in the next biology class. It is a 3–credit hour lecture course with an annual enrollment of 550–575 students/year. A “gateway” course in terms of being a key prerequisite, it is not a typical “sink or swim” gateway course. The course content reflects fundamentals of competency E4 (demonstrate knowledge of basic principles of chemistry and some of their applications to the understanding of living systems), as outlined in the SFFP report (AAMC/HHMI, 2009), and various components and recommendations outlined in the Vision and Change report (AAAS, 2009). Because Biol 1230 is taken in their first semester by students coming in with widely varying levels of college preparedness, the course is highly coordinated. This means that that all instructors share a common syllabus and agree not only on content (through specified modules and learning goals) but also on the depth of explanation. This sets the stage for all students to receive the same essential content, at similar depth, regardless of instructor. Such teaching approaches, along with an “in-house” workbook (which lists learning goals and provides practice areas for each) and various forms of academic support for all students, helps reduce academic disparity. It also allows for administration of common 1-h exams (graded and returned) and a common final exam (not returned). In addition, the in-class quizzes (eight to 10) are spread throughout the semester for frequent formative assessment and reinforcement of content topics. Figure 1 offers an overview of the curriculum, instruction, and assessment model and portrays the support systems that were in place (free of cost to students) before 2010. Table 1 portrays the grading structure and interventions for Biol 1230.
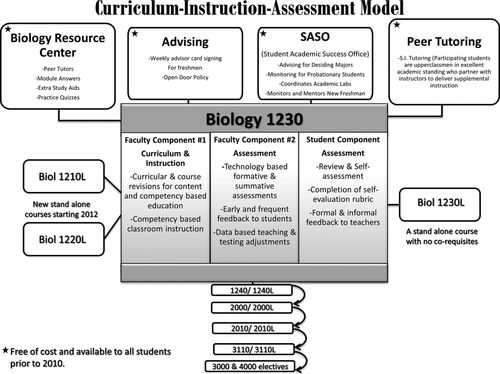
Figure 1. Curriculum–instruction–assessment model. Faculty and student components were central to this project involving Biol 1230. In addition, the institution-wide support systems (indicated by asterisks) also played an integral role in the “holistic” learning of our students. These included the Biology Resource Center, departmental advising, peer tutoring, and the Student Academic Success Office. Finally, it is important to note that Biol 1230 students were also enrolled concurrently in two other courses of the curriculum, Biol 1230L (General Biology lab) and Biol 1210L (Foundations I, the newly developed competency course).
| Assessment tool | Points available | Resources and interventions |
|---|---|---|
| 1-h exams 1, 2, and 3 (graded and returned)a | 300 points (100 points each) | Advising and individual tutoring/SASO/workshops/review sessions/LXR test data/class discussions/self-analysis rubric/individual mastery reports |
| 8–10 quizzes (graded and returned) | 100 points | Clicker software generating immediate feedback |
| Online homework (graded) | 50 points | |
| Final exam (graded but not returned)b | 100 points | Review of homework and earlier quizzes |
| Total | 550 points |
The course coordinator, who is also a member of the teaching team, is responsible for ensuring that instructors have access to common course materials, which are updated from time to time with input from all instructors. Instructors meet weekly to discuss relevant issues, concerns, or observations. They are responsible for preparing all quizzes for their section(s). All common exams are constructed by the coordinator with feedback from instructors before being administered. In addition, the coordinator collects and processes all exam and final exam Scantrons and returns individual score reports and exam-item statistics to instructors as PDF files. Subscores on the “back page” (non–multiple choice questions) are recorded by each instructor and sent to the course coordinator for compilation. After all results are discussed by the instructors, observations and suggestions are incorporated by the coordinator in subsequent modifications of exam questions and course content.
Participants
The total student enrollment in Biol 1230 ranged between 550 and 575/year with declared majors mainly in biology, chemistry, or psychology. Approximately 85% of the students were African American, ∼10% were Asian American, and ∼5% identified as “other,” with females making up ∼65–70% of each class. Figure 2 shows student distribution over the 5-year period based on risk categories.
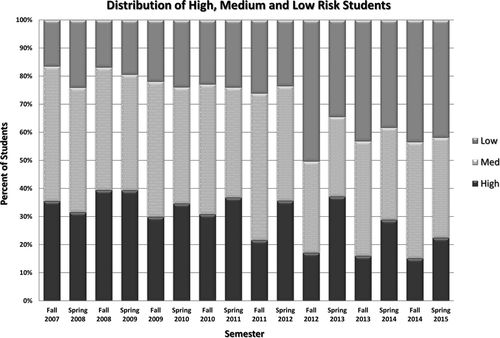
Figure 2. Distribution of high-, medium-, and low-risk students. Students were classified as academically high, medium, or low risk based on the criteria identified in the XU academic risk model. These criteria included high school GPA and ACT/SAT scores (please see the text for additional details).
Strategies and Interventions Introduced to Improve Student Learning (2007–2015)
Hurricane Katrina (August 2005) nearly destroyed the entire campus and much of the city, but under the strong leadership of President Francis, the university reopened within a few months of the devastation. This study began in Fall of 2007 as part of a slow and painful recovery process. Understandably, our student recruitment and retention efforts became even more of a major focus than usual. Other issues included how well our students were doing with respect to successfully competing for and securing admission to graduate programs or professional programs or participating meaningfully in the workforce. Finally, we wanted to know what our recent graduates and current students had to say about their personal “Xavier experiences.” Thus, on the basis of the available data on our student placement in graduate or professional programs, graduation trends, student feedback, and input from faculty, we came to the conclusion that our curriculum was in dire need of modernization. In Biol 1230 specifically, as we assessed our strengths and weaknesses, we came to the conclusion that there existed very little (or any) active learning, little systematic formative assessment, and no use of technology in the classroom. We agreed to keep what worked but to undertake changes, particularly in the way we taught, tested, and evaluated student learning. Thus, beginning in Fall 2007, specific steps were taken to improve the course and increase student performance. Each implemented change was based on available evidence. The proposed and implemented interventions in Biol 1230 over time are summarized in Table 2. As an example, Biol 1230 always contained a significant amount of chemistry (e.g., atomic and molecular structures, chemical bonds and properties, thermodynamics, and metabolic pathways). However, we needed to increase the emphasis on biological relationships to cross-disciplinary topics in chemistry and physics. So Biol 1230 became an excellent model for aligning its content with competency E4 of the SFFP report: “demonstrate knowledge of basic principles of chemistry and some of their applications to the understanding of living systems” (AAMC/HHMI, 2009). As another example, after multisemester analysis of data from Biol 1230 lecture and Biol 1230L, student completion of both Developmental Reading and Developmental Math before enrollment in Biol 1230 became a requirement in Fall 2010 for those students identified as needing remediation, regardless of their majors. This was because, on average, more than 50% of students enrolled in Developmental Math and/or Reading were receiving grades of “D” or “F” at midterm in Biol 1230. Another data-driven intervention involved the planning of review sessions, which were based on clicker-derived assessment data that revealed the topics and types of questions which needed additional reinforcement and practice. As a final example, for many years, assessment in the Biol 1230 course consisted mainly of very basic “item analysis” reports generated by the Scantron reader. These reports offered some useful, though limited, data on individual section averages and identified those questions that were particularly challenging for students, based on the question’s “percent correct” values. One of our objectives was to explore and adopt more modern testing tools that would allow more advanced types of student performance data analysis, in particular, formative assessments. From published literature, we knew that clicker usage for immediate feedback was becoming a popular approach for various reasons. So, in 2007–2009, we researched newer assessment tools, such as introducing the use of clickers, in Biol 1230. As reflected in these examples, our guiding principles for proposing and implementing interventions were based on identifying and understanding student needs. While quantitative assessment data on student performance was a major factor, input from student evaluations, advisors’ observations, and the collective wisdom of the course instructors in the form of their weekly meeting discussions were equally important in developing and piloting each intervention and deciding which to continue going forward.
 |
Grading and Maintenance of Rigor
As shown in Table 1, students took eight to 10 quizzes that were created and administered by individual instructors. To maintain adequate difficulty levels, instructors reviewed one another’s questions and offered input. For the three 1-h exams, a separate test bank of ∼750 original questions was developed over the 5-year period by the course coordinator. These questions spanned the entire spectrum of course content and were categorized using the six cognitive domain levels of Bloom’s taxonomy (Bloom et al., 1956): knowledge, comprehension, application, analysis, synthesis, and evaluation. The LXRTest software program generated usage statistics on each question and set of answers, along with point biserial correlation (rpb) values (see below), for evaluation of question quality. About 15% of the 300 exam points were assigned to non–multiple choice questions in the form of a back page. This allowed testing and assessment of more advanced analysis through word problems and/or short-answer types of questions. Finally, since the comprehensive final exam was not returned to students, 60 out of the 100 questions covering all topics were kept unchanged on all final exams over the 5 years. It is important to note that these 60 questions were not brand-new but were selected from existing final exam test bank questions that had been used on final exams before Fall 2010. To evaluate individual question quality, we examined rpb values on these 60 persistent questions, since they are statistical measures of overall student performance on multiple-choice questions. A student’s score on a particular question is correlated with his or her overall average on the exam and reported as a single value between –1.0 and +1.0 for each answer choice. In general, an rpb value greater than +0.3 associated with the correct answer indicates that a particular question is a good discriminator of student mastery and should be retained. Because all 60 questions had rpb values greater than +0.3, we used all of the questions in our analysis.
Formative Assessment, Validation, Data Mining, and Student Participation
Two main technology-based assessment techniques were adopted as follows: 1) Clickers (Hyper-Interactive Teaching Technology) and associated software were used to administer quizzes and generate histograms of student responses, which were projected in class for immediate feedback. Students were able to see where they stood compared with their classmates and participated in discussions that included clearing up misconceptions and analyzing question formats. 2) LXRTest software was used (in combination with a Scantron OpScan6 optical mark reader) to collect and analyze student exam responses in order to generate detailed statistical reports for instructors and individual score and mastery reports for students.
Since the Fall of 2010, students in Biology 1230 have received individual score reports for each of their three hour-long exams. Each score report is essentially an answer key (with the student’s incorrect answer listed to the right of the correct choice) for the multiple-choice questions. Students were strongly encouraged to use each report in conjunction with an exam self-evaluation grid (Figure 3) to reveal deficit clusters or trends in their study habits and test-taking skills. By identifying the major factor(s) contributing to their exam performances, students were empowered to develop specific approaches to enhance their future exam preparations and efforts. Note that students were not required to construct self-evaluation grids, because, based on our experience, unless their effort is voluntary, there is no way to ensure their results would actually be used properly. Even with regard to online homework B quizzes, which are mandatory and contribute to the final course grade, some students remained noncompliant and lost points. Self-improvement is a consequence of self-discipline, responsibility, and motivation. Therefore, opportunities for self-review and reflection were offered and extolled as a means to increase self-awareness, but not mandated.
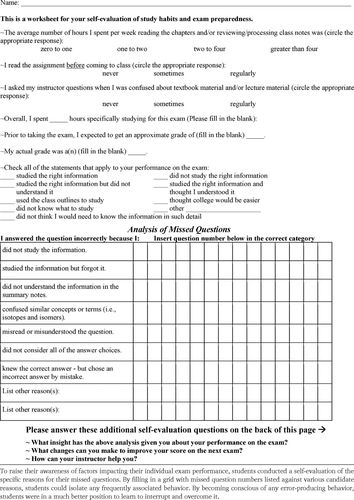
Figure 3. Self-evaluation rubric for remediation.
Beginning in Fall 2012, an LXRTest question bank (containing newly developed, original questions, not from the textbook or the Internet) was implemented, which permitted labeling of each question in up to eight categories. Six categories were chosen, as follows: module and learning goal, content topic, question format, degree of difficulty, Bloom’s taxonomy, and topic group. Degree of difficulty and Bloom’s taxonomy levels were assigned and subsequently validated by overall scores and by high-, medium-, and low-performing students’ scores on each question. Individual student mastery reports (Figure 4) imparted additional information to students, which was helpful to them in identifying target areas for remediation. This type of student mastery report allowed students to literally “see” and prioritize more general topic concepts (e.g., topic group, category 7) that need their attention. The individual score report, in contrast, identified the specific questions that were missed on the exam, if any. Both types of reports thus served as valuable resources for remediation of course content, particularly when used in partnership with their instructors, peer-tutors, or academic advisors.
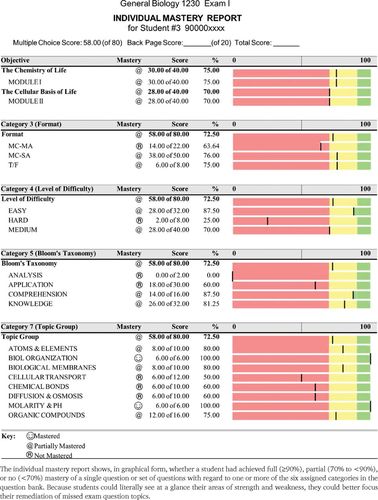
Figure 4. Individual mastery report.
RESULTS
Rigor Was Maintained through the Years
Given the nature and significance of Biol 1230, it was crucial to maintain rigor in the course in every area. As outlined in the Methods, a variety of approaches helped accomplish this goal. These included course design (Figure 1 and Table 1), use of Bloom’s taxonomy and software-generated data (Figure 4), and examination of the rpb values for the common 60 final exam questions that were used as an internal control. The difficulty level of the quizzes (which were not common to all sections) was maintained by instructors reviewing one another’s questions. These measures, combined with a strict policy of not curving and not rounding up, set the stage for comparing averages on these questions over time.
Strategic Interventions Merged over Time
A number of strategies, as outlined in Table 2, were introduced over time, based on 1) observations of teachers, 2) formal and informal input from students, 3) input from academic advisors and notifications from institution-wide systems like the “Early Alert” from the Student Academic Success Office (SASO), 4) data obtained from quiz and test analyses, and 5) analysis of student self-evaluation reports. While some steps taken were specific and “one-time” activities, others were continued once introduced. As seen in Table 2, they merged at the start of the competency-based Scicomp project during the academic year 2012–2013.
Formative Assessment, Data Mining, and Student Participation Allowed “Closing the Loop”
As detailed in the Methods section, significant amounts of time and effort were invested in researching, piloting, and validating assessment tools (LXRTest and H-ITT clickers) that would allow both instructors and students to engage in active teaching/learning and form a meaningful partnership that would enhance both the quality of the course and student performance. This innovative approach and major change was new to the department and allowed for more advanced levels of formative assessment and teaching/testing adjustments during the semester, while the course was in session. Sharing data with students and encouraging them to self-review using the carefully designed rubric (Figure 3) made them much more active participants in the learning process. Furthermore, their input (written and verbal), in conjunction with detailed item statistics reports for instructors (unpublished data) allowed instructors to conduct higher-order data mining to pinpoint with high precision areas of difficulty, misconceptions, and confusion, not only in the “question-types” but in course content with regard to specific learning goals. In turn, this permitted students to “close the loop” through identification of their particular strengths and weaknesses as early as possible, and at the same time, teachers were able to implement targeted approaches to address student needs while the course was still in session (and before it was too late to really help students).
High-Risk Students Showed Statistically Significant Academic Gains over Time
A statistically significant correlation was observed between the interventions introduced over time and improvement in the academic performance of high-risk students. Not only did this group show a steady increase on the percent-correct scores on the 60 common questions (∼63% in 2010 to ∼71% in 2015, Figure 5), they also showed a significant 20-point jump in the percent passing the course (∼39% passing in 2007 to ∼59% in 2015, Figure 6). While the 60 questions were associated only with the final exam, the end of the course final letter grade was based on all quizzes, the three exams, online homework, and the comprehensive final. Results shown in Figure 6 showed that overall performance of high-risk students improved over time. In addition, a z-test analysis was conducted to compare midterm with final grade improvements. The rationale for the z-test was as follows: as shown in Table 1, by the time students received their midterm grades, only ∼25% of the total possible points for the course had been allocated. Thus, the midterm grades served as an early enough alert (point-wise) for students to avail themselves of the resources and interventions offered. In other words, students who may not have taken advantage of the academic support resources, upon seeing their midterm grades, were motivated to work harder and participate more fully. We would therefore expect a greater degree of improvement for participating students between the midterm and the end of the semester grade. The z-test determines whether the proportion of one letter grade improvement in the “before” group is statistically significantly different from the proportion of one letter grade improvement in the “after” group. The before group was before 2010 and the after group was after 2010, because it was in 2010 that the complete set of 60 common questions was finalized and adopted for inclusion in all final exams as an internal control. These results offered additional strong evidence of the academic gains for the high-risk groups (Table 3). As an example, in the case of “All semesters,” there were 750 high-risk students before Fall 2010, 145 of whom improved by one letter grade from midterm to final, or 19.3% of the students. In the after 2010 group, 190 of 741 high-risk students improved by one letter grade, or 25.6%. The z values and associated p values showed that the after 2010 group exhibited statistically significant improvement only for a one letter grade improvement (where z ≥ 1.96 and p ≤ 0.05). However, when the same type of analysis was done using only Spring semesters, there was a statistically significant improvement between the before and after groups for both one- and two-letter grade improvements.
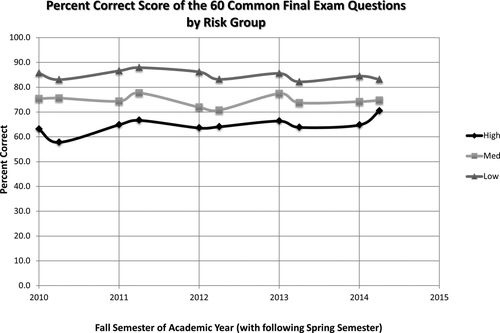
Figure 5. Percent correct score of the 60 common final exam questions by risk group. A set of 60 questions was repeated in every Biol 1230 final exam over the course of 10 semesters starting in Fall 2010. They were not newly constructed questions but were selected from a separately stored, larger final exam test bank in use before 2010. Spanning all modules, these 60 questions were never used in any of the 1-h semester exams. Combined, these factors allowed us to consider these 60 questions as an internal control to ensure the rigor of the comprehensive final exams. This graph shows the performance of the high-, medium-, and low-risk students on the same 60 questions over the academic years 2010–2015, when a number of assessment-based approaches were introduced to help students learn and perform better.
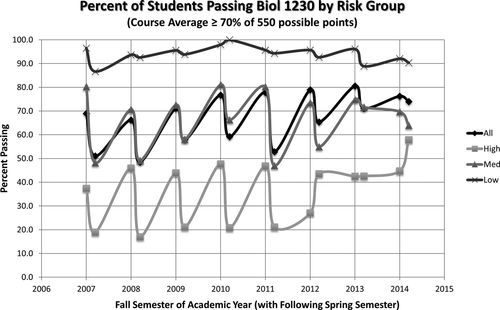
Figure 6. Percent of students passing Biol 1230 by risk group. The data represent the percentages of students passing Biol 1230 with a grade of “C” or better according to their risk group category over the academic years 2007–2015. As stated in the text, there is zero curving and no rounding up of the points in this course; a student must achieve a minimum grade of 70% by the end of the semester to receive a passing grade of “C.”
| Comparison of letter grade improvement from midterm to final for high-risk students before and after Fall 2010 semester | ||||||||||||
|---|---|---|---|---|---|---|---|---|---|---|---|---|
| Before Fall 2010 | After Fall 2010 | z-Test of two independent proportions | ||||||||||
| One letter-grade improvement | Two letter-grade improvement | One letter-grade improvement | Two letter-grade improvement | One letter grade | Two letter grades | |||||||
| z Value | p Value | z Value | p Value | |||||||||
| All semesters high-risk students only | 145/750 | 19.3% | 11/750 | 1.5% | 190/741 | 25.6% | 23/741 | 3.1% | 2.78 | 0.0053 | 1.82 | 0.068 |
| Spring semesters high-risk students only | 51/297 | 17.2% | 2/297 | 0.7% | 84/347 | 24.2% | 13/347 | 3.7% | 2.077 | 0.0377 | 2.047 | 0.0406 |
Four Variables Were Statistically Significant in the Regression Analysis
As shown in Table 4, when regression analysis was performed on the 60 final exam common question averages (our internal rigor control), four variables exhibited t stat and p values in the statistically significant range. These were Spring semester, year, low risk, and high risk.
| R2 = 0.250 | ||||
|---|---|---|---|---|
| n = 2778 | Coefficients | SE | t Stat | p Value |
| Intercept | 57.892 | 2.267 | 25.532 | 0.000 |
| Spring semester | −1.310 | 0.582 | −2.252* | 0.024* |
| Year | 1.589 | 0.191 | 8.334* | 0.000* |
| High-risk | −10.334 | 0.921 | −11.217* | 0.000* |
| Medium-risk | −0.159 | 0.876 | −0.182 | 0.856 |
| Low-risk | 9.459 | 0.880 | 10.753* | 0.000* |
DISCUSSION
Even as “calls for action” are being made nationwide (PCAST, 2012), students of color are projected to be the majority college-going population in the not so distant future (AAC&U, 2015a,b). It is therefore more important than ever for educators and policy makers alike to address the issues of equity and diversity in higher education. Because the numbers of students choosing and remaining in STEM majors are declining, while overall STEM graduation rates remain steady at ∼15% (NSB, 2014), working on improving STEM retention numbers can be viewed as one approach to alleviate this national challenge. However, recruitment and retention of students in STEM are complex, interrelated issues. Many factors influence students’ choice of major, why they leave STEM, and/or why they drop out of college and do not graduate. These include racial, socioeconomic, and cultural influences; weak academic preparation; feelings of isolation and uncertainty; lack of confidence/motivation; inadequate time management and study skills; family expectations; having to hold down a job while in school; and more (Seymour and Hewitt, 1997; Boundaoui, 2011; PCAST, 2012; Gibbs and Griffin, 2013; NSB, 2014; AAC&U, 2015a,b; Figueroa, 2015; Witham et al., 2015). In response, an impressive body of literature has accumulated on the various approaches and interventions that have been shown to improve student learning, confidence, self-esteem, academic performance, and persistence through STEM. These include active teaching and student feedback through focus groups, surveys and interviews, increased course structure, replacement of traditional introductory labs with research projects, course-based research experiences, development and implementation of effective assessment techniques, student advising/mentoring, formation of learning communities, increased availability of financial support, and peer tutoring (Allen and Tanner, 2005; Jacobs-Sera et al., 2009; Austin, 2011; Goldey et al., 2012; Singer et al., 2012; Depass and Chubin, 2014; Freeman et al., 2014; Williams et al., 2011).
So what is unique about our study? To the best of our knowledge, this is the first report of its kind on the impact of data-driven systematic interventions introduced over a multiyear period on student learning and academic performance. Based on a coordinated course with a common syllabus and tests, our study had several built-in controls and “checks and balances” to ensure maintenance of rigor. More than 5000 underrepresented minority (URM) students participated, categorized into three academic groups: high-risk, medium-risk and low-risk. Having well-established support systems both within and outside the department to address academic and nonacademic needs (various freely accessible resource centers, peer tutoring, review sessions, career counseling, etc.) helped minimize the influence of these factors and allowed us to focus specifically on academic areas. Our working hypothesis was that evidence-based interventions will increase academic performance and retention in the course for all students, particularly the high-risk group. Our results showed a very clear and significant pattern correlating interventions added over time (Table 2) with the academic performance of our high-risk students (Figures 5 and 6, Table 3) but not low- or medium-risk students. In fact, the high-risk group showed a 20% increase in their overall passing rates between 2007 (start of interventions) and 2015 (Figure 6). Furthermore, these students also demonstrated a steady 8% increase on the persistent 60 final exam questions over time (2010–2015, Figure 5). In contrast, the performance of the medium- and low-risk students on the 60 common final exam questions remained unchanged over the same time period (Figure 5).
The significance of the year variable obtained by regression analysis for the high-risk students (Table 4) is manifested in the increasing effectiveness of the interventions over time (over years) as measured by this group’s performance, both on the final exams (the 60 persistent questions) and overall passing rates for the course, as described earlier. Interestingly, our results also showed a clear and significant “Spring” effect (Figure 6 and Table 4), in that every Spring, until recently (2013 onward), the percentages of students passing Biol 1230 were consistently lower (by an average of 20%) for both the high-risk and medium-risk populations. We believe that this is in part because the Spring semesters are considered “off sequence.” Enrollments are lower in Spring than in Fall and include students repeating the course along with those who had completed any developmental requirements and were only now allowed to enroll in the course. We hypothesize that this group of students starts on a strong enough footing, but if they do not do well within the first month or so, they become discouraged and give up. However, this alone may not explain the Spring effect, and ongoing studies will focus on this question. In any case, plateauing of the Spring effect, starting in 2013, suggests that our interventions were working in both the high- and medium-risk populations. Finally, but importantly, the regression analysis in Table 4 revealed that both high-risk and low-risk student average scores on the 60 common final exam questions differed significantly from the combined average scores over time. This is essentially an independent validation of the XU student risk assessment model, in which incoming freshmen are classified as high-, medium-, or low-risk students to predict their chance of success in XU’s program. On the basis of this model, high-risk students would be expected to not do as well as medium- or low-risk students. Our findings thus strongly support XU’s model, in that, when students in Biol 1230 are sorted (based strictly on their academic performance), they form patterns that mirror their preassigned risk-category classifications.
Based on the discussion so far, the following two logical questions can be posed: 1) Which intervention(s) is/are causing the academic gain effect for the high-risk students? 2) Why are the adopted interventions showing little/no impact on the low- and medium-risk groups? Because several of our interventions overlap on our timeline, it is not possible to single out any particular one. However, we propose that the following had the greatest influence: 1) adding Developmental Reading and Developmental Math completion as prerequisites for Biol 1230; 2) aligning course modules and testing materials with scientific competencies, in particular E4 of the SFFP report; 3) conducting advanced-level formative and summative assessments; and 4) making students active stakeholders by articulating expectations clearly and encouraging self-review and remediation activities.
Since 2012–2013, based on student and advisor input, another factor that could be having a positive influence on Biol 1230 performance is the Foundations I (Biol 1210L) experience. Through Biol 1210L, students are exposed to the fundamentals of the scientific competencies E1 (quantitative reasoning), E2 (scientific inquiry), and E3 (physics in biology) as outlined in the SFFP report (AAMC/HHMI, 2009). They learn integrative, interdisciplinary concepts that can be quite challenging for freshmen through inquiry-based activities, math problem solving, and open-ended experiments (unpublished data). The goal is for students to learn how to think, stay focused, pay attention to detail, and not be passive listeners—skills that can help them in all the courses in which they are enrolled (not just Biol 1230 and Biol 1230L). As for the medium- and low-risk students not responding significantly over time to our interventions, a possible answer lies in the fact that our model requires compliance/commitment from students. We deliberately have not made any self-reviews, workbook exercises, tutoring sessions, or other remedial opportunities mandatory. However, we articulate clearly and often what our expectations are of them and the benefits of taking more personal responsibility. Based on our 8-year data analysis, course passing rates for low-risk students range between 90 and 95%. It is therefore understandable that they do not feel the need to seek any remediation, as their class averages tend to already be in the “A” grade range. With regard to the much more heterogeneous medium-risk category, many more (unknown to us) factors probably influence their willingness to become “active partners.” Based on limited, anecdotal information from students, many feel that they are “doing quite well” or “will do fine,” as they tend to be in the high “C” or sometimes “B” range and feel no need to strive harder. Others decide to devote more time to some other course that they perceive to be more difficult. Regardless of the reason for underutilization of the available resources by the medium-risk students, we will also be focusing on this group as we continue this project.
Broader Impact of This Study
Several well-respected and successful initiatives like the Meyerhoff Scholars Program and the Posse Scholars Program have been developed specifically to increase diversity and numbers in science (Maton et al., 2012; Posse Foundation, 2015). In addition, several recent models, including the persistence model (Graham et al., 2013) and the whole student model (Freeman et al., 2011; Eddy and Hogan, 2014; Gross et al., 2015) offer theoretical frameworks for increasing STEM participation and success of URMs. Yet another recent initiative (AAC&U, 2015a,b) focuses on clear articulation of expectations by the faculty to students and increasing communication with them for increased transparency. Based on these and other reports, it is evident that a holistic approach is helpful in educating students.
Our results offer clear evidence that data-driven interventions can improve student learning, particularly with a true buy-in on the student’s part. Throughout the duration of this study, a consistent participation (∼35%) in the interventions by the high-risk students was observed. Also, it may be noted that the rate of withdrawal from Biol 1230 also remained remarkable constant through the years, at ∼10% (1–2% for low-risk, ∼8% for medium-risk, and ∼16% for high-risk students). Despite their higher withdrawal rates, however, the high-risk students who chose to remain in the course showed the highest motivation for self-improvement and, per our intervention model, benefited the most (Figures 5 and 6 and Table 3). However, it has not escaped our notice that we still lose ∼40% of our high-risk population (Figure 5). Equally important, even after silencing (or near-silencing) the influence of factors such as race, feelings of not belonging, and so on (our students are URMs at a historically black college), a clear, multiyear pattern of high-risk students consistently performing at a noticeably lower level than medium- and low-risk students was seen. Thus, while achievement gaps between high- and low-risk students certainly decrease over time, as interventions take effect, the high-risk students still continue to lag behind. Combined, these observations point toward the amount, type, and level of academic underpreparedness (knowledge gaps) as strong determinants of academic gains, further demonstrating the importance of higher-order assessments and evaluations as integral components of every course.
Closing Thoughts
Many of the interventions used in our study were not brand-new, but we did spend a significant amount of time getting to know our students and understand their needs. Our careful planning against the backdrop of stringent controls provided strong evidence for these assessment-driven interventions becoming more effective over time and resulting in significant academic gains for our high-risk population. We believe that these approaches have the potential to be applied to other STEM courses at XU and beyond, particularly if the course participants happen to be at different levels of college preparedness. However, for our model to work, faculty buy-in, beyond simply agreeing with the plan, will be essential, as instructors have to retool and grow themselves in order to think, teach, test, and assess differently. Also, for our model to work, students must be willing to take personal responsibility and work hard throughout the semester. Change is never easy, but with the right combination, it can work like magic! If students do better, they are happier. Their self-esteem goes up, starting a chain of positive feedback that directly impacts their retention and persistence in science.
ACKNOWLEDGMENTS
This work was supported by LEQSF-ENH-PKSFI-PES-07 (principal investigator: S.K.I.) and HHMI grant 52007572 (Program Director: S.K.I.). We thank Dr. Ron Durnford (vice-president, Institutional Research) and Ms. Melva Williams (director, Internal Operations, Office of Technology Administration) for providing multiyear student data. We dedicate this first post-Katrina science education article from the biology department to Dr. Norman C. Francis, president emeritus. We remain grateful for his visionary leadership during his 47 years as the university president, particularly after Hurricane Katrina.


