Interactions Are Critical
To the Editor:
Recently, Theobald and Freeman (2014) reviewed approaches for measuring student learning gains in science, technology, engineering, and mathematics (STEM) education research. In their article, they highlighted the shortcomings of approaches such as raw change scores, normalized gain scores, normalized change scores, and effect sizes when students are not randomly assigned to classes based on the different pedagogies that are being compared. As an alternative, they propose using linear regression models in which characteristics of students, such as pretest scores, are included as independent variables in addition to treatments. Linear models that include both continuous and categorical independent variables are often termed analysis of covariance (ANCOVA) models. The approach of using ANCOVA to control for differences in students among treatments groups has been suggested previously by Weber (2009). We largely agree with Theobald and Freeman (2014) and Weber (2009) that ANCOVA models are an appropriate method for situations in which students cannot be randomly assigned to treatments and controls. However, in describing how to implement linear regression models to examine student learning gains, Theobald and Freeman (2014) ignore a fundamental assumption of ANCOVA.
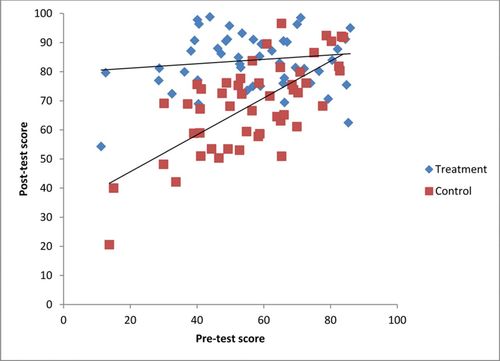
ANCOVA assumes homogeneity of slopes (McDonald, 2009; Sokal and Rohlf, 2011). In other words, the slope of the relationship between the covariate (e.g., pretest score) and the dependent variable (e.g., posttest score) is the same for the treatment group and the control. This assumption is a strict assumption of ANCOVA in that violations of this assumption can result in incorrect conclusions (Engqvist, 2005). For example, in Figure 1, both pretest score and treatment have statistically significant main effects in a linear model with only pretest score (F(1, 97) = 25.6, p < 0.001) and treatment (F(1, 97) = 42.6, p < 0.01) as independent variables. Therefore, we would conclude that all students in the class with pedagogical innovation had significantly greater posttest scores than those students in the control class for a given pretest score. Furthermore, we would conclude that the pedagogical innovation led to the same increase in score for all students in the treatment class, independent of their pretest scores. Clearly, neither of these conclusions would be justified.
Figure 1. Simulated data to demonstrate heterogeneity of slopes. Pretest values were generated from random normal distributions with mean = 59.8 (SD = 18.1) for the treatment course and mean = 59.3 (SD = 17.0) for the control course, based on values given in Theobald and Freeman (2014). For the treatment course, posttest values were calculated using the formula posttesti = 80 + 0.1 × pre-testi + Ɛi, where Ɛi was selected from a random normal distribution with mean = 0 (SD = 10). For the control course, posttest values were calculated using the formula posttesti = 42 + 0.5 × pre-testi + Ɛi, where Ɛi was selected from a random normal distribution with mean = 0 (SD = 10). n = 50 for both courses.
Researchers must first test the assumption of the homogeneity of slopes by including an interaction term (covariate × treatment) in their linear model (McDonald, 2009; Weber 2009; Sokal and Rohlf, 2011). For example, if we measured student achievement in two courses with different instructional approaches in a typical pretest/posttest design, then the interaction between students’ pretest scores and the type of instruction must be considered, because the instruction may have a different effect for high- versus low-achieving students. If multiple covariates are included in the linear model (see Equation 1 in Theobald and Freeman, 2014), then interaction terms need to be included for each of the covariates in the model. If the interaction term is statistically significant, this suggests that the relationship between the covariate and the dependent variable is different for each treatment group (F(1, 96) = 25.1, p < 0.001; Figure 1). As a result, the effect of the treatment will depend on the value of the covariate, and universal statements about the effect of the treatment are not appropriate (Engqvist, 2005). If the interaction term is not statistically significant, it should be removed from the model and the analysis rerun without the interaction term. Failure to remove an interaction term that was not statistically significant also can lead to an incorrect conclusion (Engqvist, 2005). Whether there are statistically significant interactions between the “treatment” and the covariates in the data set used by Theobald and Freeman (2014) is unclear.
In addition to being a strict assumption of ANCOVA, testing for homogeneity of slopes in a linear model is important in STEM education research, as slopes are likely heterogeneous for several reasons. First, for many instruments used in STEM education research, high-achieving students score high on the pretest. As a result, their ability to improve is limited due to the ceiling effect, and differences between treatment and control groups in posttest scores are likely to be minimal (Figure 1). In contrast, low-achieving students have a greater opportunity to change their scores between their pretest and posttest. Second, pedagogical innovations are more likely to have a greater impact on the learning of lower-performing students than higher-performing students. For example, Beck and Blumer (2012) found statistically greater gains in student confidence and scientific reasoning skills for students in the lowest quartile as compared with students in the highest quartile on pretest assessments in inquiry-based laboratory courses.
Theobald and Freeman (2014, p. 47) note that “regression models can also include interaction terms that test whether the intervention has a differential impact on different types of students.” Yet, we argue that these terms must be included and only should be excluded if they are not statistically significant.


