Set Theory, Logic, and Probability: The Integration of Qualitative Reasoning into Teaching Statistics for Quantitative Biology
DEAR EDITOR:
As the readers of CBE—Life Sciences Education know, modern biology has come a long way from its beginnings as a qualitative and descriptive science to its current status as a quantitative science, increasingly exploiting mathematical and computational tools to achieve mechanistic understanding of living systems (Howard, 2014; Liu and Mao, 2016). With the exponential increase in the amount of publications involving “quantitative biology” (Figure 1A; Corlan, 2004), it is important to remind ourselves and our students of the central role that qualitative and deductive reasoning continues to play in modern biology. The idea of probability is fundamental to qualitative reasoning and to learning biostatistics at the undergraduate level, as pointed out by Masel and colleagues in a recent article (Masel et al., 2015). We agree with the authors that probability not only provides the foundation for statistics course work but also is pivotal to implementing a logical and scientific way of thinking in the real world. Here we would like to echo the authors’ points and bring to the attention of readers a novel approach we have used in teaching probability in an undergraduate course. Specifically, at the beginning of the course, we have incorporated set theory, Venn diagrams, and basic propositional logic (Klement, 2004; Henle, 2007), which we believe were quite helpful to students in learning challenging concepts like tail probability and hypothesis testing.
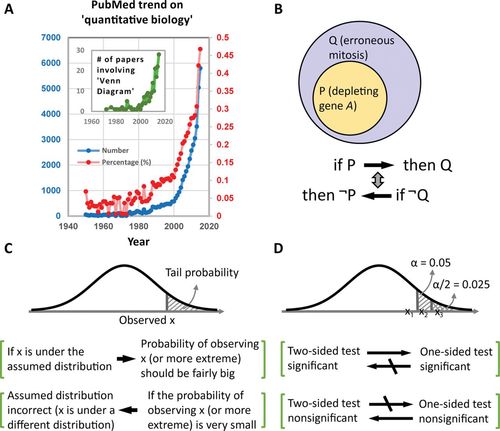
Figure 1. (A) PubMed trends of publications on “quantitative biology” or involving “Venn diagram.” Blue plots indicate the number of publications; red plots indicate the percentage of total publications per year on the topic of “quantitative biology.” Inset shows the number of publications involving “Venn diagram.” (B) Venn diagram and schematics of propositional logic on the relationship between two sets. See example in the text for details. (C) Using propositional logic to explain tail probability, which is the basis for hypothesis testing. (D) Illustration of the relationship between one-sided and two-sided hypothesis tests. α = 0.05 indicates rejection region of a one-sided test, with α/2 = 0.025 being that of a two-sided test. Observations: x3 = two-sided significant; x2 = two-sided nonsignificant but one-sided significant; and x1 = both two-sided and one-sided nonsignificant. Arrows indicate deductively valid inferences; barred arrows indicate deductively invalid inferences.
The Venn diagram has become increasingly popular for representing data in a way that facilitates reasoning by propositional logic (Figure 1A, inset; Venn, 1888). We used Venn diagrams to visually represent basic operations (conjunction, disjunction, and negation) when first teaching frequentist probability. For example, we asked students to make an inference using data from Liu et al. (2015) regarding a given conditional statement (“if gene A is depleted then there will be errors in mitosis”) to decide which of the following is correct: 1) if gene A is not depleted mitosis will have no errors; 2) error-free mitosis requires the presence of gene A; or 3) if there are errors in mitosis, gene A must be depleted. Students were encouraged to draw Venn diagrams to depict the relationship between “depleting gene A” and “erroneous mitosis” (Figure 1B). Using the Venn diagram, students came to recognize that any event falling in the set of “depleting gene A” must also be within the set of “erroneous mitosis” (i.e., depleting gene A in a cell is sufficient to cause erroneous mitosis), but not vice versa. Meanwhile, any event outside the set of “depleting gene A” could still be within the realm of “erroneous mitosis.” Therefore, inferences 1 and 3 are deductively invalid, while inference 2—the contrapositive of the original conditional statement—is deductively valid and logically equivalent to the original (Figure 1B). With the aid of Venn diagrams, it became easier to understand the mechanisms of common fallacy, such as affirming the consequent (e.g., inference 3 in the example; Hempel, 1966).
We believe that the combination of Venn diagrams and basic propositional logic—in particular, the notion that a conditional statement is logically equivalent to its contrapositive—lays a foundation for introducing more complex topics of tail probability and hypothesis testing (Figure 1, C and D). Valid deductions can be performed based purely on the structure of propositions. If a certain observation (e.g., sample mean) is under an assumed distribution, then the probability of making this observation (or more extreme observations) should be fairly big; this “tail probability” is empirically considered “big” when greater than 5%. If, however, this probability is fairly small (lower than 5%), then it can be reliably inferred that the sample is under a different distribution (Figure 1C). A natural next step from the concept of tail probability is hypothesis testing, in particular why the test conclusion has to go with “unable to reject the null hypothesis” (i.e., the assumed distribution) rather than “accept the null hypothesis,” given a p value greater than 5%. Otherwise, it would be a fallacy of affirming the consequent. Finally, propositional logic can also be used to understand how one-sided versus two-sided hypothesis tests differ in their stringencies (Figure 1D).
We believe that engaging students in qualitative reasoning through the use of set theory and Venn diagrams (e.g., visualization of tail probability and “rejection region”) and the use of propositional logic (e.g., law of contraposition) holds unique potential to support students in learning basic statistics with quantitative data. We hope Masel and colleagues will continue to study how to effectively support students in qualitative reasoning that promotes their statistical understanding. Perhaps they or others will measure how informal experiences such as ours could contribute to developing the quantitative biologists of the future.
ACKNOWLEDGMENTS
This work was supported by a fund from the Robert Wood Johnson Foundation to C.L. in conjunction with the Statistics for Quantitative Biology summer course at Columbia University Medical Center from 2014 to 2015. The authors thank D. Mowshowitz (Columbia University) for insight on teaching.


