Lighten the Load: Scaffolding Visual Literacy in Biochemistry and Molecular Biology
Abstract
The development of scientific visual literacy has been identified as critical to the training of tomorrow’s scientists and citizens alike. Within the context of the molecular life sciences in particular, visual representations frequently incorporate various components, such as discipline-specific graphical and diagrammatic features, varied levels of abstraction, and spatial arrangements of visual elements to convey information. Visual literacy is achieved when an individual understands the various ways in which a discipline uses these components to represent a particular way of knowing. Owing to the complex nature of visual representations, the activities through which visual literacy is developed have high cognitive load. Cognitive load can be reduced by first helping students to become fluent with the discrete components of visual representations before asking them to simultaneously integrate these components to extract the intended meaning of a representation. We present a taxonomy for characterizing one component of visual representations—the level of abstraction—as a first step in understanding the opportunities afforded students to develop fluency. Further, we demonstrate how our taxonomy can be used to analyze course assessments and spur discussions regarding the extent to which the development of visual literacy skills is supported by instruction within an undergraduate biochemistry curriculum.
INTRODUCTION
Modern techniques in the molecular life sciences uncover the intricate workings of a world invisible to the naked eye, generating vast data sets from which increasingly dynamic models of complicated systems can be created. Visualization and communication of new scientific knowledge cannot be easily accomplished with simple pictures. Indeed, life scientists are tasked with generating visual representations to communicate current understanding of complex biological systems to one another, to the general public, and for the edification of the next generation of scientists. For anyone other than practicing scientists, interpretation of these representations is often problematic (e.g., Winn, 1993; Kozma and Russell, 1997; Roth, 2002). The seemingly simple act of interpreting a given representation is dependent on diverse factors, including the individual’s depth of content knowledge about the idea or concept represented, the ability to decode visual information, and the nature of the representation itself (Schönborn and Anderson, 2009). Moreover, representations in the molecular life sciences frequently make use of discipline-specific graphical and diagrammatic features, varied levels of abstraction, and spatial arrangements of visual elements to convey information (Schönborn and Anderson, 2006). The interplay between the characteristics of a representation and the skills of the learner dictate the degree to which the intended meaning of the visual representation will be successfully extracted (Ainsworth, 2006; Schönborn and Anderson, 2009; Roth and Pozzer-Ardenghi, 2013).
Current efforts to transform undergraduate science instruction recommend explicitly targeting the development of core competencies that reflect the structure and practices of the discipline (American Association for the Advancement of Science [AAAS], 2011; Tansey et al., 2013; White et al., 2013). Visual literacy is one such core competency, the development of which seldom appears as an explicit learning outcome of undergraduate curricula. Rather, it is largely assumed that students will “pick it up” as they proceed through their programs, despite sparse evidence to suggest they will (Avgerinou and Ericson, 1997). For example, even early-stage science graduate students struggle to represent data in a scientifically meaningful and clear manner (Timmerman et al., 2013). Not surprisingly, the development of visual literacy has become a priority, particularly in biochemistry and the molecular life sciences (e.g., Schönborn and Anderson, 2006; Tibell and Rundgren, 2010).
Visual literacy has been variously defined (e.g., Trumbo, 1999; Schönborn and Anderson, 2006; Tibell and Rundgren, 2010; Towns et al., 2012), with most definitions drawing parallels to general verbal literacy by referencing the ability to read (make sense of) and write (draw or create) visual representations. Not surprisingly, it is thought that development of visual literacy first requires an individual to become familiar with the elements and symbols comprising the visual language of a particular discipline before the meaning of a representation can be adequately interpreted (Trumbo, 1999). The visual language used to encode disciplinary knowledge is, in many ways, inseparable from the ways of knowing a discipline (Lemke, 1998). For example, both biochemists and ecologists use arrows to represent interactions within biological systems. In biochemistry, arrows are often used to represent metabolic pathways. The origin of the arrow indicates the reactant(s) and the end of the arrow the product(s). In ecology, arrows represent energy flow through ecosystems, with the origin of the arrow often indicating a food source and the end of the arrow representing the consumer. Though the visual language is similar in both cases (arrows), the encoded messages are vastly different, as is the way the visual language is used. Mastery in any discipline requires understanding both the diversity and nuances in the ways in which disciplinary ways of knowing are represented (Airey and Linder, 2009). Airey and Linder (2009) refer to the collection of semiotic resources, the signs and symbols used to represent disciplinary ways of knowing, as disciplinary discourse, and propose that, by extension, learning can be conceived as the acquisition of discursive fluency, or facility with the modes of disciplinary discourse. We adopt this idea of “discursive fluency” to define scientific visual literacy as the achievement of fluency in the disciplinary discourse scientists use when engaging in activities such as 1) decoding and interpreting visual representations, 2) encoding and creating visual representations, and 3) generating mental models (Bamford, 2003; Schönborn and Anderson, 2010). For the purposes of this work, we focus primarily on fluency related to external (in contrast to internal or mental) representations of ideas.
Undergraduate science instruction makes extensive use of representations, which are made available through media such as textbooks, simulations, and lecture slides. Similarly, students are asked to generate visual representations such as schematic models, graphs, and diagrams. Each instantiation represents an opportunity through which students can practice, test, and develop visual literacy. The degree to which visual literacy can be achieved is constrained in part by these opportunities; students are unlikely to develop fluency with representations they have not been required to interpret, use, or generate (Airey and Linder, 2009).
In this paper we build on two ideas—that development of visual literacy 1) can be achieved through discursive fluency and 2) is constrained by the instructional opportunities that are afforded students—to further the discussion of visual literacy in biochemistry and molecular biology. Making sense of biochemical representations is an activity that involves the simultaneous manipulation of multiple elements (e.g., discipline-specific conventions, varied levels of abstraction, more than one level of biological organization), and human capacity for such processing of information is limited (Sweller, 1994). Therefore, we first synthesize the aforementioned perspectives through the lens of cognitive load theory as an explanatory framework and rationalize the need to discretely characterize specific aspects of instructional representations. Next, we use this framework to investigate the ways in which visual literacy is, or is not, reinforced within an undergraduate curriculum. Namely, we analyze course assessments because of their capacity to drive student learning.
BUILDING A FRAMEWORK: REDEFINING VISUAL LITERACY AS DISCIPLINARY DISCOURSE
We synthesize three bodies of literature as the theoretical basis for this work. First, we borrow the ideas of disciplinary discourse and discursive fluency from Airey and Linder (2009) to define visual literacy in biochemistry and the molecular life sciences. Second, we integrate theoretical and empirical work from chemistry and biology education to describe the nature of biochemical knowledge. Finally, we draw on cognitive load theory to explain why the development of visual literacy is difficult for students. Together, these perspectives justify the need to characterize and consider the various aspects of representations (such as level of abstraction) separately in order to make sense of the opportunities for developing scientific visual literacy in undergraduate students.
Visual Literacy Can Be Achieved through Acquisition of Discursive Fluency
Scientists do not work in isolation; rather they are participants within communities that contribute to a shared way of knowing within a discipline (National Academy of Sciences, National Academy of Engineering, and Institute of Medicine, 2009). It has long been recognized that disciplinary ways of knowing are inseparable from the ways in which that knowledge is codified (Postman and Wiengartner, 1971); scientists use written language, images, and symbols to represent disciplinary knowledge. Airey and Linder (2009) refer to the complex system of semiotics used to represent disciplinary ways of knowing as disciplinary discourse, and describe two unique aspects of disciplinary discourse that set it apart from more traditional definitions of discourse (e.g., see Tsui, 2004; Gee, 2005). First, disciplinary discourse signifies more than just specialized oral or written language but also includes representations such as graphs, diagrams, and formulae, which may not be conventionally thought of as language. Second, disciplinary discourse includes the tools (i.e., pieces of apparatus, measuring devices) and activities (i.e., actions, practices, and methods) of the discipline, thereby emphasizing the role of participation in acquiring disciplinary ways of knowing, particularly in science.
When engaging in disciplinary discourse, scientists make use of various semiotic resources, or modes, each of which provides access to a different facet of disciplinary ways of knowing (Figure 1). The representations created and used by scientists are one type of mode comprising disciplinary discourse. For example, when students are taught about enzyme inhibition, three representations are frequently used: diagrams, equations, and graphs (Figure 2). Each representation provides access to a different facet of enzyme inhibition, while minimizing or omitting other facets. Each representation has different affordances, or possibilities for representing, and limitations for disciplinary discourse (Kress and van Leeuwen, 2001; Airey and Linder, 2009). As such, no single representation can adequately convey a disciplinary way of knowing. It is through the combination of representations that students will gain a rich and holistic experience of the disciplinary ways of knowing about enzyme inhibition.
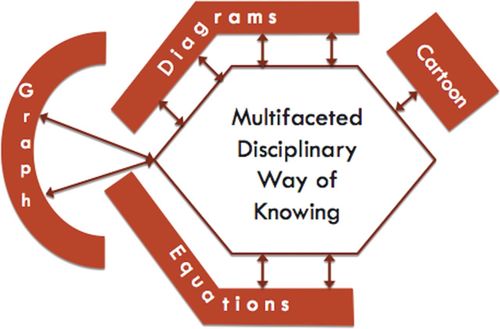
FIGURE 1. Various semiotic resources, or modes, provide access to different facets of disciplinary ways of knowing. (Adapted from Airey and Linder, 2009.)
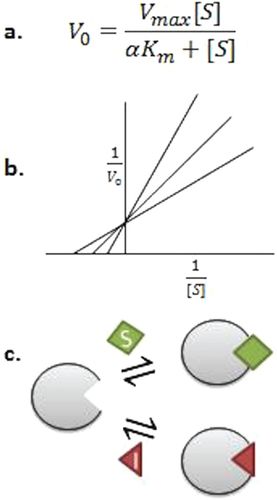
FIGURE 2. Three different modes, each representing a different facet of enzyme inhibition: (a) Michaelis–Menten equation expresses initial velocity of enzyme reactions as a function of substrate concentration; (b) Lineweaver–Burk plot of an enzyme in the presence of varying concentration of inhibitor; and (c) schematic representation of competitive enzyme inhibition. (Adapted from Lehninger’s Principles of Biochemistry, 5th ed.)
We argue that visual literacy can be defined in terms of discursive fluency, that is, when a student understands the various “ways in which the discipline generally uses that mode to represent a particular way of knowing” (Airey and Linder, 2009, p. 33). While the emphasis of this essay is on visual perception, and therefore visual modes, discursive fluency as conceptualized by Airey and Linder includes other nonvisual modes (i.e., gesture) and disciplinary tools (i.e., specialized apparati) and disciplinary practices (i.e., how science is done). Development of discursive fluency requires opportunities for students to engage in repetitive practice with multiple representations, allowing connections between representations and the various facets of disciplinary knowledge to be drawn (Ainsworth, 2006; Airey and Linder, 2009). Once achieved, discursive fluency facilitates students making sense of complex representations without exceeding mental processing capacity (Sweller, 1994); what is initially a multistep process of decoding imagery and extracting information becomes “second nature” to the student (Taber, 2002).
Repetitive practice is a necessary but insufficient condition for developing fluency (Airey and Linder, 2009); students must also value the development of fluency. Student learning is driven, in large part, by assessment; students pay attention to and value what is being assessed and adjust their approach to learning in a course accordingly (Hattie and Timperley, 2007; Offerdahl and Montplaisir, 2014). For example, if students are asked only questions testing rote memorization or simple comprehension, they learn that success in a course is achieved through lower-level activities and without performing higher-level skills that require application, analysis, or synthesis. Classroom assessments, both formative and summative, communicate to students what is expected of them in terms of performance but also send implicit messages about the nature of knowledge and what is valued in a discipline. For example, assessments that assess predominantly lower-level thinking skills can reinforce erroneous ideas that expertise in life sciences is achieved through the accumulation of facts (Momsen et al., 2010). Similarly, assessments that do not include representations send a message that visual literacy is not valued. Opportunities for practice with varied representations must be reinforced by assessments that signal to students that visual literacy is important and authentic to the discipline (Airey and Linder, 2009).
Teaching Visual Literacy Requires Careful Consideration of the Nature of Biochemical Knowledge
Biochemical knowledge is developed by investigating and modeling a world that cannot be directly observed or experienced. Understanding the relationship between the unseen world and observable “macro” phenomena requires reasoning across multiple levels of scale or organization (e.g., microscopic to ecological). Student difficulties in reasoning across levels of organization have been identified previously in biology (e.g., Marbach-Ad and Stavy, 2000; Duncan and Reiser, 2007) and chemistry (e.g., Gabel, 1998) and at the crossroads of the disciplines in biochemistry (Grayson et al., 2001). For example, students can predict the effect of a single amino acid mutation on the structure of a protein, but they are less likely to understand how this change is related to phenotypic differences at a higher level of organization (e.g., cellular, tissue, organismal). The development of visual literacy is constrained, in part, by the ability to reason across levels of biological organization (Schönborn and Anderson, 2009).
Similarly, the level of abstraction used in a representation, that is, the degree to which a representation resembles a phenomenon of interest (Schönborn and Anderson, 2010), is an often subtle yet problematic aspect for students when making sense of representations. Roth and Pozzer-Ardenghi (2013) propose that variation in abstraction is best described as a continuum ranging from more detailed and realistic representations on one end to representations that are less detailed and more abstract on the other. Extracting the intended meaning from a representation can be a challenge for students with limited visual literacy because 1) the same concept may be represented by more than one image with varied degrees of abstraction (Figure 3) or 2) a representation with the same level of abstraction is used to represent many concepts (Figure 4; Schönborn and Anderson, 2006; Schönborn et al., 2002). Consider our example of reaction coupling (Figure 3). Each representation conveys similar information, yet they differ in the amount of detail, and therefore the level of abstraction, used. In this example, the entity or idea that is being represented (i.e., reaction coupling) remains constant between the representations, as does the level of biological organization (i.e., molecular level), but the level of abstraction varies (e.g., schematic vs. a graph). Similarly, we can reflect on some of the ways in which protein–ligand binding is represented. In some instances, a space-filling model (e.g., cartoon) is used to depict a ligand binding to protein, whereas in others the generalized equation P + L ↔ P · L (e.g., symbolism) is used. Moreover, students could interpret the symbolic representation of protein–ligand interactions in the same way they would a reaction from inorganic chemistry. While not entirely incorrect, this interpretation deters students from thinking about binding as a readily reversible reaction, thereby undermining students’ reasoning about the role of noncovalent interactions and induced fit.
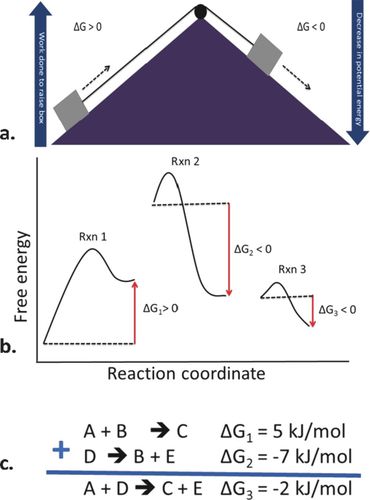
FIGURE 3. Example of a single concept (reaction coupling) represented by multiple images with varying levels of abstraction. (Adapted from Lehninger’s Principles of Biochemistry, 5th ed.)

FIGURE 4. Sigmoidal curves are all line graphs and are similar in their level of abstraction, but represent different biochemical phenomena.
Even within a discrete level of abstraction, common biochemical conventions or “visual shorthand” used by experts to encode information might present barriers to students. Instruction and curricular materials in support of visual literacy must therefore accommodate students’ mastery of such visual language. When exposed to cartoon renderings of protein structures, biochemistry students might readily perceive the dimensionality depicted in the representation, but they must be explicitly taught the conventions used in these cartoons to fully unpack the embedded structural information. For example, the conventions used in ribbon diagrams (e.g., arrows, corkscrews) communicate key features of protein structure such as directionality and secondary structural elements, conventions that students might attribute instead to artistic preference.
Consistent with the principles of scientific teaching (Handelsman et al., 2007) and backward design (Wiggins and McTighe, 2005), whereby instructional design begins with the identification of measurable outcomes followed by a well-aligned assessment plan (AAAS, 2011), we agree that the development of scientific visual literacy needs to be an explicit and scaffolded goal of undergraduate curricula (Schönborn and Anderson, 2006). Within the specific context of biochemistry, identifying meaningful learning outcomes for visual literacy requires more careful consideration of the nature of biochemical knowledge and the ways in which it can be represented. Biochemical knowledge integrates chemical and physical principles within the context of biological systems. Teaching about the nature of biochemical knowledge necessitates acknowledging the epistemological contributions of chemistry, physics, and biology. Across these disciplines, students are asked to make sense of and explain natural phenomena, requiring them to engage in multilevel thought and make connections between the observable world and that which is invisible (e.g., Johnstone, 1991; Talanquer, 2011; Taber, 2013). Johnstone (1991) suggests that students in physics reason at the “macro” level, the invisible (e.g., forces), and the symbolic (e.g., equations). Similarly, students in biology think about the macro (e.g., organisms), the micro (e.g., cells, organelles), and the biochemical (e.g., DNA, ATP) levels, while those in chemistry reason with the macro (e.g., visible phenomena), submicro (e.g., molecules), and symbolic (e.g., chemical formulae) levels (Johnstone, 1991). Towns et al. (2012) formally integrated these perspectives to model biochemical knowledge as a tetrahedron, which identifies four domains: macroscopic (e.g., anatomy of an organism), microscopic (e.g., components of a cell), particulate (e.g., Van der Waals interactions, alpha helices and beta sheets in proteins), and symbolic (e.g., Michaelis–Menten equation). However, the tetrahedron is problematic, because it does not allow for discrete characterization of biochemical knowledge by domain. Using our ligand-binding example again, P + L ↔ P · L is a representation that is both particulate and symbolic. In contrast, Talanquer (2011) reenvisioned the traditional “chemistry triplet” proposed by Johnstone (1991), arguing that three domains or “types” of chemical knowledge relevant to teaching—experiences, models, and visualizations—can be conceptualized on different scales and dimensions and through various approaches. Talanquer’s framework applies equally well to understanding the nature of biochemical knowledge, because it clearly places the way in which the phenomenon is represented (i.e., as symbols in our ligand-binding example) on a separate axis from the scale (i.e., level of biological organization, which in this example is at the molecular level). This distinction has implications for student learning from a cognitive load perspective (discussed in the following section); the level of biological organization and level of abstraction are two aspects of a representation that students must learn to navigate to become visually literate.
Interpreting Representations Is an Activity with High Cognitive Load
Making sense of biochemical representations is an activity that involves the simultaneous manipulation of multiple elements (i.e., level of biological organization, level of abstraction, biochemical convention). Human capacity for processing information is exceptionally limited; working memory, which can be thought of as the ability to mentally grasp relationships among pieces of information, can accommodate only a limited number of elements, or “chunks” of elements, at a time (Sweller, 1994; Halford et al., 2005). When considering short, simple elements, like single digits or letters, learners are thought to be capable of connecting about seven items together (Miller, 1956). However, research suggests that, for longer words or more complex ideas, this number is much lower—often less than four (Cowan, 2001; Halford et al. 2005). The number of elements that a learner can build relationships between can improve with increased exposure, as familiarity allows for individual elements to be organized into larger chunks (Sweller, 1994; Cowan, 2001; Halford et al. 2005).
For students, the unpacking of biochemical representations, which is inherently associated with a high cognitive load, is more challenging. They do not possess the familiarity needed to recognize relationships between representational (e.g., ribbon diagram) and conceptual (e.g., secondary protein structure) elements, which necessitates that they spend more cognitive capacity on processing information. In comparison, experts have developed, slowly over time and through repeated practice, sophisticated schema that link discrete elements together. For example, expert biochemists would be more likely to infer protein function by noticing common motifs, the knowledge of which is retrieved as a single element. In contrast, novice biochemistry students would be more likely to see individual secondary structural elements and then make sense of them together to make inferences about overall protein structure followed by function. The transition from novice to expert-like understanding, therefore, can be described as a process of schema restructuring. As learners are exposed to and interact with information over time, their schemata are restructured to connect and accommodate that information. Previously discrete elements become linked together and accessed as a single element, thereby reducing the cognitive load on working memory. Eventually, accessing and applying those schemata becomes less error-prone and more fluent (Sweller, 1994).
A suggested method for reducing the cognitive load associated with processing information is to break information down into smaller pieces that can be taught in isolation first, and then later brought together (Sweller, 1994), thereby scaffolding the development of schemata. With respect to visual literacy in particular, Airey and Linder (2009) propose that students must first develop some discursive fluency in the representations critical to a discipline before they can come to understand how the multiple facets of each contribute to the whole. Therefore, to become visually literate in biochemistry, students must develop familiarity with the representations prevalent in the discipline by understanding how and in which contexts each is used. Through multiple opportunities to practice, translating the “language” of a visual representation (i.e., level of abstraction) would become more automatic, reducing the cognitive effort required and resulting in a greater capacity for inferring the message embedded in the representation.
INSTRUCTIONAL REPRESENTATIONS CAN BE CHARACTERIZED ACCORDING TO LEVEL OF ABSTRACTION
Schönborn and Anderson (2009) empirically validated a model explaining the factors involved in successfully interpreting representations. These factors include 1) an individual’s content knowledge, 2) an individual’s ability to reason, and 3) the visual characteristics of the representation itself. They argued that, in order to develop students’ visual literacy, undergraduate instruction should increase students’ familiarity and fluency with the key characteristics of representations (Schönborn and Anderson, 2006). Instructional opportunities that allow students to first tackle individual cognitive elements reduce the cognitive load of complex activities and, when scaffolded appropriately, promote development of expertise. Visual literacy, therefore, can be supported by reducing cognitive load through the creation of instructional opportunities that independently ask students to reason about one characteristic of representations, the level of abstraction, while holding other factors (i.e., organization) “constant,” and vice versa. We describe here the development of a taxonomy for characterizing abstraction in instructional representations (Figure 5).
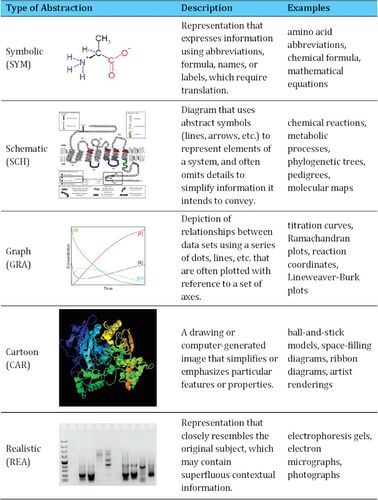
FIGURE 5. Characterization scheme for abstraction in biochemical and molecular biology representations. (a) l-α-Alanine (V8rik, 2007). (Licensed under CC BY-SA 3.0: https://creativecommons.org/licenses/by-sa/3.0/deed.en.) (b) G protein-coupled receptor (GPCR) in membrane (Repapetilto, 2010). (Licensed under CC BY-SA 3.0: https://creativecommons.org/licenses/by-sa/3.0/deed.en) (c) Michaelis–Menten S P E ES (U+003F, 2011). (Licensed under CC0 http://creativecommons.org/publicdomain/zero/1.0/deed.en.) (d) Acetylcholinesterase rainbow (Sussman, 2012). (Licensed under GPL: www.gnu.org/licenses/gpl.html.) (e) Unspecific PCR (Retama, 2008). (Licensed under CC BY-SA 4.0: https://creativecommons.org/licenses/by-sa/4.0.)
Taxonomy Development
Figures in textbooks are a frequently used instructional representation and signify one prominent opportunity for students to interact with representations. It has been estimated that up to 50% of the page space in undergraduate biochemistry and genetics textbooks is occupied with images (Tibell and Rundgren, 2010). Further, most syllabi include recommended reading assignments to introduce and reinforce concepts to students (Henderson and Rosenthal, 2006). Instructors also use figures from textbooks in lectures and classroom activities. Due to their prominence in the undergraduate teaching, we used textbook figures to develop a taxonomy that allows for characterizing five general categories of abstraction used in instructional representations. The taxonomy was developed through an iterative process (described in detail below) beginning with the three broad categories (abstract, stylized, and realistic) suggested by Schönborn and Anderson (2006, 2009). The scheme was refined through multiple cycles using a constant comparative approach (Glaser and Strauss, 1967; Maykut and Morehouse, 1994) to identify emergent categories, which were validated through subsequent rounds of coding.
Textbook figures frequently contain multiple panels, so the unit of analysis was a figure panel. A given figure panel could include multiple representations or a single representation combining levels of abstraction and therefore could be coded at different levels of abstraction (Figure 6). We began with the figures from a single chapter of Lehninger’s Principles of Biochemistry (Nelson and Cox, 2008) to test Schönborn and Anderson’s (2006, 2009) three categories (abstract, stylized, and realistic) and found it difficult to reliably assign figure panels into the stylized category as opposed to the abstract. Moreover, the categories were insufficient for capturing the range of abstractions used. Therefore, a constant comparative approach was applied (Glaser and Strauss, 1967; Maykut and Morehouse, 1994) to the same set of figures to identify emergent categories and develop a preliminary coding scheme. For example, when figures with protein structures were coded, the representations were initially coded according to the biochemical convention used. A space-filling model received a code (CSF) different from that of a ribbon diagram (CRB). These codes (CSF and CRB) were later collapsed into a more general category of “cartoon” (CAR). Similarly, codes for histograms (GHG) and pie charts (GPC) were later collapsed with others to form the more general graphs (GRA) category. Through an iterative process, the coding scheme was applied to additional chapters, expanded, and refined until all biochemistry textbook figures in a given round of coding could be assigned to at least one category and percent agreement between two independent raters was greater than 90% before discussion. Percent agreement was used as the measure of reliability, because the unit of analysis could be assigned more than one code; other reliability statistics (e.g., Krippendorf’s alpha, Cohen’s kappa) assume mutual exclusivity.
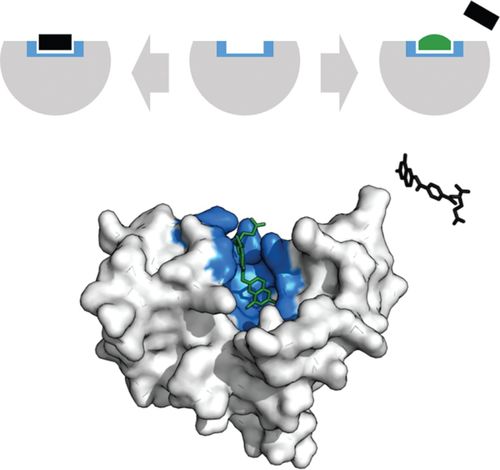
FIGURE 6. Example of a double coding of multimodal figures. The figure represents ligand binding through the use of both conventional cartoons and schematic representations. DHFR methotrexate inhibitor (Shafee, 2015). (Licensed under CC BY-SA 4.0: http://creativecommons.org/licenses/by-sa/4.0.)
While textbook figures are one of the most common representations to which students are exposed, our definition of visual literacy maintains that students become discursively fluent. Appropriately, we further tested the taxonomy by applying it to representations produced by scientists in a routine form of disciplinary discourse—peer-reviewed literature. We collected figures from a sample of five high-profile journals (Journal of Biological Chemistry, Biochemistry, Cell, Nature, and Science) published in the same 2 month time period that feature biochemical research. We only selected papers publishing research in biochemistry and the molecular life sciences and used the figures (N = 176) from only those papers. No further refinements to the taxonomy were necessary; all figures were assigned to categories with high agreement (> 96%) between coders before discussion (Table 1). This final taxonomy (Figure 5) was then validated.
| Figure source | Percent agreement |
|---|---|
| Introductory biology texts | 91.0, n = 456 |
| Biochemistry texts | 91.8, n = 785 |
| Primary literature | 96.6, n = 176 |
Validity of the final taxonomy was demonstrated by measuring percent agreement within and between teams of coders after applying the taxonomy to figures collected from multiple textbooks (Table 2). Specifically, two of the authors (E.G.O. and J.B.A.) coded one chapter from each textbook with high agreement. Then two new coders were partnered with E.G.O. and J.B.A. (one each) to form two new teams of two. These teams then coded one chapter each. Percent agreement between independent coders before discussion was greater than 90% across coding events (Table 1). Discrepancies between coders were due to overlooking elements of multiabstraction figures rather than disagreement regarding the classification of the abstraction. For example, in Figure 6 one coder might have characterized the representation as only schematic, missing the cartoon aspect. The coder would acknowledge the omission during comparison of coding, and the figure would be coded for more than one abstraction. Thus, consensus was always reached upon discussion.
| Introductory biology | Biochemistry |
|---|---|
| Biological Science, 3rd ed. (Freeman, 2008) | Biochemistry, 4th ed. (Voet and Voet, 2011) |
| Biology, 1st ed. (Brooker et al., 2008) | Biochemistry: A Short Course, 1st ed. (Tymoczko et al., 2010) |
| Biology, 8th ed. (Campbell et al., 2008) | Fundamentals of Biochemistry, 4th ed. (Voet et al., 2013) |
| Biology, 8th ed. (Raven et al., 2008) | Lehninger’s Principles of Biochemistry, 5th ed. (Nelson and Cox, 2008) |
| Biology: The Unity and Diversity of Life, 11th ed. (Starr and Taggart, 2008) | |
| Life: the Science of Biology, 8th ed. (Sadava et al., 2008) |
Figures from undergraduate biochemistry and introductory biology textbooks (Table 2) were used to validate the taxonomy. Biochemistry focuses predominantly on phenomena at the subcellular level, so we also included biology textbooks in our validation to verify the utility of the taxonomy at other levels of biological organization. The biochemistry textbooks selected for validation were chosen with an eye toward diversity in publisher and also in adoption; we chose books that are commonly used in both single-semester and two-semester biochemistry courses. We used the same introductory biology textbooks as those from a recent analysis of biology textbooks (Duncan et al., 2011).
Taxonomy of Visual Abstraction
The taxonomy (Figure 5), which comprises five categories, is consistent with previous work examining textbook figures (e.g., see Rybarczyk, 2011), though our taxonomy is unique due to its sole focus on level of abstraction. While our five categories (described in the following five paragraphs) can readily be divided into “more” or “less” abstract, their arrangement does not suggest an absolute ordering (i.e., symbols are less abstract than graphs) along the abstraction continuum. Rather, prior knowledge influences what and how different aspects of a representation are approached (Schönborn and Anderson, 2009). Students with more expert levels of prior knowledge are more likely to automatically and unconsciously retrieve information than those with more novice levels. A student examining the titration curve of an amino acid, for example, may or may not be able to infer whether the ionizable side group of that particular amino acid is functioning as an acid or a base. This means that the same representation (in this instance, a titration curve) may seem slightly more or less abstract to individuals with varying prior knowledge.
Symbolic representations are those in which a letter, word, or phrase is the sole representation of a structure, concept, or process. The majority of figures coded as symbolic used abbreviations, names, or symbols to encode information. For example, amino acids were represented by chemical structures (as seen in Figure 5), chemical formulae, one- or three-letter abbreviations, or their names.
Schematic representations use lines, arrows, and/or other abstract pictorial elements. Schematic representations depict complex ideas but omit superfluous elements and contain only the minimal features needed to convey or interpret the message. Chemical reactions and metabolic processes are frequently represented as schematics in biochemistry. Chemical structures would also be considered schematic, as atoms and bonds are signified by abbreviations and lines, respectively.
Graphs are diagrams that often use curves, bars, or plotted points to depict a relationship between two or more variables. While Cartesian coordinate systems are frequently used to show a curve or line that represents a mathematical function, a wide variety of charts and plots are considered graphs. In biochemistry, this would include titration curves, Ramachandran plots, and kinetic diagrams.
Cartoons are representations that typically include more visual detail than the previous categories, in many cases containing “often-irrelevant or gratuitous information” (Roth and Pozzer-Ardenghi, 2013). This category includes “nonconventional” cartoons (e.g., artist renderings) and “conventional” cartoons commonly used by biochemists to represent molecules (e.g., ball-and-stick models, ribbon diagrams, space-filling models), which possess their own visual shorthand for decoding and interpretation.
Realistic images are representations in which an object’s likeness has been captured on film and therefore include the most visual detail. Generally, these are limited to photographs and electron micrographs. While realistic images are arguably the most realistic representations, short of interacting with the actual subject of the image, they can still depict more abstract information. For instance, photographs of electrophoretic gels might need to be interpreted.
ASSESSMENT DRIVES LEARNING: WHAT DO OUR ASSESSMENTS TELL US ABOUT THE POTENTIAL FOR VISUAL LITERACY?
As previously noted, undergraduate learning should be guided by the principles of scientific teaching (Handelsman et al., 2007) and backward design (Wiggins and McTighe, 2005). Designing undergraduate curricula with visual literacy in mind means not only articulating explicit learning outcomes for visual literacy but also creating robust opportunities for students to be exposed to and engage with visual representations and reinforcing visual literacy through well-aligned assessment tools. Assessments that support visual literacy should be authentic (Airey and Linder, 2009), thereby enforcing discursive fluency by requiring students to engage with and translate across varied levels of abstraction.
Students pay attention to assessments and revise their approaches to learning accordingly (e.g., Hattie and Timperley, 2007). Assessments not only shape how students learn, but they reinforce students’ ideas about the disciplinary practices of scientists (Momsen et al., 2013). If assessments do not regularly make use of representations, instructors are sending an implicit message to students that visual literacy is unimportant and may inadvertently reinforce erroneous ideas about the role of visualization within the discipline (Airey and Linder, 2009). Therefore examining course assessments provides insight into the degree to which key concepts and skills are reinforced (Momsen et al., 2013).
While engaged in an undergraduate curriculum reform project, one of the authors (E.G.O.) used the taxonomy to better understand the degree to which assessments were reinforcing visual literacy skills. Assessment items were collected from across a curriculum to serve as a “snapshot” that ultimately allowed for faculty reflection on the ways in which visual literacy was (or was not) assessed and reinforced across a single curriculum.
Data Collection and Analysis
We collected all summative assessments from general chemistry (both semesters), introductory biology (cellular and molecular biology semester), cell biology, and biochemistry courses (Table 3). These courses were selected because they are commonly required by biochemistry majors and represent one progression through the curriculum. Only the assessment items that included representations were used for analysis (Table 3, 65% of total assessment items). One coder assigned abstraction levels to all visual assessment items (n = 523), while a second coder independently coded a sample from each discipline (n = 253) to serve as a measure of reliability. Percent agreement between the two coders was 98.5% before discussion. Assessment items that contained more than one level of abstraction were assigned multiple codes (e.g., contained both a graph and a protein structure). Examples of assessment items from general chemistry, introductory biology, and biochemistry are included in Figure 7.
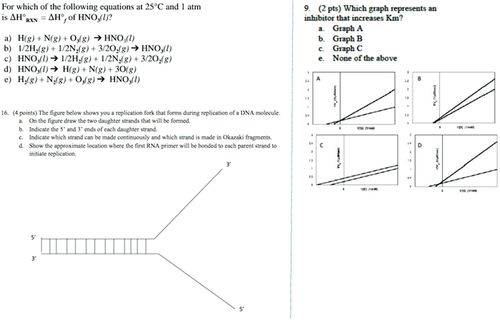
FIGURE 7. Sample assessment items containing visual representations with different levels of abstraction: general chemistry (symbolic), introductory biology (schematic), and biochemistry (cartoon).
| Exams collected | Assessment items | Items with visual representation | Visual items with >1 level of abstraction | |
|---|---|---|---|---|
| General chemistry | 9 | 250 | 215 (86%) | 12 (6%) |
| Introductory biology | 8 | 310 | 175 (56%) | 101 (58%) |
| Cell biology | 4 | 168 | 69 (41%) | 24 (35%) |
| Biochemistry | 3 | 82 | 64 (78%) | 32 (50%) |
More than half (65%) of all assessment items collected contained at least one representation, though there was notable variability in the level of abstraction reinforced, particularly when examined across courses (Figure 8). Introductory chemistry and biology course assessments were more heavily laden with symbolic (99 and 56%, respectively) and schematic (85% in biology) representations, while upper-level courses increasingly included more graphical representations (up to 47% in biochemistry as compared with 1% in chemistry and 11% in introductory biology). These data reveal distinct differences between the introductory and upper-level course assessments within this particular curriculum. From the perspective of the faculty involved in curriculum reform, these differences were interesting fodder for discussion. For example, faculty questioned the lower frequency of graphical representations in the freshman (i.e., general chemistry and introductory biology) and sophomore (i.e., cell biology) level, the degree to which such frequencies would support students’ abilities to use and interpret graphical representations, and what an “appropriate” frequency should look like across a curriculum.
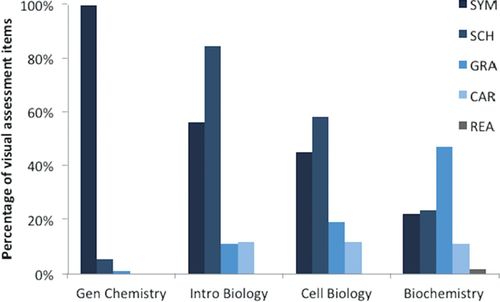
FIGURE 8. Percentage of coded visual assessment items demonstrating each level of abstraction within the specified course. (Bars do not total 100%, as some items were multimodal and were therefore double coded.)
Biochemical expertise is developed through the integration of chemical and physical principles within the context of biological systems. And this expertise is achieved over time as students traverse the curriculum. These data also caused us to reflect on whether the frequency of particular levels of abstraction accurately depicts the critical representations used in disciplinary discourse. For example, the prevalence of symbolic representations in introductory chemistry assessments (Figure 8) is reassuring, as symbolic notation is crucial to the discipline. But graphs (e.g., titration curves, velocity vs. substrate curves) and schematic representations (e.g., chemical reactions) are also an important aspect of disciplinary discourse in chemistry. Similarly, biochemistry assessment items made use of all the levels of abstraction, yet cartoons and realistic representations comprised fewer than 20% of the total assessment items. Both levels of abstraction are frequently used in the discipline; protein structures rendered with molecular cartoons and realistic images (e.g., isoelectric focusing experiments) are staples of primary literature. The limited use of cartoon and realistic representations raised questions for us about the authenticity of the tasks we ask our students to engage in while demonstrating mastery of biochemistry. The lower frequency of certain levels prompted us as instructors to consider the degree to which students view fluency with various abstractions to be important to their chemical and biochemical understanding and the role assessment plays in reinforcing these ideas. From a curricular perspective, if students fail to develop fluency in introductory courses, they will be unlikely to integrate that knowledge appropriately within the interdisciplinary context of biochemistry.
Prior research has demonstrated the benefits of multimodal representations— representations using two or more types of abstraction simultaneously—on student learning, because such representations provide unique access to diverse facets of disciplinary ways of knowing (Kozma, 2003; Ainsworth, 2006; Airey and Linder, 2009) and, through repeated practice, can support the schema restructuring needed to reduce cognitive load (Sweller, 1994). An example of a multimodal representation can be seen in Figure 6, in which a schematic depicts the process of competitive inhibition in conjunction with a conventional cartoon that provides structural details of the enzyme, substrate, and inhibitor. We used the coding scheme for level of abstraction to determine the degree to which students interact with more than one level of abstraction at the same time. For example, in our snapshot of the curriculum, students are more frequently assessed using multiple modes of abstraction in introductory biology and biochemistry (58 and 50% respectively) than in general chemistry (6%, Table 3). This observation has sparked discussion between some of the instructors of these courses about new assessment strategies that not only would reinforce students’ abilities to reason across levels of abstraction but would do so through more authentic tasks. For example, one instructor is designing an assessment item in which students are given an experimental interpretation for which they must select the minimal set of figures (e.g., graphs, micrographs) that would support that claim.
DISCUSSION
We have defined visual literacy in terms of discursive fluency, and in doing so laid the foundation for the articulation of learning outcomes that would drive undergraduate curricula in support of visual literacy. Learning outcomes with an eye toward visual literacy should scaffold students’ acquisition of visual language and disciplinary conventions, develop their understanding of the ways in which various levels of abstraction are used to represent disciplinary ways of knowing, and challenge them to translate across levels of abstraction. We have also presented a taxonomy that can be used as one of many tools for instructors to characterize the opportunities made available to students. This taxonomy is useful for individual instructors trying to reflect on curricular design and be more intentional about creating diverse opportunities for students to gain experience across a range of abstraction. Scaffolded learning experiences in which students first interact with a single level of abstraction followed by gradual introduction of multiple levels of abstraction will support students along the novice–expert continuum; they will become increasingly fluent at linking abstraction elements into more sophisticated schema. Instruments such as the Taxonomy of Biochemistry External Representations (Towns et al. 2012), which emerged from models of biochemical knowledge as a tetrahedron, could then be used to identify representations that bridge cognitive elements (e.g., level of abstraction with level of biological organization). Careful selection of representations that provide an opportunity to layer an additional cognitive element (e.g., level of biological organization) on top of one in which they have already gained fluency (e.g., abstraction) will scaffold development of visual literacy by reducing the cognitive load of visualization activities throughout the learning process. Successfully scaffolding the development of visual literacy is important not only for future scientists but also for members of the general public as future consumers of scientific communications (e.g., press releases, scientific policy debates).
We have presented one way to characterize the nature of representations and, by extension, the opportunities available for student practice with and reinforcement of visual literacy activities. From an instructional perspective, examining representations using this taxonomy has promoted diagnosis of the opportunities provided to students and a discussion about the appropriateness of those opportunities. From a research perspective, the current understanding of which facet(s) of disciplinary ways of knowing is accessed through various representations and levels of abstraction is limited. Therefore, future research should shift to focus on the learner by exploring the underlying mechanisms of students’ visual cognition, including how they reason with and across different levels of abstraction.
ACKNOWLEDGMENTS
This material is based on work supported, in part, by National Science Foundation grants CHE 1062701 and DGE 1010619. Thank you to Jennifer Momsen, Jenny Dauer, Joe Dauer, and Elena Brae Speth for many email conversations about visualization.


