Teaching Cell Biology in the Large-Enrollment Classroom: Methods to Promote Analytical Thinking and Assessment of Their Effectiveness
Abstract
A large-enrollment, undergraduate cellular biology lecture course is described whose primary goal is to help students acquire skill in the interpretation of experimental data. The premise is that this kind of analytical reasoning is not intuitive for most people and, in the absence of hands-on laboratory experience, will not readily develop unless instructional methods and examinations specifically designed to foster it are employed. Promoting scientific thinking forces changes in the roles of both teacher and student. We describe didactic strategies that include directed practice of data analysis in a workshop format, active learning through verbal and written communication, visualization of abstractions diagrammatically, and the use of ancillary small-group mentoring sessions with faculty. The implications for a teacher in reducing the breadth and depth of coverage, becoming coach instead of lecturer, and helping students to diagnose cognitive weaknesses are discussed. In order to determine the efficacy of these strategies, we have carefully monitored student performance and have demonstrated a large gain in a pre- and posttest comparison of scores on identical problems, improved test scores on several successive midterm examinations when the statistical analysis accounts for the relative difficulty of the problems, and higher scores in comparison to students in a control course whose objective was information transfer, not acquisition of reasoning skills. A novel analytical index (student mobility profile) is described that demonstrates that this improvement was not random, but a systematic outcome of the teaching/learning strategies employed. An assessment of attitudes showed that, in spite of finding it difficult, students endorse this approach to learning, but also favor curricular changes that would introduce an analytical emphasis earlier in their training.
INTRODUCTION
In the decade of the 1960s, new editions of some texts previously titled Cytology became Cell Biology. This change reflected the fact that an increasing application of biochemical techniques was beginning to permit a mechanistic, not just descriptive, definition of cellular activities. In order to accommodate the subsequent flood of new information, cell biology texts have steadily grown in size to well beyond 1,000 pages. That the latest revisions of some of these books are significantly shorter signals the practical necessity for selectivity by teachers in the choice of subjects and the depth in which they are presented to students (e.g., Lodish et al., 1995, 2000). Though decisions about content are certainly important, teachers of cell biology can also design courses that help students acquire those analytical thinking skills common to research practitioners. Such a course is not just about the science, but about how to perform the science, at least intellectually. The emphasis shifts from memorizing a body of information to investigating experimental protocols and drawing conclusions from the data they generate.
It may often be assumed, incorrectly we believe, that students will naturally acquire the habit of scientific thinking in the course of reading cell biology texts or listening to traditional descriptive presentations. While the ability to analyze experimental data may be intuitive for a small number of our students, it is not for most. Importantly, college students identify their most influential teachers as those who taught them to“ think like professionals in the field” (Light, 2001). At schools with small, laboratory-intensive courses or abundant research opportunities, students effectively obtain some measure of skill in this practice of science. Where enrollments are large, however, and budgets for hands-on experience limited, nonlaboratory courses must provide much of this intellectual training.
The number of undergraduates majoring in the five departments of the College of Biology and Agriculture at Brigham Young University (BYU) exceeds 2,200. Many of the degree programs in this college require courses in molecular biology, genetics, and cell biology, which are deemed core subjects. A significant number of additional students also enroll in these lecture courses, for example, premed students majoring in the social sciences or humanities. As a result, sections of these courses with greater than 100 students are common. Laboratory exercises are not an integral feature of these courses, although students commonly take one or two separate laboratory courses that introduce the relevant experimental techniques. Still, the hands-on research experience provided by this system is minimal (cost limited), and insufficient to provide adequate training in the design, execution, and interpretation of experimental biology.
Helping students acquire skill in scientific reasoning has become the focus of the cell biology course at BYU. We report here our efforts at achieving this goal in the large nonlaboratory classroom through the use of innovative didactic strategies and examination questions that promote and assess analytical problem-solving abilities. In addition, we have sought rigorous evidence to test the effectiveness of this teaching/learning system and to determine whether it offers advantages over more traditional methods. Specifically, we have addressed the following questions:
Does student ability to draw conclusions from experimental data related to cell biology improve during the course?
Does the directed practice of data analysis problems employed in the course offer a significant advantage in developing skill at scientific reasoning?
Given the emphasis on analytical skills and the resulting deemphasis of factual information, do students still acquire the basic information of cell biology?
What are the effects of the methods used in this course on student attitudes and confidence?
COURSE DESIGN
Zoology 373, Cellular Biology, is a 3-credit hour, semester-long course required of zoology majors at BYU. Three faculty members have shared responsibility for teaching the course, in some cases in a team-taught format. Usually, one or two student teaching assistants also participate. The course is offered three times each year to a total of approximately 350 students (120–150 are enrolled in single sections fall and winter and about 50 in the summer term). A class typically consists of 20% juniors and 80% seniors. An outline of the topics covered in the course is presented in Appendix A. No laboratory is included in the course, but a separate one-credit lab is available to supplement a series of three courses (cellular biology, molecular biology, and genetics).
Course Objectives
The primary focus of the course is to assist students to acquire and strengthen the skill of correctly interpreting data generated from experimental research in cellular biology. This is accomplished in the context of investigating the conceptual principles that inform various topics (membrane transport, signal transduction, etc.). At the end of the course, successful students should be able (1) to attend a research seminar on a topic in cellular biology, follow the presentation, and understand the speaker's arguments and conclusions; and (2) to read a published review or update report, designed for a general biology audience, with a similar degree of comprehension.
Assessment
Student performance during the course is assessed through one final and four midterm examinations. Midterm exams contain three data analysis problems and three conceptual problems, each worth the same number of points (15 in our scheme). Each data analysis problem consists of a paragraph describing an experiment related to one or more of the topics covered on the exam. The paragraph is accompanied by graphical and/or tabular representations of the data. Two versions of the problems have been tested. In “constructed response” versions, students are required to construct a series of one-sentence conclusion statements supported by those data (example shown in Fig. 1). In “selected response” versions, students choose correct interpretations from a list, allowing machine scoring (Appendix B). Both versions are equally effective at discriminating student abilities, as judged by score distributions, but we have preferred the constructed response versions requiring students to generate rather than select answers. The conceptual problems ask students to create a visual model or other description that reflects understanding of basic cellular processes discussed in the course. For example, a student might be requested to diagram the secretory pathway that explains the mechanisms involved in targeting proteins to various compartments.
A class with a large enrollment will almost certainly require several raters (graders). We have found that both graduate and undergraduate students can perform this task effectively for our course. However, the raters are frequently unable to score all the exams in a single session. Our scoring rubrics are therefore designed to reduce the potential errors associated with multiple raters and sessions. Conceptual problems are scored by dividing the expected response into 15 defined elements. Student scores reflect the number of elements correctly included in each answer. Deriving reliable scores is more challenging for the data analysis problems. The answer key for each problem generally includes three or four conclusions (at a minimum) expected of students who understand the problem. One point is awarded for each conclusion for which the student makes a minimal attempt, even if misguided, to interpret the data that would have produced that conclusion. Two points are awarded for the conclusion if the response merely restates the data. Three to five points (depending on the number and relative difficulty of the conclusions) is given for the conclusion if the student reaches a true interpretation, with the highest marks going to conclusion statements that are fully accurate and complete. Raters are instructed in the grading protocol during training sessions conducted by faculty members that include practice, with feedback, on several actual exams.
The final exams are comprehensive and include problems covering a larger scope than those used in midterm exams, but with similar formats. All exams are administered in the university testing center with no time limit imposed. Exam results and feedback on performance are shared liberally with students, but copies of the exam are not permanently returned. To avoid biases in student performance due to instructor personality, we used data mostly from semesters in which the course was team-taught. In a few cases, data were pooled from several semesters to average performance from sections taught by different instructors.
Didactic Methods
Use of Text. The texts used have been Alberts et al., Molecular Biology of the Cell, 3rd ed., and, more recently, Lodish et al. (2000) Molecular Cell Biology, 4th ed. Students are expected to come to each class period having spent about 1 hr reading selected textbook pages focused on the fundamentals of the target subject. The course philosophy is that students should assume the primary responsibility to acquire the basic facts (vocabulary, names and biochemistry of relevant molecules, overall mechanistic features of processes, etc.) rather than relying on lecture from the instructor. Instead, some class time is spent providing clarification and correction.
Figure 1. Example of a data analysis problem.
We provide an extensive supplementary packet, a topic outline, containing annotations for each reading assignment. An example for the topic addressing regulation of the cell cycle is shown in Appendix C. Students are encouraged to derive a “big picture” summary as they focus on concepts that have the highest priority and decide which details need not be committed to memory. Interestingly, students tend to be intimidated by figures and diagrams and forgo carefully studying them in favor of following the text explanations. In contrast, we instruct students, if time-limited, first to focus their attention on the figures. A self-corrected quiz (with answers) covering the reading assignment is included in the topic outline. The intent is to encourage students to obtain feedback and self-assess their understanding before they meet a graded assessment by their teacher.
Class Period Agenda. A 5-min, graded quiz is administered at the beginning of each class period or on-line during a 24-h window before the period begins. The quiz usually consists of three to five items of fact to recall from the assigned reading and one or two “milestone” questions designed to test comprehension of a fundamental conceptual issue from a previous topic. An example relative to the regulation of protein function is presented in Appendix D.
The remaining 45 min of the class period is divided into alternate segments of instructor presentation and application exercises in which students work cooperatively to solve problems and practice data analysis. In the former, the teacher's role is to assist students to develop an accurate conceptual framework for the subject at hand (e.g., providing historical background for the experiments, presenting classical data not reported in the text, clarifying difficult concepts, and correcting misconceptions). We minimize lecturing and, instead, involve students in these presentations through Socratic dialogue or small-group discussions. A common didactic strategy is to require students to draw simple diagrams illustrating their understanding of concepts.
More than half of each class period involves group practice (two to four) in solving Application Exercises—analytical problems printed in the topic outline (similar to the ones used in exams; see Figure 1). In general, the task is to interpret the data and reach appropriate conclusions. As supporting activities, students are frequently required to explicitly identify the question asked by the researchers, draw flow diagrams that illustrate the salient details of the experimental design and protocol employed, or state in their own words a description of the experimental results. During this time, instructors and teaching assistants roam the classroom and participate in various individual groups by asking and answering questions. The didactic principle is to engage every student in active communication.
After Class. Additional problems comparable to the application exercises are provided for practice outside the classroom. Solutions to the majority of these problems are made available for student review, and the responses to a selected few are collected periodically and graded.
Additional assistance from the faculty is provided in formal weekly mentoring sessions with 20–30 students. Most of each hour is spent practicing data analysis with more individual attention than can be provided in class. We are therefore able to diagnose particular weaknesses and offer customized suggestions. Furthermore, these sessions promote a collegial spirit that, anecdotally, has appeared to improve class morale. Although the time required may seem excessive, we find that 3–4 h per week providing this kind of help is more productive than the same amount of time spent with fewer students during conventional office hours.
RESULTS
Reliability of Scores on Data Analysis Problems
The prerequisite for assessing student performance in this course was to establish the reliability of our scoring procedure. We used generalizability theory for this purpose (Cronbach et al., 1972). In our first analysis, we employed a fully crossed, two-facet design with raters as the first facet (source of measurement error) and rating occasion as the second. We had two raters score a single problem on two independent occasions and used the software program GENOVA (Crick and Brennan, 1982) to compute the variance components. As shown in the first half of Table 1, the majority of the variation in scores depended on the student that wrote the response rather than on the rater or the grading occasion. The results of this pilot study indicated that the scores were stable across rating occasions (i.e., the variability in the scores that could be attributed to differences in rating occasion was negligible). Because our primary concern was the ability to generalize across problems, our second step was to analyze the scores generated by three raters, each rating three problems on one rating occasion. This resulted in a two-facet, rater-by-problem design. As shown in Figure 2, increasing the number of problems improved the reliability of scoring substantially. The second half of Table 1 demonstrates that when using multiple problems, 86.2% of the variability among scores represented the two factors of interest for evaluating student performance (i.e., overall student ability, 69.9%, and relative difficulty of the individual problems for each student, 16.3%). Both Figure 2 and Table 1 verify the observation that the number of raters used to score the problems was of minor consequence.
| Source of variability | Estimated variance component | Percentage of total variability |
|---|---|---|
| Single problem | ||
| Student | 19.91 | 79.2 |
| Rater | 0.26 | 1.0 |
| Occasion | 0.00 | 0.0 |
| S × R | 0.14 | 0.6 |
| S × O | 0.00 | 0.0 |
| R × O | 0.46 | 1.8 |
| Residual | 4.37 | 17.4 |
| Total | 25.15 | 100.0 |
| Multiple problems | ||
| Student | 169.97 | 69.9 |
| Rater | 6.36 | 2.6 |
| Problem | 23.91 | 9.8 |
| S × R | 0.00 | 0.0 |
| S × P | 39.58 | 16.3 |
| R × P | 0.07 | 0.0 |
| Residual | 3.34 | 1.4 |
| Total | 243.23 | 100.0 |
Improvement in Student Ability to Draw Conclusions from Experimental Data
A general assessment of student performance in formulating conclusions from experimental data was obtained by use of a pre- and posttest containing three data analysis problems (comparable to the problem shown in Figure 1). The pretest was administered during the first week of the course as part of a homework assignment. Students were instructed to answer the problems without using any resources other than their own efforts. They signed a statement on the cover page of the assignment indicating that they had complied with that expectation. Points were awarded toward the final grade as an incentive to complete the assignment, but neither feedback on performance nor answers were provided to students. For the posttest, the same problems were administered again as part of midterm or final exams near the end of the course (i.e., at least three fourths of the course completed).
The overall nature of the responses to the pretest problems suggested that the students took the assignment seriously and made an honest effort to answer correctly. Those few that did not attempt any of the problems were excluded from the study to avoid bias. Of the 271 persons included in the data set, 33 did not attempt an answer to all three problems. Of the 45 total problems left unanswered (i.e., 5.5% of 813 total problems), 67% contained a remark such as“ I don't understand,” “I'm not sure,” or “I'm unable to answer.” Table 2 demonstrates that there was substantial improvement in performance on each of the problems. The total scores at the end of the semester were more than double those at the beginning (65% of total points compared to 27%).
| Pretest | Posttest | |||||
|---|---|---|---|---|---|---|
| Problem | Mean raw score | (%) | Mean raw score | (%) | ||
| Promoter | 2.1 ± 1.9 | (17.5) | 7.3 ± 3.1 | (60.8) | ||
| Secretion | 3.5 ± 2.1 | (43.8) | 6.0 ± 1.8 | (75.0) | ||
| Chromatin | 1.2 ± 0.1 | (24.0) | 3.1 ± 1.6 | (62.0) | ||
| Total | 6.8 ± 3.6 | (27.2) | 16.3 ± 5.2 | (65.2) | ||
Figure 2. Generalizability theory analysis. The projected generalizability (reliability) coefficients that would likely result from increasing or decreasing the number of raters or the number of problems administered, using the fully crossed design in which every rater rates every student. The coefficient is an estimate of the precision of the observed scores when sources of variation not due to student ability are eliminated (observed score/true score).
These data, however, cannot distinguish whether elevated scores on the posttest were due to improvement in student analytical skills or simply acquisition of relevant background information. In any course, one expects that students will know more information at the end of the term than they did at the outset. When trying to teach students to think better, one must expand the assessment question beyond asking whether they acquire the basic information to whether they improve in their ability to use that information in a meaningful cognitive process. The former is easy to address; the latter requires assessing performance independent of knowledge acquisition. For the purposes of this study, “improvement” is defined as increased ability to think scientifically. To investigate improvement in these terms, we sought additional means of assessing changes in performance that would factor out the influence of background information. Accordingly, we compared progress in student performance among course midterm examinations, where the facts and concepts pertinent to the data analysis problems were provided during the period immediately preceding the exam. Students' ability to solve data analysis problems on the midterm exams thus should depend only on progress achieved during the course.
A factor complicating this assessment is that not all exam problems that assess cognitive skills are equally difficult, despite instructor efforts to the contrary. This dilemma can be addressed by using Item Response Theory to estimate exam difficulty independent of student ability (Bond and Fox, 2000). We applied this theory to our midterm exam data using a Rasch analysis (Embretson and Reise, 2000), a complex iterative calculation requiring computer technology that has proven increasingly useful in the field of educational measurement. We refer readers to the cited references for more detailed information. The nature of the analysis required two adjustments to exam scores (for analytical purposes only and not for assigning course grades). The first adjustment was to score student responses dichotomously (i.e., completely correct or completely wrong). Rather than treat entire problems (each one sixth of the exam) in this fashion, we divided each problem into segments (individual conclusions in data analysis problems and discrete parts of the answer in conceptual problems) and scored those segments dichotomously. Second, Rasch analysis automatically and necessarily excludes all students that answered either all or none of the segments on an exam correctly (even though those students would have received partial credit in the scoring system used for assigning grades). These scores are excluded because they are outside the range of competencies assessed by the exam and therefore cannot be distinguished from infinite ability or infinite incompetence.
Table 3 displays the estimated difficulty of the first and last midterm exams for conceptual and data analysis problems. The conceptual problems were easier on the last exam compared to the first (i.e., a more negative score on the logit scale; see note to Table 3). In contrast, the data analysis problems were more difficult.
| Problem type | Exam 1 | Exam 4 | Difference |
|---|---|---|---|
| Conceptual | |||
| Exam difficulty | -0.16 | -0.38 | -0.22 |
| Ability estimate | 0.54 ± 1.04 | 0.66 ± 1.21 | 0.12* |
| Mean raw score (%) | 31.1 (69.1%) | 33.9 (75.3%) | 6.2% |
| Data analysis | |||
| Exam difficulty | -0.43 | 0.25 | 0.68 |
| Ability estimate | -0.43 ± 1.16 | -0.30 ± 1.04 | 0.13† |
| Mean raw score (%) | 28.0 (62.2%) | 29.1 (64.7%) | 2.5% |
Rasch analysis also provides an estimate of student abilities calibrated by exam difficulties. The analysis suggested that student abilities increased similarly for both types of problems (Table 3). Due to the large range of student abilities and the relatively small improvement, this change was significant only at about the 90% confidence level (p = .12 for data analysis problems and p = .10 for conceptual problems). Nevertheless, we considered these estimates to be preliminary, because they did not represent the entire class or the full range of partial credit present in the original raw scores (due to the required exclusions and dichotomous scoring described above). Accordingly, we completed our analysis by applying the exam difficulty data (Table 3) to interpret distributions of the raw exam scores used for grading in the course. For both data analysis and conceptual problems, the average raw score increased from the first to the last exam (Figure 3). The larger apparent increment for the conceptual problems may be explained by the fact that on the last exam those problems were easier (Table 3). Conversely, the small improvement in average raw scores on data analysis problems is magnified by the fact that these problems were more difficult. The shapes of the distributions also support these conclusions because, in both cases, the distribution became more skewed toward improved performance (see skewness numbers in the legend to Fig. 3). This finding supports the preliminary argument from the Rasch analysis that student analytical ability increased.
One advantage of Rasch scaling is that student abilities and exam difficulties are calibrated on the same scale. Thus, we note that for the conceptual problems, student abilities were higher on the average than were the item difficulties (Table 3). In contrast, the opposite relationship was observed for data analysis problems, suggesting that the analysis problems presented a significantly greater challenge for all students in the class (Table 3).
We next addressed the issue of whether the observed improvement in student performance was the result of a systematic impact on the class, one that could be attributed to course design and pedagogy. To explore this question, we devised a method (termed “student mobility profile”) to visualize changes in relative student performance between the first and last exams. The following describes the logic upon which this method is based.
Relative changes in student performance are first quantified by calculating standard Z-scores (displacement from class mean normalized to class standard deviation). Improvement relative to the class average is demonstrated by an increase in one's Z-score. Therefore, if every student performs the same relative to the class mean and standard deviation on both the first and the last midterms, the change in Z-score will be zero for all students, even if the class mean is different for the two exams. If, however, one student improves from the bottom of the class to the top, that student's Z-score would increase greatly. The Z-scores for the remainder of the students would diminish slightly, not because their performance declined, but because they did not improve as did the one student. If several students improve, they will improve by different amounts if the distribution of their abilities is random. In this case, a graph of increments of change in Z-score (abscissa) versus percentage of class showing improvement greater than each increment (ordinate) would reveal an exponential decay (Figure 4). That is, many students will improve by at least a small amount, but as larger increments are considered, the number of students achieving at least that level of improvement will decrease. When the entire class is considered, some students improve, some remain the same, and some decline in performance between the two exams. Thus, a plot of the entire class results in two exponential decays, one on the positive side and one on the negative (Figure 4). The intercept of the ordinate on the positive side represents the sum of all students for whom the change in Z-score was ≥0. The intercept of the ordinate approached from the negative side represents the sum of all students for whom the change in Z-score was <0. Therefore, the sum of the two intercepts will equal the total number of students in the class. The shape of the decay is determined by the average increment of improvement (or decline). When large improvements (or declines) are very rare, the curve will be sharp. A broad curve results when many students improve (or decline) by a large amount. We define the minimum degree of change exhibited by one half of the students on either side of the graph as a “mobility coefficient.” Thus, two mobility coefficients are generated per class, one on the positive side and one on the negative. The mobility coefficient is analogous to a half-life. Because the number of students in the class is fixed, a change in the mobility coefficient on one side of the graph relative to the other will require reciprocal changes in the intercepts (see cases 2 and 3 in Figure 4).
Figure 3. Exam distributions of conceptual and data analysis tasks comparing first and last midterm exams. Data were obtained from winter and fall semesters, 2000 (n = 274). (A) conceptual problems from first midterm exam; skewness value = –0.652. (B) Data analysis problems from the first midterm exam; skewness value = –0.282. (C) Conceptual problems from the last midterm exam; skewness value = –1.256. (D) Data analysis problems from the last midterm exam; skewness value = -0.504.
If the probability of either improvement or decline in Z-score is the same for each student, the curves in the positive and negative directions will be symmetrical, giving identical intercepts and mobility coefficients for both sides of the graph. This condition is labeled “case 1” in Figure 4. Functionally, it represents a class in which improvement or deterioration is determined by random events that affect each student independently (e.g., changes in motivation, health, employment, and financial status). Alternatively, a negative pressure applied generally to the class (e.g., teacher neglect, general decline in class morale), would make it more likely that students would decline than improve. This asymmetry has two effects on the class. First, the average size of decrements in performance will be greater than the average size of improvements. Second, because the class mean will be lower on the second exam than it would have been without the negative pressure, the Z-scores of some students will be raised by a small amount even though their performance did not really improve. The graphical consequence of these effects is an asymmetry in the mobility profile. The mobility coefficient will be greater on the negative side than on the positive, but the intercept will be greater on the positive side. We have defined this scenario“ case 2.” Case 3 is the converse of case 2, in which a positive force on the class raises the probability of improvement higher than would have been achieved through random effects. Although the mobility profile does not address the issue of whether the total class performance improved during the semester (because Z-scores are normalized to class average), it does identify whether changes in performance were the result of random (case 1) or systematic effects (cases 2 or 3). An important advantage of the mobility profile analysis is that it applies to intrinsic properties of a course. Different courses can therefore be compared even though they focus on different topics and/or administer different exams.
Figure 4. Theoretical simulations of student mobility profile results for three specific cases. Data represent the number of students displaying at least the given increments of change in Z-score values between the first and the last exams. See text for explanations of the three cases.
Figure 5A applies this approach to student performance on one semester's data analysis problems. As predicted, the number of students both with improved and with diminished Z-scores decayed exponentially over increasing increments of change. We fit the data to a first-order exponential decay and computed the mobility coefficient and the intercept. The asymmetrical shapes of the positive and negative curves in Figure 5A are consistent with the pattern of case 3, suggesting that a systematic pressure promoting improvement of skills occurred in the course. Data from several semesters are summarized in Figure 5, C and D. The results supporting case 3 for data analysis problems were reproducible, i.e., the mobility coefficient was greater on the positive side of the profile (Figure 5C), and the intercept was greater on the negative side (Figure 5D). The conceptual problems serve as an internal control, since our efforts focused much less on helping students improve their skills in memorizing conceptual information. Indeed, consistent with case 1, no difference between the positive and the negative sides of the profile were observed for either the mobility coefficient or the intercept (Figure 5, C and D).
Figure 5 also contains similar data for a course in which memorization of facts is the primary objective (human anatomy; Figure 5B). This course served as an external control since there was no systematic attempt by instructors to enhance the ability of students to perform the memorization task. Changes in relative performance would therefore be expected to result entirely from random effects (i.e., case 1). As shown in the figure, this prediction was confirmed and reproducible over multiple semesters.
Comparison to a Course Not Offering Practice in Data Analysis
Students in our course and those in a separate cell biology course taught at the same curricular level were administered data analysis problems. Specifically, these problems used data from a study on expression of the globin gene (Kadonaga and Tjian, 1986) and from work on the interaction of growth hormone and EGF receptor tyrosine kinase systems (Yamauchi et al., 1997). Both courses cover the information on gene regulation and signal transduction necessary to understand the background for the problems. The second course was taught with the majority of class time spent with lecture presentation of information by the instructor including multiple elaborate visual images. The primary objective was to convey a state-of-the-art description of cellular mechanisms and processes. Consequently, students in this second course were not given directed practice in data interpretation tasks. Nevertheless, the text used for this second course contains a detailed description of the original experiment and data upon which the globin problem was based (Cooper, 2000, pp. 244–247). This description was part of the required reading assignment for students in that course. Table 4 demonstrates that performance on this problem was significantly higher for the group that practiced data analysis tasks. The same was true for the problem on receptor tyrosine kinases (Table 4).
| Mean raw score ± SD (%) | |||
|---|---|---|---|
| Primary course objective | EGF signaling | Globin gene transactivation | |
| Acquire information | 6.3 ± 3.4 (42.0%) | 6.5 ± 3.0 (43.3%) | |
| Acquire data analysis skill | 9.4 ± 3.7 (62.7%) | 8.9 ± 3.8 (59.3%) | |
Effect of Data Analysis Practice on Acquisition of the Basic Concepts of Cell Biology
This question was addressed by administering two exams covering the same subjects (equilibrium and free energy, allosteric and covalent regulation of protein function, protein turnover, antibodies, membrane structure, membrane transport, and membrane potential). The first exam was a scheduled midterm in the course focusing on data analysis problems as described under COURSE DESIGN. Student preparation was the same as that typically employed in the course, with emphasis on data analysis skills. The second exam focused entirely on recall of factual information and was administered one week later as a surprise exercise with no additional preparation or return to the subject matter.
Figure 5. Student mobility profile analysis of student performance in data analysis and conceptual problems in the cell biology course compared to a human anatomy course. Student mobility profiles between first and last exams were calculated for data analysis problems (A; winter 2001; n = 84) or the anatomy course (B; fall 1999; n = 540) as explained in the text. (C) Difference in mobility coefficient (positive side minus negative side) was calculated for five semesters of data analysis problems from the cell biology course (fall 1999 through winter 2002; n = 70–148), three semesters of conceptual problems from our course (winter 2000 through winter 2002; n 70–148), and three semesters from the anatomy course (winter 1999 through fall 2000; n = 403–657). A dependent sample t-test (two-tailed) was used to compare improve and decline mobility coefficient values. Data analysis: p = .04*. Conceptual: p = .40. Anatomy: p = .94. (D) Difference in the y-intercept value (positive side minus negative side) was calculated for the same semesters as in C. Data analysis: p = .03*. Conceptual: p = .33. Anatomy: p = .95.
Distributions of class performance on these two exams are shown in Figure 6. Even though students had not studied specifically for the recall exam, they performed better on it than on the data analysis exam (mean improved by 9%, standard deviation decreased by 6%). The important issue was whether performance on the data analysis exam predicted achievement on the subsequent recall exam. As shown in Figure 6C, a significant relationship between performance on the two exams was demonstrated (p< .0001, r = .6).
Effects on Student Confidence and Attitudes
In assessing confidence, we asked students to rate their ability to study and understand biological information presented in each of a variety of formats (data figures, diagrams and text). As shown in Table 5, ratings in each category increased significantly between the beginning and the end of the course. The mean composite confidence rating improved from 2.16 to 2.74 (p< .0001) during the semester. The trends shown in Table 5 were reproduced when the same survey was used in three subsequent semesters.
| Problem | Pretest | Posttest | Mean difference |
|---|---|---|---|
| 1. Graph | 2.36 ± 0.94 | 2.93 ± 0.95 | 0.57* |
| 2. Figure | 1.86 ± 1.01 | 2.93 ± 0.95 | 1.07* |
| 3. Text figure | 1.79 ± 1.10 | 2.64 ± 1.05 | 0.85* |
| 4. Table | 1.96 ± 0.99 | 2.43 ± 0.99 | 0.48* |
| 5. Text | 2.65 ± 1.01 | 2.92 ± 0.95 | 0.26† |
| 6. Paper | 2.07 ± 1.11 | 2.82 ± 1.05 | 0.75* |
| 7. Paper | 2.42 ± 1.09 | 2.76 ± 0.98 | 0.34* |
| Average | 2.16 ± 0.76 | 2.74 ± 0.79 | 0.58* |
Figure 6. Comparison of student performance on analytical and recall exams. (A) Distribution of student scores on analytical problems that constituted a midterm exam during the winter semester of 1999 (n = 145). (B) Distribution of scores on a recall exam covering the same content and administered unannounced 1 week following the exam illustrated in A (see text for details). (C) Correlation of scores on the analytical and recall exams. Slope = 0.36 + 0.04, p < .0001, r = .6.
To assess attitudes about different learning strategies, students were asked to rate their opinion of the effect of courses emphasizing data analysis and those emphasizing recall of factual information on a series of qualitative benefits and risks. These benefits and risks were later divided into two categories to facilitate interpretation of the results. “Academic features” included questions about general utility and relevance of courses and their ability to provide intellectual stimulation. The“ personal implications” category focused on the effects of courses on student psychological well-being and the achieving of practical goals. Student attitudes regarding academic features were somewhat more positive about courses that focus on analytical reasoning than courses emphasizing recall (5.2 ± 1.2 vs. 4.5 ± 1.0, mean ±SD, p=.0004, by analysis of variance, n = 119, assessed at end of the semester). In contrast, attitudes were more positive about recall-type courses when one considered personal implications (4.6 ± 1.2 vs. 5.2± 0.8, p < .0001, n = 119). In both cases, these attitudes were virtually identical to responses obtained at the beginning of the course.
Specific attitudes about the course were assessed using an anonymous questionnaire at the end of each semester. The responses to selected questions, summarized in Table 6, suggested an interesting dichotomy in reactions to the course. On the one hand, there was a strong expression of support (about 80%, items 1 and 2) for the value of the analytical approach to learning and its personal value in meeting future goals. Nevertheless, many students were not in favor (items 3–5) of repeating the same emphasis or using it in another course. We attribute this apparent contradiction to the rigor required and a sense that the academic background of most students had not included preparation for this approach to education.
Table 6. Selected questions from an anonymous course evaluation completed at the end of our course
DISCUSSION
The first consideration in adopting an approach that emphasizes the acquisition of analytical thinking skills is that there must be a concomitant reduction in breadth and/or depth of subject matter coverage. Even without introducing analytical thinking as a competing course objective, the quantity of potentially important information in cell biology has grown so large that there is no choice but to be selective. We suggest the paradigm “attempt less and accomplish more.” A single example, among the many available, will suffice to illustrate a particular principle. Even the deletion of several topics, albeit interesting ones, will not prevent students from gaining a satisfactory holistic vision of the subject. Several investigators have advocated this same “less is better” philosophy as part of an effort to increase active learning across the university curriculum (Russell et al., 1984; Bonwell and Eison, 1991; AAAS, 1993; Bardeen and Lederman, 1998).
In many traditional classrooms, the teacher as authoritative source presents information and models the language and practice of the discipline for the listening student whose role is primarily passive, usually restricted to making notes. The decision to introduce active problem solving and increase the number and kind of instructor–student and student–student interactions forces a redefinition of the teacher's role. In our system, the learning cycle begins with the students acquiring the fundamental information about a new topic in cell biology through preclass study. Putting students in control of sorting, prioritizing, and assimilating the basic facts is disconcerting to many at first. They have become accustomed to a comfortable rubric in which, during a lecture, the teacher organizes a hierarchy of knowledge and ranks what is most important, and they become uneasy when given full responsibility for these aspects of learning. Our use of annotated reading assignments has seemed very effective at this stage; we are able to focus the students' attention on a smaller, more manageable subset of potential topics. The graded quizzes at the beginning of (or before) each class period provide a strong incentive to come to class prepared. Students know that they can expect the faculty to provide an inquiry-based exercise that will serve to clarify a particular topic, but not remedial explanations of the basics for those who have not done the reading. They also realize that for much of the lecture period they will be in an active working mode that will not permit them to remain silent.
Solving an Application Exercise problem in groups of two to four students is one good way to get them talking. With 50 simultaneous conversations focused on the correct interpretation of the data in a figure, the classroom is a very noisy place. When we inject ourselves into one of these discussions, the goal is to answer a question or offer a discreet hint without robbing the students of the opportunity to solve the mystery for themselves. It can be something of an intellectual epiphany for the person who resists the temptation to resort to getting help from someone else and persists through the process of independent effort to resolve the problem. In this setting, the teacher becomes coach, offering suggestions for improvement in technique.“ So, Mary, can you speculate about the meaning of these data: the level of radioactive protein remains constant in the animals with high substrate levels, while counts in the controls go down?” This also describes the teacher's function in the more intimate and informal confines of the mentoring session with 20–30 persons. Here the interaction may be even more effective because of its more personal nature and the more economical use of time.
Even when our purpose is to introduce a topic or devote some minutes to clarifying a concept (by projecting a figure from the text, for example), we attempt to talk less and let students carry the conversation. They should also learn visual as well as verbal articulation. We continually urge students to construct simple drawings of experimental protocols (e.g., DNA footprinting) or summary diagrams of all the mechanistic elements in a process (transcriptional regulation, for example). The rule of thumb is to get brains actively engaged with visual symbols that can demystify abstractions.
It is not uncommon, near the conclusion of the traditional lecture, for the teacher's invitation to raise questions to be greeted with silence. The best explanation for this lack of response is that at this point in the learning process most students do not yet know what they do or do not understand. Unfortunately, many have not developed a self-assessment strategy that allows ideas to be solidified or misconceptions and omissions to be identified and corrected. The biology teacher has a real opportunity to help correct this deficiency. What is needed is a confrontation between student and teacher that will require the student to demonstrate that understanding really has occurred.
Because students have not yet learned to confront the ideas effectively on their own, we confront them by inviting them to be accountable. In this way, they acquire the skill of self-confrontation and can practice it independently in the future. This is not to suggest a combative, “in your face” scenario, but an interaction with the teacher, in the spirit of helpfulness, that stimulates a student to communicate. Any pedagogical device that helps the learner to articulate an idea ought to be tried. “Tell the person sitting next to you what the question was that this experiment attempted to answer.” “Please come to the board and teach us how a G-protein works.”“Everyone draw a new curve on that figure to represent the result you think will occur under the following new experimental conditions.”
Finally, it is our experience that we are better equipped to offer individuals a meaningful evaluation of their performances following an exam consisting of data analysis problems of the type described in this paper. While more traditional objective exam questions may permit a teacher to diagnose deficits in factual knowledge, we can more readily pinpoint a weakness in an important cognitive skill and prescribe a specific remedy. Common weaknesses include an ability to cite the name of a molecule or process without knowing what it really is or does, having an inadequate overview of a major concept, misunderstanding the conduct or purpose of an experimental methodology, not reading the axes of a set of coordinates correctly, being able to restate an experimental result—“The slope of the line changed when the new reagent was introduced”—without drawing a meaningful conclusion from it. The student benefits from both the requisite preparation before the exam and the feedback afterward.
Proof for the efficacy of commercial instructional materials, touted to improve the educational experience for students, usually takes the form of anecdotal endorsements like, “Highly praised by our test sample of participants!” Such evidence is not compelling. But we would like to have reasonable assurance that the difficult work of course restructuring will result in genuine improvement. Thus we have provided examples of the kinds of empirical evaluations that are appropriate to assess the effectiveness of course objectives, design, didactic strategies, and examinations.
Student Ability to Draw Conclusions from Experimental Data Improves During the Course
Based on the data shown in Tables 2 and 3 and Figure 3, it is clear that students improved during the semester in their ability to answer data analysis problems. Furthermore, the data in Figure 5 suggest that the improvement was systematic and not explainable by the usual random effects of individual circumstances and motivation. Providing empirical documentation that students really do increase in analytical ability has proven to be more subtle and sophisticated than we initially supposed. Moreover, depending on one's point of view, the degree of change our students have achieved in one semester may appear to be modest. We would argue, however, that thinking well is hard work, and as helping others to think well is equally difficult, any progress in this direction should be celebrated.
Directed Practice of Data Analysis Problems Offers a Significant Advantage in Developing Skill at Scientific Reasoning
Performance on data analysis problems was better among students whose course required practice of the requisite skill than among those without such practice (Table 4). This observation does not mean that students in the “acquire information” course did not learn concepts that could be applied to data analysis problems. For example, if we assume that performance on the pretest problems is representative of all students prior to cell biology instruction, we can compare the data in Tables 2 and 4 to consider whether there was some apparent gain in student ability in the “acquire information” course. Indeed, students in the “acquire information” version scored an average of 43% on data analysis problems (Table 4) compared to the average of 27% observed for students not yet exposed to either cell biology course (Table 2). This result suggests that gaining a conceptual understanding permits students to utilize whatever level of inherent analytical skill they possess. Intensive directed practice in data interpretation added significant additional gain. This skill is not acquired serendipitously; the course must be intentionally designed and managed in order for meaningful improvement to take place.
Despite the Emphasis on Analytical Skills and the Resulting De-emphasis on Transmission of Factual Information, Students Still Acquire the Basic Information of Cell Biology
The data in Table 3 and in Figures 3 and 6 demonstrate that our students performed well when tested on their recall of factual/conceptual information. In fact, our experience suggests that students assimilate the basic facts of the subject better in an experimental context, while practicing data analysis, than they would if the facts were presented descriptively in a traditional lecture format. Certainly, extensive research has validated the idea that deep and well-retained learning require active practice (National Research Council, 2000). Importantly, the typical element of intense study immediately prior to the exam was absent in the exercise illustrated in Fig. 6B. Thus, one might argue that not only is there no risk to teaching in this manner, but there may be a long-term benefit with respect to information retention. In support of this interpretation, students who performed better on the data analysis exam tended to perform better on the recall exam (Figure 6C).
These Methods Have Varying Effects on Student Attitudes and Confidence
One of the challenges of restructuring a course is maintaining positive student attitudes. Students often find that our course does not match their expectations; the focus on scientific reasoning is unfamiliar and difficult for most of them. Some argue that analytical skill is a genetic legacy that should not be graded; “Unfairly, this kind of an exam tests I.Q., and doesn't reflect the effort I made in preparation.” While it is probably true that a small number of students come to our course with a strong native aptitude for analysis, the data summarized in Tables 2 and 4 convince us that few solve these kind of problems readily and that most individuals, even the most gifted, make substantial progress. Furthermore, there is clear evidence (Table 5) that the course promotes confidence in dealing with biological information (text, graphical, diagrammatic). We note, however, that our assessment reveals a contradictory set of affective responses to the course experience (Table 6). Nearly all of our students endorse the benefitof improved reasoning, but the rigorous exams that require new skills (which most prior courses have not helped to develop) generate some feelings of frustration and resentment. There is, of course, some concern about the impact of grades on personal goals such as acceptance into postgraduate programs. Teachers should not adopt these sorts of methods believing that all students will be pleased or converted.
Notwithstanding student frustrations with the rigor and novelty of the approach, instructor enthusiasm, charisma, and willingness to give personal help can do much to alleviate these apprehensions. Nevertheless, there is a limit to what students can accomplish in a single semester. We have frequently heard this concern: “Why haven't we been exposed to this kind of learning earlier?” This suggests that the next level of reform for teachers who value these analytical skills is curricular. It may be necessary for departmental or even campus-wide groups of faculty to redesign entire programs with the view of an early introduction of instruction that systematically promotes skill in scientific reasoning.
APPENDIX A
|
APPENDIX B
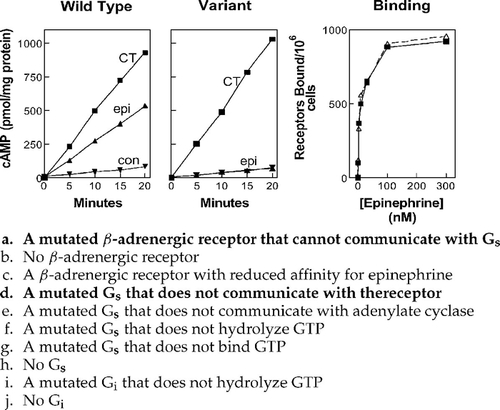
SAMPLE DATA ANALYSIS PROBLEM (SELECTED RESPONSE FORMAT)
A cell line commonly used for studies of adenylyl cyclase is the S49 lymphoma cell. Genetic variants of the cell exist with mutations of certain components of the system. The wild-type form of the cell has receptors for the hormones epinephrine and somatostatin. The following graphs illustrate measurements made with membranes from a sample of a certain variant of S49 lymphoma cells. The data in the left graph represent wild-type cells incubated with only GTP (con), with epinephrine and GTP (epi), or with 1-h prior treatment with cholera toxin, GTP, and NAD+ (CT). At time 0 on the graph, radioactive ATP was added to start the assay. The center graph is a repeat of the same experiment with the variant cell. The graph displays the binding of radioactive epinephrine to wild-type (solid squares) and variant cells (triangles).
Based on these data what mutation(s) is(are) possible in the variant cells?
A mutated β-adrenergic receptor that cannot communicate with Gs
No β-adrenergic receptor
A β-adrenergic receptor with reduced affinity for epinephrine
A mutated Gs that does not communicate with thereceptor
A mutated Gs that does not communicate with adenylate cyclase
A mutated Gs that does not hydrolyze GTP
A mutated Gs that does not bind GTP
No Gs
A mutated Gi that does not hydrolyze GTP
No Gi
APPENDIX C
SAMPLE ANNOTATED READING ASSIGNMENT: CELL CYCLE CONTROL—MPF
I. Learning from the Text
A. Before-class assignment: pp. 863–879
The information in Figures 17–2 (chromosomal progression in mitosis) and 17–3 (phases of the cell cycle) is basic—a review of concepts from earlier courses.
Study Figures 17–7 and 17–9 carefully. They suggest a rationale for why the cell cycle needs to be controlled. The operation of checkpoints will be addressed in Topic 28.
A conceptual model of cell cycle control at the molecular level is presented in Figure 17–11. Be sure to master these principles. The order in which it is presented in the text is strange, however. We suggest that you read pages 870–877 first, then return to pages 869–870.
Beginning on page 872, there is a presentation of some of the now classic experiments that demonstrated biochemical aspects of cell cycle regulation. Figures 17–15, 17–16, and 17–19 contain descriptions of studies whose results you must be able to understand and describe accurately.
APPENDIX D
SAMPLE IN-CLASS GRADED READING QUIZ: REGULATION OF PROTEIN FUNCTION
Every protein kinase has two substrates. One of these is the protein that is going to be phosphorylated. What is the other? ATP
What is the role of a protein phosphatase? To remove phosphate from a protein
Regulation of protein conformation through binding of a ligand to a site other than the active site is called allosterism.
A proteasome is composed of what kind of enzymes? Proteolytic
What is the specific function of ubiquitin (one phrase or sentence only)? Mark proteins for degradation
[Milestone Question] Suppose that an experimental drug that inhibits enzyme A is being tested to determine its mechanism of action. Several concentrations of substrate are incubated with enzyme A, with and without the drug. In one or two sentences, explain the salient features of the results that would be expected if the inhibition is competitive. There would be an apparent reduction in affinity in the presence of the inhibitor (curve shifted to the right), but the maximum activity would be the same (same saturation level).
FOOTNOTES
Monitoring Editor: Mary Lee S. Ledbetter
ACKNOWLEDGMENTS
This work was funded by the United States Department of Education, Grant P116B980586, under the auspices of The Comprehensive Program of the Fund for the Improvement of Postsecondary Education (FIPSE). We acknowledge Kennon Smith for assistance with the Rasch analysis and the capable efforts of Jennetta Hammond, Matthew McClelland, Steven Swenson, Nephi Thompson, and Emily Updegraff in the grading of student examinations.