Public Access for Teaching Genomics, Proteomics, and Bioinformatics
Abstract
When the human genome project was conceived, its leaders wanted all researchers to have equal access to the data and associated research tools. Their vision of equal access provides an unprecedented teaching opportunity. Teachers and students have free access to the same databases that researchers are using. Furthermore, the recent movement to deliver scientific publications freely has presented a second source of current information for teaching. I have developed a genomics course that incorporates many of the public-domain databases, research tools, and peer-reviewed journals. These online resources provide students with exciting entree into the new fields of genomics, proteomics, and bioinformatics. In this essay, I outline how these fields are especially well suited for inclusion in the undergraduate curriculum. Assessment data indicate that my students were able to utilize online information to achieve the educational goals of the course and that the experience positively influenced their perceptions of how they might contribute to biology.
INTRODUCTION
Faculty and students alike rely upon the Internet to communicate and to learn new information. Faculty who primarily conduct research frequently access online tools found at the National Center for Biotechnology Information (NCBI). Faculty who primarily teach also rely upon NCBI to conduct literature searches and find other biological information. Students often search for information using Web search engines such as Google.com, but biological information is accumulating so rapidly that students will need to know how to access DNA-centered online resources if they are to be literate in modern biology.
One reason for the increased need to access information is the impact that molecular approaches are having on all areas of biology. Molecular tools have integrated areas within biology previously considered distinct, such as biochemistry, ecology, genetics, and behavior. Biologists working in such different areas within biology now use overlapping information for different applications. With the advent of genomics and its allied fields of proteomics and bioinformatics, integrating information across many subdisciplines of biology is becoming increasingly important for research and teaching. Furthermore, many leaders in genomics, proteomics, and bioinformatics (referred to simply as genomics in this essay) are emphatic about the need to provide free access to data and to electronic research tools. This confluence of needs for information and interdisciplinary learning have led to a unique time in biology education.
Most faculty lack formal training in genomics, but students are eager to learn about genomics and its impact. Faculty are quickly learning to incorporate various aspects of genomics into their curriculum, either by developing new genomics courses or by incorporating bits and pieces of data into existing courses. New editions of textbooks in many areas of biology are including genomic information. However, the field of genomics is more than a compilation of lessons learned. Genomics is a dynamic body of information that can be searched and explored by anyone with Internet access. By accessing online resources, teachers can bring more of the dynamic nature of genomics to students. I have developed a genomics course that I have taught twice (Fall semesters 2001 and 2002; Campbell and Heyer, 2003). This essay outlines some of the online resources my students used to discover genomics by actively exploring freely available research-quality data using bioinformatics tools (Figure 1).
Figure 1. A student using the Internet to access an online database and interpret information. Students are given open-ended assignments that require them to mine data from dynamic Web sites.
TRADITIONS OF INNOVATION
Faculty constantly devise clever and inexpensive strategies for improving undergraduate education. One of the early and consistent American organizations providing innovative materials was BioQuest, which persistently pursues the Ps of education: Problem Posing, Problem Solving and Peer Persuasion ( www.bioquest.org). Spearheaded by John Jungck at Beloit College, BioQuest has established a solid track record for using real data in conjunction with a case-based approach to accomplish common pedagogical goals of learning, problem solving, technical training, and increasing motivation. The BioQuest modules must be purchased and do not function on all computer platforms. Despite these barriers, the fundamental principles established by BioQuest are worthy of emulation.
Since 1989, Project Kaleidoscope (PKAL; www.pkal.org) has fostered dissemination of teaching innovations that work. Recognizing that science, technology, engineering, and mathematics (STEM) faculty at large and small campuses have made substantial strides in improving education, PKAL has run workshops and written white papers describing what is required to foster change, institutionalize reform, and create educational leaders for the future (PKAL, 2003a). Collaboration is critical to successful education enhancements (PKAL, 2003b). Genomics offers STEM faculty new opportunities to establish collaborations in research and teaching. The integration of research and teaching was recently praised by Tom Cech (2003), President of the Howard Hughes Medical Institute (HHMI), an organization that funds educational reform efforts at many levels.
A SYSTEMS APPROACH TO TEACHING
“Systems biology” is a recently coined term that describes two recent changes. The first change is a recognition of the problem-solving power resulting from integration of large data sets from a wide array of sources. For example, to understand how a species responds to a changing environment, a systems biologist wants to know the reference (or archetype) genome sequence, genomic variations within the population, gene expression patterns, protein expression patterns, protein interactions, and genomic circuitry that governs cellular pathways and metabolic fluctuations in the organism. In short, systems biology attempts to understand the cellular ecology rather than individual parts studied in isolation. The second change is a resurgence of discovery-based research. Traditionally, biologists conduct hypothesis-driven research, but systematic observation can lead to discoveries and subsequent hypothesis testing.
These two changes, integration of information and utilization of discovery science, are also influencing the way biology is taught. Many departments and curricula are described by old names that have lost much of their meaning: biochemistry, genetics, cell biology. Today, cell biologists use genetics, geneticists use biochemistry, and biochemists use cell biology. Discovery science is fostering a spirit of “discovery education,” where students are encouraged to develop insights through interpretation of data (Figure 2). These types of student-based discoveries are at the heart of successful learning promoted by BioQuest and PKAL.
Ideally, faculty want biology students to grow beyond memorization and other entry levels of cognition (Bloom et al., 1956). In particular, students should develop thinking skills that improve comprehension, application, analysis, synthesis, and evaluation (Uno, 1998; Allen and Tanner, 2002; Sundberg 2002). Genomics is ideal for designing challenges that will assist students in achieving these more involved cognitive capabilities. Publically accessible databases and publications contain information that students can mine to make their own discoveries.
TOOLS FOR A SYSTEMS APPROACH TO TEACHING
DNA sequences, gene annotations, protein structures, protein interaction data, gene expression profiles, genomic variations, and biomedical publications are freely available online (Table 1). These databases are used regularly by researchers, and students can learn to use them in their course work. For example, my genomics students learned to query databases; this allowed me to write test questions that required them to mine these databases. The use of dynamic databases has produced some awkward moments for me in class, when a particular query produced different outcomes between the time I prepared for lecture and when I taught the class. However, this moment of classroom discomfort is part of the excitement for students when they realize that their course work includes rapidly changing information. In 2002, I incorporated a fly DNA microarray paper (Arbeitman et al., 2002) into my genomics course a few weeks after it was published. I used many of the paper's figures to write test questions. The authors had created an independent and free database that students can use to explore data summarized in the paper (Figure 3). Public databases permit students to conduct discovery research in their courses and provide opportunities for faculty to integrate their research and teaching. Furthermore, students are learning valuable cognitive skills that will prepare them for jobs and graduate training.
| Resource | Description | Web address |
|---|---|---|
| GenBank | Searchable database of protein and DNA sequences, based in the U.S. | http://www.ncbi.nlm.nih.gov/Genbank/index.html |
| Human Genome Browser | Visual way to examine chromosomal segments of varying sizes. Sequence information is available, as are other annotations and genome comparisons. | http://genome.ucsc.edu/cgibin/hgGateway?org=human |
| Ensembl | European repository for many genome projects. Very user-friendly and good graphic displays. | http://www.ensembl.org/ |
| Function Junction | A convenient site to learn functional information about yeast genes and ORFs. | http://genome-www4.stanford.edu/cgi-bin/SGD/functionJunction |
| GeneOntology | A consortium that is unifying terminology used to describe genes and their cellular roles in all species. | http://www.geneontology.org/ |
| MIPS | Searchable database of the molecular structure and functional network of Saccharomyces cerevisiae. | http://mips.gsf.de/proj/yeast/CYGD/db/index.html |
| ExPASy (Expert Protein Analysis System) | Proteomics database hosted by the Swiss Institute of Bioinformatics with information about protein sequences, structures and 2-D PAGE. | http://us.expasy.org/ |
| Protein Data Bank | Respository of all protein structures that is searchable by protein names and key words. | http://www.rcsb.org/pdb/ |
| CATH Protein Structure Classification | Hierarchical classification of protein domain structures that clusters proteins at four major levels, class (C), architecture (A), topology (T), and homologous superfamily (H). | http://www.biochem.ucl.ac.uk/bsm/cath_new/index.html |
| DIP: Database of Interacting Proteins | Searchable database that shows protein—protein interactions based on experimental and computational information. | http://dip.doe-mbi.ucla.edu/ |
| PathCalling | Searchable proteome-wide analysis of yeast protein interactions using yeast two-hybrid screens. | http://portal.curagen.com/extpc/com.curagen.portal.servlet.Yeast |
| Osprey | Nice graphical representation of physical and genetic biological interactions; requires special plug-in or can function as a stand-alone program. | http://biodata.mshri.on.ca/osprey/servlet/Index |
| Stanford Microarray Database | Provides raw and normalized data from microarray experiments, their corresponding image files and interfaces for data retrieval, analysis, and visualization. Excellent source for students to explore. | http://genome-www5.stanford.edu/MicroArray/SMD |
| GEO: Gene Expression Omnibus | Gene expression and hybridization array data repository with methods for searching and visualizing results. | http://www.ncbi.nlm.nih.gov/geo/ |
| Expression Connection | Yeast database searches the results of several microarray studies for gene expression data for a given gene or ORF. Source for Figure 6. | http://genome-www4.Stanford.EDU/cgi-bin/SGD/expression/expressionConnection.pl |
| ArrayExpress | Searchable British public repository for microarray-based gene expression data. | http://www.ebi.ac.uk/arrayexpress/ |
| The SNP Consortium | A public/private database containing about 1.8 million SNPs (single nucleotide polymorphisms). | http://snp.cshl.org/ |
| Alternative Splicing ASAP | Searchable database with graphical presentations of alternative splicing. | http://www.bioinformatics.ucla.edu/ASAP/ |
| MHC Haplotype Project | A work in progress that will provide the complete genomic sequences of at least eight different HLA-homozygous typing haplotypes. | http://www.sanger.ac.uk/HGP/Chr6/MHC/ |
| PNAS: Proceedings of the National Academy of Science, USA | Provides free access to all papers 6 months after publication. Same policy used by Science. | http://www.pnas.org/ |
| PubMed Central | U.S. National Library of Medicine's digital archive of life sciences journal literature with free access. | http://www.pubmedcentral.nih.gov/ |
| HighWire Press | Largest repository of free online journals with varying periods of delay before freely available. | http://highwire.stanford.edu/lists/freeart.dtl |
Figure 2. Student using 3D goggles to visualize protein structures. These goggles are the same ones used by research faculty who determine protein structure from X-ray and NMR studies.
With the rapid pace of science publication, it is difficult for faculty to keep up to date in their chosen fields. PubMed ( www.ncbi.nlm.nih.gov/PubMed/) is a productive way to search for key words or authors. A free service called PubCrawler ( www.pubcrawler.ie) can automate PubMed searches and deliver periodic search results to your email inbox. Each week I read the titles, linked abstracts, and free PDF files if the paper appeared in one of the many freely available journals (see PubMed Central for a complete listing; www.pubmedcentral.nih.gov). Many campuses have institutional access to major journals such as Science ( www.sciencemag.org), Nature ( www.nature.com/nature/), and Proceedings of the National Academy of Sciences, USA ( www.pnas.org; PNAS). Molecular Biology of the Cell provides free access within 2 months of publication and Genome Biology, PNAS, and Science provide free access within 6 months of publication. When a particularly significant genomics paper is published, Science and Nature often permit immediate free access to the papers, as was the case for the Plasmodium genome sequence (Carlton et al., 2002).
Research papers can be converted easily into case studies for teaching. Online access to papers facilitates the use of real data and figures for reading assignments and classroom lectures. Students benefit when they learn how to interpret real data. Faculty benefit from the dual use of the time spent reading for their research and preparing for class. If we follow the lead of BioQuest, students can be encouraged to ask questions, make discoveries, and discuss their interpretations of current research papers with classmates. Genomics papers that provide public access to the data are ready-made modules for student-based learning and will result in higher levels of thinking (Bloom et al., 1956; Wood, 2002).
Perhaps the greatest benefit of genomics has been the increased number of interdepartmental collaborations. The National Research Council's Bio2010 report (2003) calls for changes in the biology curriculum, but current faculty may find it impossible to teach radically different courses without collaborating. Biologists, especially those trained in cell and molecular biology, will benefit from collaborations with math and computer science colleagues. My own math skills were about as rusty as my German vocabulary, and I wanted to learn more. Fortunately, my institution hired Laurie Heyer, an applied mathematician with training in bioinformatics. Heyer developed a Computational Biology course that was offered in the spring semester ( http://www.bio.davidson.edu/courses/compbio/webpage/home.htm) after my first offering of genomics. Half of my genomics students enrolled in her course, where they learned perl programming and applied mathematics to solve biological problems (Figure 4). These seven genomics students were paired with an equal number of math majors who learned some biology and how to apply their knowledge to real-world problems. The course was very popular with the students, and for the first time on my campus, a course was cross-listed in biology and math. Heyer and I collaborate in our research interests as well as our teaching, and we hold joint lab meetings. We were able to model collaboration and demonstrate the value of interdisciplinary training to our students, and we each benefited from each other's insights.
Biologists and mathematicians are teaming up on many campuses. Betsey Dyer (biology) and Mark LeBlanc (math/computer science) at Wheaton College have established a very productive teaching and research collaboration that could serve as a model for every campus (LeBlanc et al., 2000; Dyer and LeBlanc, 2002; LeBlanc and Dyer, 2003). George Shiflet (biology) and Angela Shiflet (computer science) at Wofford College have created an impressive computational science program where students learn in two disciplines and graduate with outstanding jobs and/or graduate school opportunities (Shiflet and Shiflet, 2002; Shiflet, 2003). Bioinformatics courses, minors, majors, and departments are being developed rapidly all over the world, emphasizing the importance of biology and math/computer science collaborations.
GRADING IN A GENOMICS COURSE
Assessing student learning is always challenging and my least favorite aspect of teaching. I have tried many evaluation methods but have never been pleased with any of them, until now. During 2 years of experimenting with ways to evaluate student progress in genomics, I have gradually produced evaluation mechanisms that the students and I actually like! My tests and answer keys can be downloaded from the Web ( www.bio.davidson.edu/courses/genomics/Exams/exams.html). Fourteen and 11 students enrolled in my genomics classes, which is typical for upper-level courses at a small liberal arts college. Therefore, my increased satisfaction with grading genomics students cannot be attributed to small class size alone.
Figure 3. Sample of a figure that can be used for testing. This figure is from a DNA microarray paper showing the developmental control of gene expression in Drosophila melanogaster. (Reprinted with permission from Arbeitman, et al., 2002. Science. 297: 2270–2275. Readers may view, browse, and/or download material for temporary copying purposes only, provided that these uses are for noncommercial personal purposes. Except as provided by law, this material may not be further reproduced, distributed, transmitted, modified, adapted, performed, displayed, published, or sold in whole or in part, without prior written permission from the publisher.)
Figure 4. Hydropathy plot of human aquaporin generated using the Kyte–Doolittle method and an 11-amino acid window. The perl program used to generate this plot was written by students in the Computational Biology course. Used with permission from http://www.bio.davidson.edu/courses/compbio/flc/sample_plots.html.
Web Page Assignments
Popular Press vs. Scientific Press. For their Web page assignments, students were asked to perform tasks that required evaluation, application, and synthesis ( www.bio.davidson.edu/courses/genomics/GPBwebstandards.html; Allen and Tanner, 2002). The first assignment asked students to compare popular press and scientific publications about a human gene of their choosing. They were required to choose a gene that had been called the “smart gene,”“fat gene,”“language gene,” “gay gene,” and so forth. In addition to initiating the students into the complexity of genomics compared to genetics, this first assignment ensured that every student knew how to create Web pages ( www.bio.davidson.edu/Courses/genomics/2002/Henry/popularpress.html). To assist them, I created a series of Web pages on producing Web pages ( www.bio.davidson.edu/courses/genomics/GPBwebstandards.html#webtools) and evaluating Internet sources ( www.bio.davidson.edu/courses/genomics/webauthor/evaluate.html).
Describe Two Linked Yeast Genes. The remaining three Web assignments required students to analyze one annotated and one nonannotated gene from the yeast genome (euphemistically termed your favorite yeast genes; YFYG). For the first YFYG assignment, they could select any annotated gene and were encouraged to choose a gene/protein they had studied in another course. However, the nonannotated gene had to be located near their annotated gene (Figure 5). Students learned what they could about their two genes from online DNA resources. The final task was to propose a role for their nonannotated gene based on what they had learned ( www.bio.davidson.edu/Courses/genomics/2002/Pierce/yeastgene.htm).
Describe the Expression Profiles for YFYG. The second YFYG assignment required students to use DNA microarray databases such as Expression Connection (Table 1). For their known genes, students typically found few surprises, though they occasionally encountered unexpected results that required them to evaluate apparently conflicting data. For their unknown gene, students tested whether their earlier predictions were corroborated or not. If not, they proposed new cellular roles. Choosing a nonannotated gene neighboring their annotated gene, students often hypothesized that the two genes would have similar roles based solely on proximity ( www.bio.davidson.edu/Courses/genomics/2002/Watson/YFYGpage.htm). Student hypotheses based on proximity were well founded since many adjacent genes are transcribed in a coordinated manner (Boutanaev, 2002) and coordinated transcription may indicate related cellular roles. One student discovered that his two genes were coordinately expressed; all other students were forced to revise their “neighboring genes have related cellular roles” hypotheses (Figure 6).
Figure 5. Screen shot from the Web page of a student who chose these two neighboring genes from the yeast genome for further study. Annotated gene AUS1 and nonannotated gene YOR012W are located on the top strand near the center and on the right side of this chromosomal map (see complete Web site at www.bio.davidson.edu/Courses/genomics/2002/Shafer/favorite_gene.htm).
Describe the Proteins Encoded by YFYG. The final Web assignment focused on the proteomics of their two genes/proteins. Students utilized protein–protein interaction databases DIP, PathCalling, and Osprey, as well as Gene Ontology, MIPS, SwissProt, Function Junction, etc. (Table 1). On occasion, a student would find meaningful data and formulate plausible hypotheses about his or her nonannotated gene ( www.bio.davidson.edu/Courses/genomics/2002/Toran/YOL085Cprotein.html). It was important for students to indicate which databases they used because sometimes they chose genes with little information available and they needed to document this lack of information. Their last task for this assignment was to propose experiments to test their final hypotheses for their unknown genes. They chose genomic or proteomic approaches, as well as more traditional cell and molecular experimental methods. For the most part, these experiments were well designed to test the hypotheses they formulated through their discovery science.
Tests
Genomics does not lend itself to cognitive skills such as memorization (of genes and sequences) both because high-throughput data are searchable in databases and because the data could never be memorized. My genomics course had a prerequisite of genetics so there was no need for me to test students on basic genetics terminology. As with any scientific field, genomics uses many specialized terms that students must learn, but I chose to test more than just vocabulary, though good answers demonstrated a robust vocabulary. In particular, tests contained questions of comprehension, application, analysis, synthesis, and evaluation (Allen and Tanner, 2002; Sundberg, 2002). In my Molecular Biology course I frequently copy and paste figures from scientific publications for use; however, this approach was not completely satisfactory. In 2002, I gave students entire papers from Science or Nature and asked a series of questions about the paper. As noted above, the best papers for testing purposes included databases. All exams were open-book, take-home exams that required students to use the internet extensively. Due to the length of the exams (students reported taking from 8 to 24 h of dedicated effort to complete the exams), students were given several days to complete the exams.
I also improved assessment by requiring students to print hard copies of data from Web sites they used to answer questions. Because many of the exam questions had more than one correct answer and/or more than one way to arrive at a correct answer, it was important that I knew what information each student accessed. In addition, students captured screen shots of images to paste into the word processing files to support their answers. Screen shots were particularly useful for answers that utilized color images or protein structures.
I was very pleased with the outcomes of these tests because I felt that I understood how students were thinking. When evaluating their answers, I could see the data they used to formulate their answers. I could determine if they misunderstood the data or if they simply made a bad choice due to ambiguous options from a BLAST search. Here is the test question:
Tell me as much as you can about this sequence [see Figure 7A]. Use as many on-line sites as you want to fill me in on all the scoop. However, to receive maximum points, be sure and tell me every web site/database you visit and what you found there, even if you found nothing. Sometimes that is important information too.
I encourage you to take screen shots of any graphics you find helpful. Copy and paste these into your Word file.
Do not report any information about DNA microarrays for this gene. That will be on the next test.
I had chosen an uncharacterized open reading frame (ORF) from the yeast genome (Figure 7A). Because I knew where I had found the ORF, I did not perform the BLAST search. Surprisingly, when students submitted the sequence, two hits were returned with equal E-values (Figure 7, B and C). One hit was the ORF I had chosen (YLR343W), but the second hit sent students to the gene immediately upstream of the ORF I had chosen (PBR1/FKS1; Figure 7D). Because I had their printed data, I could see how they reached a different answer than the one I “knew” to be right (Appendix A). The first student was initially confused by two gene names for the same gene. Using PubMed and a free online article from the Journal of Bacteriology, however, the student realized that this particular gene had two names. Further student data mining uncovered no orthologs that were consistent with a role in fungal cell wall synthesis. The second example in Appendix A illustrates a different, but also correct answer. This student also used PubMed but was unlucky in choosing which paper to examine. The student dramatically altered her thinking after consulting SGD (Saccharomyces Genome Database; Table 1) and discovering the sequence originated from an unknown ORF and not the better-characterized gene. Using the graphic display at SGD, the student documented that the gene and the ORF were adjacent (Figure 7D and Appendix A). These two students' answers are both correct even though they arrived at different conclusions.
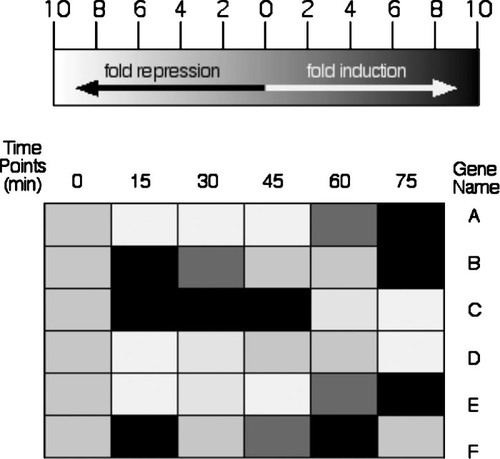
Figure 6. DNA microarray expression data from Expression Connection (Table 1). A student submitted his annotated gene (A) and his nonannotated gene (B) to determine if their expression patterns were similar, as he predicted based on their chromosomal proximity. The gene KGD1 was repressed slightly (green boxes), and later induced (red boxes), while the ORF YIL127C was minimally induced and later repressed substantially over this time course. The sets of genes that clustered with the student's two genes have no members in common, nor do they share biological processes.
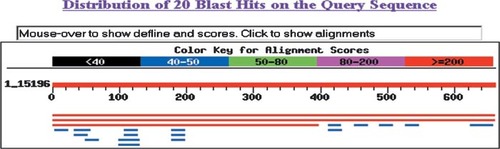
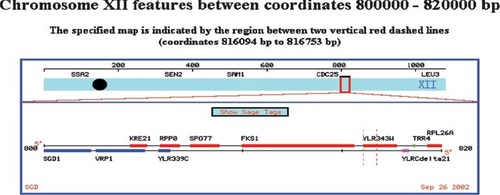
Figure 7. Example of how student printouts of intermediate steps allow me to recognize an ambiguity in the database search (BLAST; see Appendix A for more information). (A) Sequence students used to determine from which gene the sequence was extracted. (B) Screen shot of BLAST results showing two very similar hits (red lines). (C) E-value calculated for three best hits. (D) Chromosomal map showing the close proximity of the ORF used to extract the sequence (YLR343W) and the upstream gene that also came up as a hit (FSK1).
ASSESSMENT OF STUDENT OUTCOMES
Although assessment has become a buzz word, it remains a mystery to many of us. Funding agencies require assessment of curriculum innovations and grant recipients often use this funding stipulation as the motivation to formally evaluate their work. Why should readers of educational journals accept claims of improved learning without data? Biologists would not accept any new discoveries in research without data to support the claims. To assess whether my students were accomplishing my educational goals, I conducted two types of assessment in addition to the tests and the Web pages described above. I wanted to know if students had improved their knowledge within the field and if they had experienced any changes in attitude or self-perception.
Learning Gains
One of the course goals was to introduce students to terms, concepts, and methods. The average score on the entrance exam (Appendix B) showed how little students understood at the start of the course, while the average score on the exit exam showed substantial improvement (Figure 8). When students began the class, they were unable to answer basic questions based on genome sequence variations, DNA microarrays, and proteomics (average score, 0.77 ± 0.1 of 4 possible points), in part because they did not understand the basic vocabulary. I wrote simple questions for the entrance exam to highlight the students' lack of prior knowledge in these areas. When the same exam was administered at the end of the semester, only one student scored 3.5, while all others scored 4 of 4 possible points (average score, 3.95 ± 0.03).
Figure 8. Assessment of student learning gains from the 2002 genomics class. The entrance exam (Appendix B) was administered on the first day of class and the same exit exam was administered on the last day of class. The maximum score was 4 points. All 11 students completed both exams. The error bars indicate 95% confidence intervals.
Attitude and Self-Perception
At the beginning of the semester, I asked students to email me their expectations for the course and to describe how they saw themselves within the field of biology (Appendix C). At the end of the semester, I sent them their original responses and asked them the same questions again. By not prompting them on particular topics, I hoped to learn what topics and ideas the students felt were worth mentioning. Ten of eleven students responded and their comments were very informative. Below are some of the responses, which have been clustered under headings for clarity.
Excitement in Learning
I came into the class with little to no understanding of what genomics entailed. ... Now I find myself fascinated by the subject. My friends and family get annoyed with me trying to explain it to them, but I feel like the things I've learned are so revolutionary, I want to share my new found knowledge.
A second student said,
I've never been as interested in the reading and as motivated to continue learning as I have been this semester in Genomics. ... I came in thinking it would be a lot of work that would be difficult to get myself to do; I will leave thinking that it was a lot of work that was enthralling and that I did as willingly as is possible.
Altered Perception of Biology
I never imagined that I would view biology (and science in general) in such a larger context. Before taking this class, I would have to admit that I was prone to looking at areas of biology, like genetics for example, from the“ one gene causes one disease” aspect. At times I found myself questioning this approach, but never to the extent to which I do now. I feel as if I've put on a new pair of glasses and can see things more clearly.
Another student supported some of the Bio2010 findings:
It's almost overwhelming to think of the number of different experiments or hypotheses one can synthesize to explain biological phenomena. It's almost more befitting to entitle the course Systems Biology because the course looks at the intimate relationship and, yet, stochastic and independent behavior of the proteome and genome. I wish I could live to be 200 years old and study biology with degrees in physics, chemistry, biology, computer science and mathematics.
Increased Abilities and Confidence
I feel the class has offered me so many opportunities to thrive in the field of biology. Genomics and proteomics are just so relevant to everything that is going on. I feel much more prepared to get a job and apply to grad school than my fellow bio majors at other schools without this background. It is not even so much the material but the willingness to think and learn and question new things.
I feel like I have a new range of possibilities for where I go and what I do. I am positive that I want to continue with the field of genomics and proteomics. It is so interesting and malleable to new and innovative ideas. As to my wanting to become more vocal [in class], I feel slight success. What I realized I wanted more was [to] have a better vocabulary to state my ideas. I feel as if I have built a stronger vocabulary in which to communicate intelligently in biological terms.
After taking the exit exam, another student wrote,
This time, not only was I familiar with everything, but I found myself thinking in a different way about the questions. This class has really helped me to think more scientifically. In the past, I had trouble grasping certain facts, especially in genetics, because I knew the material presented (as though it were fully understood and nothing else needed to be considered) had to be more complex. Other times, I couldn't get around the fact that the teacher and the textbook author knew the situation was more complex, yet they chose to simplify it. The awareness of that [unspoken complexity] in my mind resulted in mental roadblocks. ... It is very different in genomics because it seems like we consider everything, and although Occam's razor is often applied, we are always looking for the best explanation, even if it is indeed more complicated than the model.
At the beginning of the course, I said I essentially wanted to know more about genomics. I have reached that goal without a doubt, but more and more I have found that this field, including bioinformatics and proteomics, is something that I want to spend a lot more time working on. Its the first time I've really felt confident about my ability to be scientific, but I have a lot more I need to learn. ... So I have new confidence, because I have seen myself improve at biology over 4 years, but I have also found a class that I feel passionate about. I have never immersed myself in a class like I have this one.
Alumni Outcomes
Another way to measure the impact of a course is to follow students after completing the course. Several graduating students from fall 2001 have taken jobs in genomics labs due to their increased interest in the field. Some are in the process of applying for graduate school and one has already been accepted to an M.D./Ph.D. program, in large part because of her training in genomics and math. Another student from 2001 was in Bolivia shadowing physicians on clinical rounds as a part of a postgraduate fellowship. When the attending physician asked the Bolivian medical students various questions about cancer biology, my former student was the only one who knew the answers. She continued by offering a genomics perspective on cancer that we had discussed in class. As a result, the attending physician asked my former student to give a guest lecture on the genomics of cancer (in Spanish) to all medical students the following week. Interest in research is yet another measure of a course's impact. Six of the 25 students from both years have conducted genomics research in my lab, while another 3 had to be turned away due to limited time and resources.
AREAS FOR IMPROVEMENT
My genomics course is a work in progress. I am in the process of developing a laboratory course to accompany the lecture course. A laboratory experience will provide more students with hands-on learning opportunities recommended in the Biology 2010 report (National Research Council, 2003). A related shortcoming in 2002 was the lack of time for working with the 3D stereographic visualization (Figure 2). Substantial time will be needed to train students on the software before they become proficient at manipulating the protein structure files. Furthermore, it takes time for students to get a gut feeling for protein structure/function relationships. And finally, students would benefit from more math and computer science. The value of math and computer science became clear to students in 2002 when a 2001 student emailed the class while looking for a research lab during his medical school training:
One researcher I talked to was ready to offer me a job for the summer the first time he met me if I could do the mathematics and informatics necessary to analyze and interpret the data from his arrays (since his mathematician was leaving for a higher paying job and he had no one else to do it). But I had to be honest and tell him that I could not do the math he wanted me to do. He then went on to tell me that anyone who can do math for these arrays has a job wherever the work is being done. ... So tell your genomics student to start taking math if they want job security!!
CONCLUSIONS
Genomics provides faculty and students with free access to data-rich resources that can be adopted easily for teaching. As genomic discoveries continue to influence diverse areas within biology, more and more faculty will be able to incorporate data from these free resources into their own research and teaching. Perhaps the vision and wisdom of those who launched genomics are becoming more apparent as the freely available data are used for teaching and research. As Cech (2003) noted in his Science editorial, there is a need for faculty to integrate their research and teaching. Faculty can benefit twice from the time spent preparing for class when they write test questions that require students to access genomic data related to their research. Because students model behavior they observe, if faculty improve their teaching and research simultaneously, then the next generation of faculty will believe that teaching and research are mutually beneficial rather than mutually exclusive.
Over the next few years, many institutions will teach genomics. Departments will have to decide whether to blend genomics into existing courses (the way many have done with genetics and molecular biology) or to create new courses. This choice raises an interesting question: Is a genetics course still genetics if it also covers molecular biology, genomics, proteomics, and bioinformatics? At some level, the question of course title is semantics, but for an individual department, the question may require creative solutions when the number of course offerings is limited. Should a separate course in genomics be offered? Based on my experience, student learning outcomes, student self-evaluations, and postgraduate career choices, genomics merits the resources needed to offer independent courses. Perhaps a student response provides the best rationale for creating new genomics courses:
My outlook on biology and even in the way that I think about everyday life is much different. I am constantly finding myself asking questions like'What is the entire effect?' and'How are these things connected and why does that make sense?' My decision to stick with this [genomics] class and put in the hours of time and effort is probably one of the best decisions that I've made in my life.
APPENDIX A
Two Student Answers to a Question with Two Correct Answers
These answers are provided exactly as the students submitted them.
First Example, Where Student Chose One Path with Good Data to Support the Conclusion
I first performed a BLASTn with the above sequence. There was 100% identity to part of the S. cerevisiae chromosome XII cosmid 8300. There was 99% identity to the PBR1 gene of S. cerevisiae. There was one gap with this sequence. The S. cerevisiae PBR1 gene for sensitivity to papulacandin B is 5631 bp long, so again, this 660 bp fragment was only a small portion of the gene. Base pairs 1–398 of the query also corresponded with a 100% identity to the Saccharomyces cerevisiae 1,3-beta-D-glucan synthase subunit (FKS1) gene, which is the same length as the PBR1 gene. These appear to be the same gene. In fact, when I performed a BLAST2 search with the two sequences, there was a 99% identity. Please see printout.
Before I realized that both genes were the same length, I had thought that perhaps there was some alternative splicing going on with the sequence, but when I inserted the query sequence into ORFfinder, there was only one significant ORF. Which of course now I know corresponds to BOTH genes because they are the same thing.
When I performed a PubMed search of PBR1, I found four hits, but one in particular caught my interest: “Papulacandin B resistance in budding and fission yeasts: isolation and characterization of a gene involved in (1,3)beta-D-glucan synthesis in Saccharomyces cerevisiae” by Castro C, Ribas JC, Valdivieso MH, Varona R, del Rey F, Duran A. A free copy of this paper was located at the Journal of Bacteriology online. In the paper, the investigators characterized the PBR1 gene in S. cerevisiae. According to the paper, PBR1 is identical to the FKS1 gene, which is part of the 1,3-beta-D-glucan synthase complex. (This complex is responsible for the biosynthesis of a major structural component of the yeast cell wall).
It is also interesting to note that in the BLAST results, some human BACs appeared (very small pieces of BACs) and a few other small pieces of other orthologs. However, with these sequences, the E-values are larger, making them not as biologically relevant. It could be just a coincidence that these sequences showed up at all.
Thus, this particular sequence does not appear that this sequence has any major orthologs. The sequence is part of a larger sequence that produces a particular protein that may or may not be in other organisms. It does have a conserved domain (as evidenced when I inserted the amino acid sequence of the PBR1 gene into the conserved domain database). The conserved domain occurs between amino acids 807 and 1632 and corresponds to glucan synthase. According to the conserved domain site, a glucan synthase catalyzes the formation of beta-1,3-glucan polymer, which again is a major component of the fungal cell wall. (Note that the conserved domain is not part of the query sequence; it is merely part of the protein sequence that the query sequence leads to).
Second Example, Where Student Chose a Different Path with Good Data to Support the Conclusion
I began by taking this unknown sequence to the Blastn database. This search led to a number of hits. Three of these hits appeared to me to be realistic hits because their E-values were 0 while all other hits had E-values of 0.89 or greater. These three hits were all for yeast. The three red bars were the yeast hits.
One hit was for a segment of chromosome 12, the next was for the yeast PBR1 gene on chromosome 12, and the last one was for FKS1 on chromosome 12. This information I received by clicking on the NCBI links from the BLASTn results page. In order to determine why these three hits were slightly different I searched PubMed for PBR1. This gave me one paper about the anti-anti-fungal properties of PBR1, but no sequence data. I then checked to see if PBR1 is conserved in humans at GeneCards and the Human Genome Browser and received no hits for this gene. I figured the next best place to go to learn about yeast genomics would be SGD. At SGD I performed another BLASTn, this time only of the yeast genome. This blast found a 100% match on chromosome 12 in the ORF YLR343W. I next did a FASTA search at SGD and once again found a 100% match to ORF YLFR343W. I looked at the ORF map of this region of chromosome 12 and was surprised by what I saw.
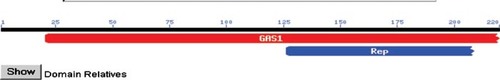
This map shows that our mystery sequence is in ORF YLR343W, the adjacent ORF to FKS1. Since the original BLASTn data led me to believe that the sequence was from FKS1 (aka PBR1) I retrieved the full sequence for FKS1 and YLR343W. It is in fact the case that our sequence is from YLR343W and not from FKS1. Unfortunatly there is little to nothing known about this ORF. I decided to take the amino acid sequence provided by SGD for our nucleotide sequence and perform a BLASTp search. This proved to be circular as the main protein I found was a hypothetical one based on ORF YLR343W. I next did a Conserved Domain BLAST with the protein and found that it most closely matched a GAS1 (glycolipid anchored surface protein) domain.
I searched NCBI-protein for YLR343W and found a reference to a probably transmembrane protein of the GAS1 family, thus confirming the above diagram's assumption. There is also a reference to it being a probable glycoprotein involved in signaling.
APPENDIX B
Entrance and Exit Exams
Answer yes or no. Have you had:
Bio111 at Davidson? __________ Genetics? __________ Molecular Biology? __________
Design an experiment to measure the genome-wide response when a cell becomes infected with a virus.
Define a proteome. How many do you have?
What is a SNP?
Analyze these data, which were taken after cells were exposed to a drug. Comment on any aspect of gene expression you deduce. You may use graphs or any other format that helps you express your interpretation. Use the back of this page for your answer.
APPENDIX C
Directions for Student Self-Reflection
First Week of Semester
As you begin this semester, reflect upon your knowledge in the areas of genomics, proteomics, and bioinformatics. What are your expectations for this class? How do you view yourself within the larger context of biology?
I would like you to send me an email by Wednesday with your thoughts. I will keep these emails and then show them to you again at the end of the semester, when I will ask you to summarize your thoughts at that time. I will not grade these, nor use them in any way to evaluate you.
The purpose of this type of evaluation is two fold. First, I am trying to evaluate the effectiveness of certain aspects of my teaching. Second, I hope this self-reflection will enable you to appreciate what you have learned, how you have grown, and what you might do after college.
Finally, I would like your permission to use your comments should I ever publish an article about teaching a genomics course. In your email, please indicate if you grant me permission to quote your responses anonymously.
Last Week of Semester
As you end this semester, reflect upon your knowledge in the areas of genomics, proteomics, and bioinformatics. How do you view yourself within the larger context of biology? Did this course meet your expectations?
I would like you to send me an email by Wednesday with your thoughts. I am sending back to you your first response to this request which you submitted back in August. This will serve as a reminder of what you said before class started. I will not grade these, nor use them in any way to evaluate you.
The purpose of this type of evaluation is two fold. First, I am trying to evaluate the effectiveness of certain aspects of my teaching. Second, I hope this self-reflection will enable you to appreciate what you have learned, how you have grown, and what you might do after college.
Finally, I would like your permission to use your comments should I ever publish an article about teaching a genomics course. In your email, please indicate if you grant me permission to quote your responses anonymously.
FOOTNOTES
Monitoring Editor: Sarah C.R. Elgin
ACKNOWLEDGMENTS
This work was supported by grants from the Associated Colleges of the South, the Duke Endowment, the Waksman Foundation for Microbiology, and Davidson College. I would like to thank my colleague and coauthor Laurie Heyer for her valuable input as well as the 25 dedicated students who enrolled in my new genomics courses. Lee Hood and his colleagues at the Institute for Systems Biology were instrumental in shaping my understanding of genomics and systems biology during a sabbatical year. Barbara Lom helped with critical discussions and careful reading of the manuscript. Finally, I would like to thank Bobby Vagt, Clark Ross, and Verna Case at Davidson College for their help over the last 4 years to make my genomics course a successful reality.