The Teaching Practices Inventory: A New Tool for Characterizing College and University Teaching in Mathematics and Science
Abstract
We have created an inventory to characterize the teaching practices used in science and mathematics courses. This inventory can aid instructors and departments in reflecting on their teaching. It has been tested with several hundred university instructors and courses from mathematics and four science disciplines. Most instructors complete the inventory in 10 min or less, and the results allow meaningful comparisons of the teaching used for the different courses and instructors within a department and across different departments. We also show how the inventory results can be used to gauge the extent of use of research-based teaching practices, and we illustrate this with the inventory results for five departments. These results show the high degree of discrimination provided by the inventory, as well as its effectiveness in tracking the increase in the use of research-based teaching practices.
INTRODUCTION
Research has shown the effectiveness of particular teaching practices in science, technology, engineering, and mathematics (STEM), such as more active and collaborative learning. There have been many calls for the greater adoption of such research-based teaching practices, originating from, among others, the National Research Council (NRC, 2012), the President's Council of Advisors on Science and Technology (PCAST, 2012), and the Association of American Universities (AAU, 2011).
A major difficulty in achieving the desired change is that the teaching practices used in college and university STEM courses remain largely unmeasured. At the request of one of us (C.W.) the AAU and the American Public and Land Grant Universities polled their members on whether or not they collected data on the teaching practices used in their STEM courses. C.W. also posed the same question to the attendees of the annual meeting of the Presidents and Chancellors of the Association of American Colleges and Universities. No institution reported collecting data on the teaching practices in use in its courses.
To our knowledge, no method currently exists for collecting such data in an efficient and consistent manner. The only data on teaching collected at most universities (Berk, 2005) are student course evaluations, but these provide little information on the teaching practices and little guidance to instructors as to how to improve (Cohen, 1980). There are a number of classroom observation protocols for undergraduate STEM that have been developed and validated, such as the Reformed Teaching Observation Protocol (Sawada et al., 2002), the Teaching Dimensions Observation Protocol (Hora et al., 2013), and the Classroom Observation Protocol for Undergraduate STEM (COPUS; Smith et al., 2013). While all of these provide useful data, classroom observation protocols necessarily capture only the classroom elements of the practices that go into teaching a course. They also require hours of training and observations to adequately characterize this fraction, as classroom activities can vary from one day to the next.
The teaching practices inventory (TPI) presented in this paper is designed to allow the broader range of practices that are involved in teaching a STEM course to be quickly determined. As such, it is possible to use that information to then determine the extent of use of research-based practices. To facilitate that determination, we have created a scoring rubric that extracts a numerical score reflecting the extent of use of research-based practices. Use of the inventory helps instructors evaluate their teaching, see how it might be improved, and track improvement.
The PULSE Vision and Change course-level rubric (PULSE, 2013) is in a similar spirit to our TPI and scoring rubric. All seven factors listed in that PULSE rubric can be seen to be reflected in items on the TPI. However, the TPI is designed to provide a more extensive and detailed characterization of the teaching in each individual course.
DEVELOPMENT AND VALIDATION
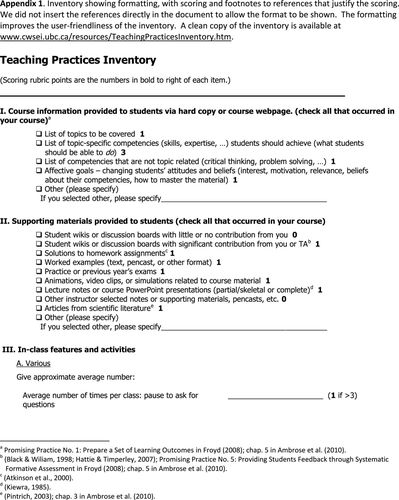
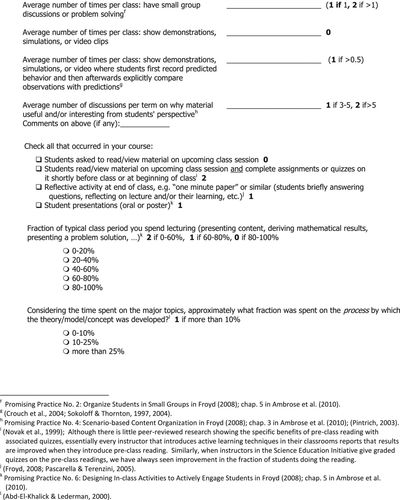
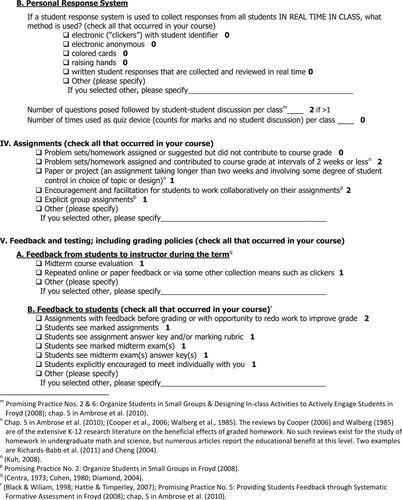
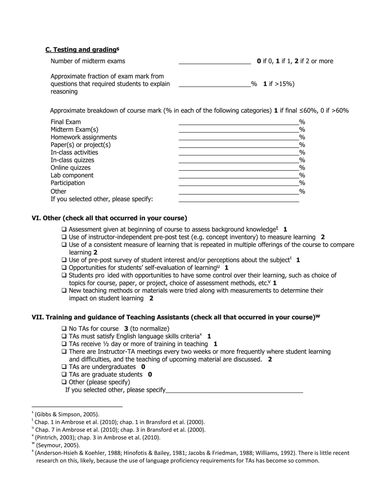
The full 72-item inventory with scoring rubric is given in the Supplemental Material, but we provide a few items here as typical examples. (On the actual inventory there are check boxes that are filled out to indicate whether a listed practice is used in the course or provided to the students.)
Assignments with feedback before grading or with opportunity to redo work to improve grade | |||||
Students see marked assignments | |||||
List of topics to be covered | |||||
List of topic-specific competencies (skills, expertise …) students should achieve (what students should be able to do) | |||||
Assessment given at beginning of course to assess background knowledge | |||||
Teaching assistants receive one-half day or more of training in teaching | |||||
The items on the inventory are divided into eight categories, as shown in Table 1.
| I. | Course information provided (including learning goals or outcomes) |
| II. | Supporting materials provided |
| III. | In-class features and activities |
| IV. | Assignments |
| V. | Feedback and testing |
| VI. | Other (diagnostics, pre–post testing, new methods with measures, etc.) |
| VII. | Training and guidance of TAs |
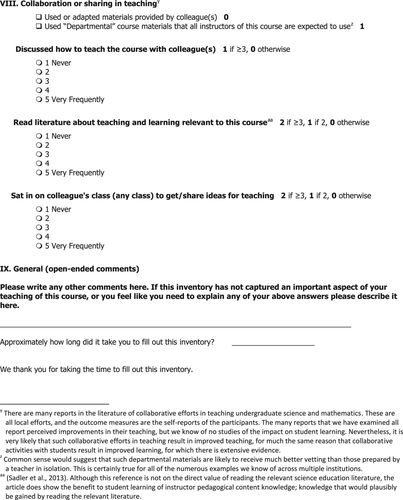
| VIII. | Collaboration or sharing in teaching |
We are using the term “inventory” in its conventional meaning of a list of all items present, in this case a list of all the teaching practices present in a course. This is different from the meaning the word “inventory” has taken on in a science education research context, namely an instrument for the measurement of mastery of some particular scientific concept, such as the Genetics Concept Assessment (Smith et al., 2008) or the Force Concepts Inventory (Hestenes, 1992). This difference has implications for the development and validation of the instrument. The “construct” to be measured in this case is the set of teaching practices that are commonly or occasionally used in math and science courses. Our definition of “occasional” (as distinguished from very infrequent or unique) is that, to our knowledge, the practice has been used in multiple science or mathematics courses distributed across four or more different universities or colleges. To be valid as an inventory, the TPI has to accurately characterize the range of teaching practices used in a course when an instructor makes a good faith effort to complete the inventory. Our primary testing and refinement focused on ensuring that science and math instructors will interpret the items in a consistent and accurate manner and that the inventory covered all teaching practices used by more than two instructors in our large test sample. Owing to the nature of this construct, the statistical tests that one would use to check reliability and validity of a conventional instrument like the genetics concept assessment are not applicable in this case. In particular, tests of the relationships between items do not provide meaningful information about the quality of the assessment instrument.1 Finally, the inventory only tells whether a practice is being used, it does not tell the quality of implementation. As discussed in the Further Work section, we have some evidence that it is far more difficult to measure quality of implementation of practices.
The development process involved two major iterations and one final round of minor revisions. The first iteration was in 2007. At that time, we were trying to characterize the teaching practices in use in the science departments at the University of British Columbia (UBC) at the launch of the Carl Wieman Science Education Initiative (CWSEI). The instructors in math and sciences at UBC are quite similar to the instructors at any large U.S. public research university. A substantial fraction are from the United States, and most of them have either studied or taught at U.S. universities at some point in their careers. We developed the inventory relatively quickly, relying on our own knowledge of the education research literature and our experience with science instructors and faculty development across several science departments while working on the University of Colorado Science Education Initiative (CU-SEI). We shared a draft of the inventory with about a dozen instructors in the UBC science departments, and their feedback was used to refine the wording to improve the clarity. Approximately 150 instructors then completed that first version of the inventory.
Over the next several years, we created a second version, guided by the 150 responses and associated feedback on the first version and from the extensive experience gained on instructors’ teaching practices through the work of the CWSEI. In developing the second version, we examined all the inventory responses to see where there was evidence of confusion over the questions, where there were frequent responses in the “other” categories (therefore not one of the listed response options), or whether some items seemed unnecessary or inappropriate. We also analyzed all of the open-ended comments from the instructors. These were easily coded into categories of: 1) said they were using a practice marked as “other” that matched what we had intended to cover by one of the response options, thus indicating confusion as to the description of the options; 2) described a practice relevant to that item but not covered by any listed option; or 3) described a practice they could not see how to capture using any of the items on the TPI. The total number of comments in all three categories for any item was well below 10% of the total responses for that item, indicating there were no serious problems with the version 1 items.
However, there were a number of places where it was possible to make minor improvements. We also added a few items and response options to capture a larger range of practices, as determined from the combination of: the review of the version 1 inventory responses, informal discussions with many instructors across the departments of mathematics and the sciences, and systematic review of the inventory and input on practices observed from the ∼30 science education specialists (SESs; Wieman et al., 2010) who worked with a number of different instructors in all of the math and science departments during that period of time. The SESs were able to provide full descriptions of the teaching practices used by nearly all of the instructors in three departments with large CWSEI programs, as well as descriptions of the practices used by a substantial fraction of the instructors working in other departments affiliated with CWSEI and CU-SEI. We also added items on teaching assistant (TA) selection, training, and guidance, and made a number of minor wording changes to improve clarity.
We organized the questions into the eight categories listed based on usability interviews and feedback. Those categories and the format of the survey were chosen only to make completion of the survey easier, not for any theoretical reason, and were finalized only after we had determined all the practices/items we wanted to include. Feedback from the SESs and CWSEI department directors and discussions with other instructors indicated these categories tended to match how instructors generally organized their thinking about the different elements of teaching a course, and so this organization made the process of filling out the survey most efficient.
After completing these revisions, we had three other experts in college science teaching2 and the SESs review this draft of the second version of the inventory. They made suggestions for minor changes, most of which were incorporated.
Finally, the five instructors who served as the CWSEI departmental directors in the science and math departments, and hence are representatives from each discipline, carefully went over each question as the final stage of the second iteration. They filled out the inventory for the courses they were teaching and then went through their responses and interpretations of the questions with us. We assessed whether they interpreted what was being asked as we intended and elicited their opinions as to whether the instructors in their departments might find any question confusing or misleading. This process led to a few more very minor wording modifications, resulting finally in version 2 of the inventory. In spite of this extensive review, 80% of the 2007 items ended up either unchanged or with only very slight changes in wording in version 2.
To improve the accuracy and consistency of responses, we designed the inventory to minimize the number of subjective judgments. Only two items are likely to have substantial subjectivity in the responses, and these are both in category III: in-class features and activities. These are the items: “How many times do you pause to ask for questions [during class]?” and “Fraction of typical class time spent lecturing?” We particularly recognized the limitations of the first question but decided to keep it, because it is meaningful, and there is value to encouraging instructor reflection on this specific item. From our experience, we expected that the estimates of fraction of time spent lecturing would be more clearly defined in the minds of the instructors and the responses more accurate than for the first question, but still rather subjective. As discussed in the Accuracy of Responses section, we have conducted some testing of the “fraction of typical class spent lecturing” responses.
During the development process, we discovered that the formats and instructional practices of courses labeled as “labs” (including project-based) and “seminar courses” (where the structure and pace of the class was largely driven by students, rather than an instructor) were highly idiosyncratic and varied widely from one course to the next. We were unable to find meaningful common features by which to characterize the teaching practices used in such courses, and so we recommend that the TPI not be used with them. The educational goals also varied widely across all such courses that we analyzed and were usually ill defined, making it difficult to determine whether any of the practices used had research evidence indicating their effectiveness. Our observations matched the findings of the NRC review of the research on instructional labs in science (NRC, 2006).
One hundred and seventy-nine instructors from five math and science departments completed version 2 of the inventory. We reviewed all of those responses, particularly all the responses in the “other” categories and the open-ended responses, looking for indications that the instructors had misinterpreted a question or that they felt they were using practices not captured adequately by the inventory (which also could be the result of misinterpretation). There were only isolated examples of individual instructors misinterpreting an item or a response option. On the three items for which the latter occurred three to five times, we made small wording changes. There were only three instructors who said it was difficult to adequately describe the practices in their courses with the TPI options. We discovered that two of the respective courses were seminar courses and the other was a project lab course. Those three instructors had simply overlooked the instructions telling instructors to not to fill out the TPI for courses of those types. Finally, it appeared that three (1.5%) of the instructors gave numbers based on “per term,” rather than “per class” as stated in the item. The primary difference between version 2 and the final version we present in this paper were changes in wording to give greater emphasis to that distinction. The final version of the inventory is given in the Supplemental Material.
ACCURACY OF RESPONSES
Our primary validation effort focused on ensuring that the inventory items were interpreted clearly and consistently by instructors and that the inventory captured the practices used by the instructors who completed it. No practices were identified that were used by more than two (of 179) instructors and not captured by the survey. The item interpretation was tested by the department director interviews and the review of the 179 instructor responses. Our assumptions are that when 1) there are no stakes tied to the results, 2) instructors clearly understand what is being asked, and 3) little subjective judgment is required for the response, the responses will likely be accurate. As noted, the latter is true for nearly all of the items in seven of the categories and many of the items in the eighth.
However, we also carried out some limited tests of the accuracy of the responses. The first of these involved having a person other than the instructor check a sample of the responses. Although we recommend having instructors complete the TPI themselves, as there is value to that reflection and it takes the least time, the TPI is not inherently a self-reporting instrument. In most cases, it is easy for another person to determine the correct responses by looking at course materials and instructor class notes. It is more difficult for an independent observer to complete some items of category III: in-class features and activities, as it would require substantial class observation time.
We have selected approximately a dozen random TPI course results and asked the respective SESs in the departments if they thought they were accurate. The SESs are quite familiar with the teaching practices of most of the instructors in their departments. For all but a few cases, they felt they were sufficiently familiar with the instructor and course (or with some review of the course material) to be able to evaluate the accuracy of the responses, and in all those cases, they said they believed the TPI responses were correct to within the width of the levels on the scoring rubric discussed in the Scoring Rubric section, except for the category III items discussed previously.
We also checked with the SESs or CWSEI department directors about several courses that had a surprisingly high or low number of research-based practices. Although we did not get item-by-item evaluation, they confirmed that the general results were reasonable for those instructors according to their knowledge of the teaching practices favored by those instructors.
We compared the TPI responses for seven team-taught courses in which two instructors provided responses for the same course. In five of the team-taught courses, the differences between the TPI responses for different instructors were small (0–2 points using the scoring rubric discussed in the Scoring Rubric section) and consistent with the known differences in classroom practices between the instructors. In two cases, instructors who were team-teaching but were only involved in isolated portions of a course were unaware of some aspects, such as what was provided to students at the beginning of the course, and gave correspondingly inaccurate responses. On the basis of this observation, we believe that, if a course is team-taught, it is best to get a single TPI response from the instructor who is most responsible for the course as a whole. Examining the anomalies also revealed two cases in which “per term” and “per class” labels were apparently misread, as previously noted.
Category III: in-class features and activities is the most difficult for instructors to remember accurately and the most difficult for a third party to check the accuracy of the instructor-supplied TPI data. To address concerns about the accuracy of the TPI responses for category III, we developed an easy-to-use classroom observation protocol, COPUS. This provides a straightforward and efficient way to capture what the instructor and the students are doing during class (CWSEI, 2013; Smith et al., 2013). We have examined the correlation between single-class COPUS observations and instructors’ 2012 TPI responses for 49 courses. Because these were only single-class observations, the results are necessarily crude with respect to any given course, but they did allow us to test whether there were any substantial systematic differences; for example, whether instructors consistently underestimated on the TPI the fraction of time they spent lecturing. We found no systematic differences. The “fraction of class time spent lecturing” for both measures ranges from 10 to 100% for the different courses, and the average overall for the 49 courses is 57% (SD 24%) from the TPI and 58% (SD 28%) from the COPUS observations. There are 16 courses in which the COPUS fraction on the day observed was more than 20% higher than the TPI-reported average fraction of time spent in lecture during the entire term, and 15 courses in which the COPUS observation fraction was more than 20% lower than the TPI value. It is not surprising that the agreement in any particular course is modest, since the TPI is the estimate over an entire term, while the COPUS observations provided a measurement for only a single class period. From multiple COPUS observations of a single course, we know that it is not unusual to have substantial variations from one class to another. This 49-class COPUS sample was from a department in which the fraction of time spent lecturing is relatively low. There are other departments for which a much larger fraction of the TPI responses say that 90–100% of the class time is spent in lecturing. We have limited COPUS data on such higher-lecture-fraction courses, but those data do agree more closely with the TPI data.
We also examined whether overall trends we knew about from other data were accurately reflected in the TPI results. 1) We examined several courses in each department for which we knew there had been substantial efforts supported by the CWSEI to implement research-based instructional practices. The TPI data for those courses reflected those practices and indicated more, usually much more, extensive use of research-based practices than the departmental average. 2) We have a variety of independent measures indicating that the department labeled as D5 in the figures and tables was using fewer research-based practices than other departments, and this was also seen in the TPI results. 3) Finally, we have data indicating that appreciably more than half of the instructors in the department labeled as D3 below have been involved in implementing research-based practices in their teaching in the last several years. The TPI results from 2012–2013 for D3 show significantly greater use of research-based practices than in 2006–2007. These differences are quantified in the Results section.
SCORING RUBRIC
The inventory results in raw form provide an enormous amount of information about how an individual course is taught and, when aggregated by department, about the teaching practices in use in a department. However, it is difficult to quickly determine from the raw inventory results the extent and type of use of research-based practices. To facilitate this determination, we have created a scoring rubric that extracts from the inventory data for each course an “extent of use of research-based teaching practices (ETP)” score for each of the eight inventory categories and for the course as a whole. This rubric assigns points to each practice for which there is research showing that the practice improves learning. The ETP score provides an efficient way to sort through the mass of data provided by the full inventory to identify areas of interest, but it would be a mistake to look at only the ETP score for a course. The breakdown by category and the full inventory response provides a much richer characterization of the teaching.
The first source of evidence used in creating this rubric is the extensive research over the past few decades demonstrating new and more effective teaching practices in science and engineering courses at colleges and universities. These practices have been shown to transcend the specific disciplines and achieve substantially better student learning and other outcomes than the traditional lecture method across the fields of science and engineering (Freeman et al., 2014). These practices are well-known in biology, with evidence of their effectiveness demonstrated in many articles in CBE—Life Sciences Education and other journals. Examples of such research-based practices are: the use of clicker questions with peer discussion; small-group activities of various types; the use of prereadings with follow-up questions; graded homework; and frequent low-stakes testing and feedback. The National Academy study of discipline-based education research (NRC, 2012) provides the most extensive and authoritative review of this research on the teaching of science and engineering. A new meta-analysis (Freeman et al., 2014) shows gains in both student achievement and course completion that are comparable across the different disciplines. There is also evidence that the amount of student learning that an individual instructor achieves changes when he or she changes the teaching practices he or she is using (Hake, 1998; Knight and Wood, 2005; Derting and Ebert-May, 2010; Hoellwarth and Moelter, 2011; Porter et al., 2013).
The large observed differences in the effectiveness of different science teaching practices and the similarity of those differences across disciplines (Freeman et al., 2014) can be explained in terms of the basic principles of complex learning that have been established by the learning sciences (Bransford et al., 2000; Ambrose et al., 2010; Wieman, 2012). These principles include such things as the need for intense prolonged practice of the cognitive skills desired, with guiding feedback, and the importance of motivation and addressing prior knowledge of the learner. The general learning sciences research is the second source of research literature that was used in creating the scoring rubric. The existence of these underlying principles also implies that it is likely that the relative effectiveness of various teaching practices will also hold for subjects and students for which there are not yet data.
The ideal scoring rubric would assign to each practice a number of points based on a quantitative analysis of its relative benefit to student learning. However, such an analysis to determine the precise weighting would require far more data than currently exist. A much simpler option is to use a binary rubric that merely gives one point to every practice for which there is solid evidence or strong arguments that it supports learning and zero to the rest. We present here a third alternative rubric that is in the spirit of both the Froyd (2008) ranking of promising practices and the PULSE Vision and Change rubrics, wherein they assign broad numerical levels based on qualitative plausibility arguments that are in turn based on the available data, rather than quantitative criteria. Our scoring rubric assigns at least one point to each practice for which there is evidence it supports learning and two or three points to a few practices for which there is evidence suggesting they provide particularly large and robust benefits. We believe that this rubric provides a more accurate measure of the respective benefits of the teaching practices than a simple binary rubric, but we leave it to the reader to choose which rubric he or she prefers. In either case, a simple Excel spreadsheet can be used to automate the scoring. As shown in the comparison of existing courses and departments found in the discussion of the scoring rubrics in the Supplemental Material, both rubrics provide similar results. When there is more extensive use of research-based practices, it is likely that the differences between rubrics will become more apparent.
The distribution of points for the rubric is shown on the inventory in Appendix 1. The number of points (1–3) given per research-based item depends on our informed but subjective judgments on the consistency, extent, and size of the benefits in the published literature and, to a lesser extent, our experience with the robustness of the benefit from observing (often via the SESs) the adoption of various research-based practices by a few hundred science instructors at the Universities of Colorado and British Columbia. Points are given for a few items, discussed below in this section, for which there is little or no direct published evidence but strong plausibility arguments combined with our observations of instructors’ behaviors and results. We had the same three experts on undergraduate STEM teaching who reviewed the inventory also review the scoring rubric, and they all agreed that it was appropriate.
In Table 2, we provide abbreviated descriptions of all of the inventory items that receive points in the scoring rubric, along with references to the supporting research. The items are grouped according to the nature of their contributions to supporting learning in order to make the comparison between items and supporting research literature more convenient. This categorization is necessarily imperfect, in that a specific practice will often contribute to learning in more than one way and there is some overlap between the listed factors of contributions to learning. We have listed some of the additional contribution types of an item in the table.
| Factor | Practice that supports | References on benefits |
|---|---|---|
| Section 1. Practices that support learning | ||
| Knowledge organization | I. List of topics to be covered | Promising Practice No. 1: Learning Outcomes in Froyd (2008); Chapters 2 and 5 in Ambrose et al. (2010) |
| I. List of topic-specific competencies (+ practice + feedback + metacognition) | Promising Practice No. 4: Scenario-based Content Organization in Froyd (2008) | |
| I. List of competencies that are not topic related (critical thinking, problem solving) | ||
| II. Animations, video clips, simulations | ||
| II. Lecture notes or copy of class materials1 (partial/skeletal or complete) | 1Kiewra (1985) | |
| III. Time spent on the process2 | 2Abd-El-Khalick and Lederman (2000) | |
| Long-term memory and reducing cognitive load | II. Worked examples1 | 1Atkinson et al. (2000). Also implies that preclass reading would reduce cognitive load and thereby enhance in-class activities. |
| III. Students read/view material on upcoming class and quizzed2 | 2Roediger et al. (2010) | |
| Novak et al. (1999) | ||
| Motivation | I. Affective goals—changing students’ attitudes and perceptions | Chapter 3 in Ambrose et al. (2010); Pintrich (2003); Promising Practice No. 4: Scenario-based Content Organization in Froyd (2008) |
| II. Articles from scientific literature | ||
| III. Discussions on why material useful | ||
| V. Students explicitly encouraged to meet individually with you (+ feedback) | ||
| VI. Students provided with opportunities to have some control over their learning | ||
| Practice | II. Practice or previous years’ exams +feedback for all itemsbelow | Chapter 5 in Ambrose et al. (2010); Promising Practice No. 6: Designing In-class Activities to Actively Engage Students in Froyd (2008); Freeman et al. (2014); Ericsson (2006) |
| III. Number of small-group discussions or problem solving | ||
| III. Demonstrations in which students first predict behavior1III. Student presentationsIII. Fraction of class time [not] lecturingIII. Number of PRS questions posed followed by student–student discussionIV. Problem sets/homework assigned and contributing to course grade2IV. Paper or project (involving some degree of student control)3 (+ knowledge organization + motivation)V. Fraction of exam mark from questions that require reasoning explanation (+ metacognition) | 1Crouch et al. (2004); Sokoloff and Thornton (1997, 2004)2Walberg et al. (1985); Cooper et al. (2006). The reviews by Walberg et al. (1985) and Cooper et al. (2006) are of the extensive K–12 research literature on the beneficial effects of graded homework. Numerous research articles report the educational benefits in undergraduate math and science. Two examples are Cheng et al. (2004) and Richards-Babb et al. (2011).3Kuh (2008) | |
| Feedback | II. Student wikis or discussion board with significant contribution from instructor/TA | Black and Wiliam (1998); Hattie and Timperley (2007); Promising Practice No. 5: Providing Students Feedback through Systematic Formative Assessment in Froyd (2008); Chapter 5 in Ambrose et al. (2010); Gibbs and Simpson (2005) |
| II. Solutions to homework assignments | ||
| III. Number of times pause to ask for questions | ||
| IV. Assignments with feedback and opportunity to redo work (+ metacognition) | ||
| IV. Students see marked assignments | Atkinson et al. (2000) | |
| IV. Students see assignment answer key and/or marking rubric | ||
| IV. Students see marked midterm exams | ||
| IV. Students see midterm answer keys | ||
| V. Number of midterm exams | ||
| V. Breakdown of course mark | ||
| Metacognition | III. Reflective activity at end of class | Pascarella and Terenzini (2005); Froyd (2008) |
| VI. Opportunities for self-evaluationAlso all group learning | Chapter 7 in Ambrose et al. (2010); Chapter 3 in Bransford et al. (2000) | |
| Group learning (has elements of most other categories) | IV. Encouragement for students to work collaboratively on their assignments | Promising Practice No. 2: Organize Students in Small Groups in Froyd (2008); Chapter 5 in Ambrose et al. (2010) |
| IV. Explicit group assignments Also all in-class student discussions | ||
| Section 2. Practices that support teacher effectiveness | ||
| Connect with student prior knowledge and beliefs | VI. Assessment at beginning of courseVI. Use of pre–post survey of student interest and/or perceptions (also feedback on effectiveness) | Bransford et al. (2000); Chapter 1 in Ambrose et al. (2010) |
| Feedback on effectiveness | V. Midterm course evaluation1 | Ericsson (2006) and the other general references above on value of feedback for developing expertise apply here as well.1Centra (1973); Cohen (1980); Diamond (2004) |
| V. Repeated feedback from students1 | ||
| VI. Use of instructor-independent pre–post test (e.g., concept inventory) | ||
| VI. Use of a consistent measure of learning that is repeated | ||
| VI. New teaching methods with measurements of impact on learning | ||
| Gain relevant knowledge and skills | VII. TAs satisfy English-language criteria1 | 1Hinofotis and Bailey (1981); Anderson-Hsieh and Koehler (1988); Jacobs and Friedman (1988); Williams (1992)2Seymour (2005)3General references above on value of collaborative learning would also apply here, but in the context of teacher knowledge, skills, and metacognition.Sadler et al. (2013) |
| VII. TAs receive one-half day or more of training2 | ||
| VII. Instructor–TA meetings on student learning and difficulties, etc.2 | ||
| VIII. Used “departmental” course materials | ||
| VIII. Discussed how to teach the course with colleague(s)3 | ||
| VIII. Read literature about teaching and learning relevant to this course (+ connect with student prior knowledge and beliefs) | ||
| VIII. Sat in on colleague's class3 | ||
The references given in Table 2 to support the scoring are mostly reviews of the literature, rather than specific research studies, since there are an enormous number of the latter for most items. There are three levels of support for the scoring of items:
Thirty-seven of the 51 items that contribute points, representing 47 of the 67 ETP points possible, are for items for which there is extensive and directly relevant evidence of their educational benefit to undergraduate science and mathematics instruction (and usually to other disciplines as well). These include learning outcomes, worked examples, motivation, collaborative/group learning, practice and feedback, in-class activities that actively engage, addressing prior knowledge, and encouraging metacognition.
There are 10 items, representing 13 points, where the evidence we found is limited in one or more respects: extent; robustness; or demonstration in undergraduate science and/or mathematics courses. However, in all cases it is plausible that these practices would be beneficial to learning in science and math courses based on indirect arguments, such as the general value of feedback, teacher expertise, course coherence, and motivation. These items are on: midcourse feedback from students to instructor, TA training and guidance, process of science discussions, and project assignments. We could find no reference that looked at the value of the use of “departmental course materials that all instructors are expected to use,” but in all of the ∼10 cases we know of where this is done, the materials receive far more careful vetting and regular review than typical course materials.
Finally, there are four items, representing 7 points, on aspects of measuring learning. Without the use of instruments to measure learning, it is impossible to reliably determine the extent of student learning. So while it is logically impossible to measure the direct causal benefits of using such instruments in a course, the cognitive psychology literature on the value of informative feedback for improving performance would imply they would likely improve instructional effectiveness. Also, the field of discipline-based education research (NRC, 2012) is largely based on the fact that, when such measures are introduced in a course, they reveal deficiencies in learning that in many cases have then been successfully addressed by changing the teaching, resulting in improved measures of learning and other student outcomes. Thus, we argue that use of these practices has an eventual beneficial impact on student learning, although, like every practice in the inventory, use of the practice does not guarantee improvement—it must be used well. We have seen that when instructors at UBC choose to use such practices in their courses (as distinguished from when third parties collect data in the course), they are consistently attentive to the results.
One scoring item that is anomalous is the awarding of 3 points if there are no TAs in the course. These points are not because we feel there is any inherent educational benefit to not having TAs. It is simply to normalize the scoring to make it equivalent for courses that do and do not use TAs. If a course has no TAs, the potential lack of coordination (including coordination of pedagogy) of the TA and non-TA elements of the course and the problems with language fluency of the TAs are not issues, and so an equivalent number of points (3) is provided to courses without TAs.
A common first impression is that this is an excessive set of practices, and that it would not be beneficial to have nearly so many in a course. However, this impression is misleading. First, there are many specific elements involved when you consider all aspects of a course in detail, particularly as it progresses over an entire term. Second, of the 51 items that we have identified as supporting student learning, many of them are used routinely. Third, most of these items are mutually reinforcing, rather than competing for student time and attention. For example, homework and feedback/grading of homework are two elements common to many science courses. The inventory has seven different items relating to how the assignments are given and graded to capture beneficial details, but these do not represent additional activities by the students; they are simply necessary to capture the range of practices used by different instructors. Even though many instructors would have a consistent set of responses across some items, such as the homework and grading choices, it is important to not combine the items, because not all instructors are consistent. Even if there may be substantial correlation between particular item responses when looking at the responses of many instructors together, those differences manifested by some instructors can have significant implications with regard to student learning. Similarly, there are seven items listed under supporting material that we list as beneficial to learning, but most of these will be used by students only occasionally during the course for specific needs.
There are only a few items on the inventory that could conflict, in the sense that they compete for student time and attention if done together. These are all in category III: in-class features and activities. In our opinion, it would not be desirable for an individual course to include frequent ongoing use of every item in category III that we have listed as beneficial, as this would likely be overwhelming for both instructor and student. For nearly all the items in the other categories, good arguments can be made that adding that practice to a course would provide the benefits indicated by the research, without any downsides due to conflicts, assuming the instructor has the time to implement them all adequately.
For the convenience of those who may wish to use the inventory, a clean copy, uncluttered with the scoring and footnotes, is posted at www.cwsei.ubc.ca/resources/TeachingPracticesInventory.htm. An Excel file with formulas to facilitate automatic scoring of responses with the rubric is also available at that website, as is a file of the inventory that can be used to collect inventory data using the Qualtrics online survey tool.
RESULTS FROM TYPICAL COURSES AND DEPARTMENTS
We present the results from the 179 completed version 2 inventories for courses in five science and mathematics departments during one semester.3 It took instructors an average of 13 min (SD 6 min) to complete the inventory, with 53% of them taking 10 min or less. This is an overestimate of the time needed to fill out the inventory, as these times include the additional time to fill out three additional open-ended optional questions on institutional issues.4
These results are illustrative samples and do not represent an accurate characterization of all of these departments, because the level of response varied. Departments D2 and D3 made this a departmental priority and so obtained responses for 90% or more of their courses for the semester. The response rate of D1 is roughly 75%, D4 is well under 50%, and D5 is roughly 65%. Instructors who have worked with the CWSEI are disproportionately represented in these samples, and thus it is likely that the nonresponders from these departments would score lower than the departmental averages listed here.
In Table 3, we show the aggregate ETP scores and SDs for the five departments, including the breakdown of scores for each of the eight categories. Figure 1 shows the histograms of the ETP scores for the five departments. In Supplemental Table S1, we show the total and category ETP scores for each of the 31 courses in a single department as an example. The tables and figure provide an indication of the large amount of useful information provided by the inventory.

Figure 1. Histograms of the ETP scores for the courses in the five departments. Histogram bins are 5 wide (±2 around the central value). ETP scores are integers.
| Department | N | AVE (SD) | EWA | I | II | III | IV | V | VI | VII | VIII |
|---|---|---|---|---|---|---|---|---|---|---|---|
| D1 | 28 | 33.4 (9.4) | 39.3 | 3.9 | 4.2 | 7.8 | 3.2 | 7.5 | 2.3 | 1.6 | 2.9 |
| D2 | 31 | 32.6 (8.5) | 33.6 | 3.7 | 4.5 | 6.1 | 3.3 | 8.1 | 1.6 | 2.3 | 2.9 |
| D3 | 34 | 31.1 (8.9) | 33.8 | 4.4 | 3.9 | 6.6 | 3.5 | 5.9 | 2.1 | 1.7 | 3.1 |
| D4 | 31 | 31.1 (8.2) | 33.3 | 4.0 | 4.1 | 6.7 | 2.7 | 6.6 | 1.6 | 2.0 | 3.4 |
| D5 | 55 | 24.1 (6.5) | 25.2 | 2.7 | 3.1 | 4.0 | 2.1 | 8.3 | 0.7 | 1.1 | 2.1 |
| Maximum possible | 67 | 6 | 7 | 15 | 6 | 13 | 10 | 4 | 6 | ||
| Category SD | 1.7 | 1.4 | 3.0 | 1.5 | 1.8 | 1.7 | 1.3 | 1.5 | |||
Figure 1 shows there is a substantial distribution of ETP scores within departments, covering a range of more than a factor of four in four of the departments and more than a factor of three in the fifth department. The lowest-scoring courses are at 10 and 11, while the highest-scoring courses are just above 50. This demonstrates that the inventory provides a large degree of discrimination between the practices of different instructors within a department. The spreads within departments are larger than the differences between departmental averages. The category averages shown in Table 3 show larger fractional differences between departments than do the total ETP scores for departments.
In addition, we know that D1 has chosen to focus more than the other departments on introducing research-based practices into its largest courses. Consequently, as shown in Table 3, the difference between its average ETP and its enrollment-weighted average ETP is larger than the corresponding differences for the other departments.
The scored TPI also provides a measure of change in practices. We calculated the average ETP score and enrollment-weighted average score for department D3 for the 2006–2007 and 2012–2013 academic years using the 80% of the scored questions that were unchanged between the two versions of the inventory. Figure 2 and Table 4 show there has been a large change in these scores (about one SD, p <0.001 using a simple t test) over this 6-yr period. It is notable that the TPI results show greater use of research-based practices in categories I, III, and IV in the later period (all differences statistically significant)—those are the categories in which the majority of CWSEI work in that department has been focused. Furthermore, the large fractional change in VIII is consistent with independent indications of increasing collaboration on teaching within the department. These results demonstrate that the inventory can capture both general and specific changes over time in the teaching practices within a department.

Figure 2. Histogram of the fractional ETP scores for the courses in department D3 in the 2006–2007 and 2012–2013 academic years. The scoring is the fraction of the maximum possible score based on the subset of 40 scored questions common to both versions of the inventory.
| AVE (SD) | EWA | I | II | III | IV | V | VI | VII | VIII | |
|---|---|---|---|---|---|---|---|---|---|---|
| D3 2006–2007 | 20.4 (6.2) | 19.2 | 2.3 | 3.4 | 2.9 | 2.5 | 6.0 | 0.7 | 0.8 | 2.0 |
| D3 2012–2013 | 27.3 (6.8) | 28.9 | 4.4 | 3.8 | 4.5 | 3.5 | 5.5 | 1.2 | 0.9 | 3.5 |
As a test of the TPI and scoring rubric, we sought out courses in which the instructors had published work showing they had spent multiple years investigating the use of different teaching practices while carefully monitoring student outcomes, and had achieved notable improvement. We found six such courses, spread across five institutions (two major research universities, two relatively small comprehensive universities, and one middle-tier research university) and three disciplines, including biology. We asked the six instructors to fill out the inventory. The hypothesis was that, if the ETP scores were capturing all or nearly all practices important for learning, these courses would have high ETP scores, providing another indication of validity, but if these courses had mid-range or lower ETP scores, it would indicate there must be important contributions to effective teaching that the TPI was missing. All of the instructors completed the inventory for us. Their ETP scores ranged from 46 to 57. The lowest of this set are extremely high compared with most courses for which we have data, while the top two scores are the highest we have ever seen. It is particularly notable that these top two scores, 54 and 57, were obtained in courses at comprehensive universities that have students with highly variable and relatively weak preparations and where the documented improvement in student outcomes achieved (Coletta, 2013; Adams et al., 2014) due to these multiyear efforts is spectacular.
IMPLICATIONS FOR INCREASING THE USE OF RESEARCH-BASED PRACTICES
Although the ETP score is useful for making general comparisons, the detailed information contained in the individual inventory responses by course is more useful for guiding improvements of teaching. The inventory can be valuable for instructors to use on their own for evaluating and improving their teaching; they can identify practices that they are not using and that have been shown to improve learning. For instructors who have made a serious effort to introduce research-based practices into their teaching, the inventory also provides a way they can quantify this for merit review or promotion.
At a departmental level, the TPI information reveals when there are instructors who are at odds with specific departmental or institutional norms. For example, it was a revelation to one department to learn that one long-time instructor did not employ graded homework assignments, while everyone else in the department did so automatically. As another example, in Table S1, course 12 stands out relative to the other courses in the department.
The category scores also identify courses that could be significantly improved by adopting practices in one or two categories that are the norm for the department as a whole. For example, Table S1 shows that course 2 is relatively high in all categories except for the course information it provides, while course 9 is high in most areas but is unusually low in terms of in-class activities. It can also be seen that in categories I and VII most of the courses score fairly well, but a few are noticeably lower than the average. We examined the full spreadsheet showing individual item responses for all the courses (which is too massive to include with this paper) to understand more precisely how these courses were different. The differences came from the combination of the lack of learning objectives provided to students and the lack of regular coordination and guidance meetings with the TAs. These are two practices that are both desirable and widely embraced by the department. These examples illustrate how the information provided by this inventory reveals straightforward and efficient ways to improve the teaching of courses in a department.
FURTHER WORK
We suspect that the inventory will be valid for use in other disciplines, at least in the engineering and social sciences. This is based on our impression that the teaching practices used in these disciplines are rather similar to those used in math and science. It would be straightforward to check that the wording of the items would be correctly interpreted by instructors from those disciplines and that the inventory includes the teaching practices used in those disciplines. As needed, items could be reworded and added. There are reasonable justifications for most of the scoring rubric that transcend the specific disciplines of math and science (Bransford et al., 2000; Pascarella and Terenzini, 2005; Ambrose et al., 2010).
It would be valuable to go beyond simply capturing whether or not a practice is used and determine the quality of implementation of that practice. We have studied the difficulties in reliably measuring the quality of implementation of the practices being used and found them to be very formidable—far more difficult than determining what practices were being used. In 2011–2012, the CWSEI had a team of ∼20 SESs who were experts (typically PhDs) in their respective science disciplines and who have had extensive training in science education research and practices (Wieman et al., 2010). They also had years of experience working with instructors and observing instructors teaching almost daily. They had interacted extensively with the students in the classes in which teaching practices were being changed, measuring their learning, interest, and engagement in a variety of ways. In short, they are far more qualified observers than anyone available to a typical academic department. These SESs were given the challenge of observing classes with which they were not familiar and evaluating the quality with which the instructor was implementing the teaching practices used. After trying to do this, the SESs concluded that they could not do so, except for detecting blatantly bad practices. Their conclusion was that to do a good evaluation of the quality with which the respective teaching practices are being used not only requires high levels of expertise in both the subject being taught and the teaching methods being used, but also considerable familiarity with the student population enrolled in the course. Fortunately, there is evidence showing that when regular instructors adopted research-based practices, the learning outcomes of their students substantially improved (Hake, 1998; Knight and Wood, 2005; Derting and Ebert-May, 2010; Hoellwarth and Moelter, 2011; Porter et al., 2013). We have also observed this many times in the CWSEI.
As much more extensive data are gathered on the teaching practices in use in STEM courses, for example, by widespread use of the TPI, it will be possible to carry out a more detailed analysis of the correlation between different practices and student outcomes under a range of conditions. This will allow a more refined scoring rubric to be created that is more precisely related to student outcomes. This will also allow the inventory to be refined to better capture what qualifies as effective use of a specific practice. For example, are there particular features that would make one student discussion board more beneficial than another, or are there certain midterm evaluation questions that evidence will show are particularly beneficial?
Another research direction that we are currently pursuing with collaborators is the development of a student version of the inventory. Comparisons of students’ and instructors’ inventory responses for the same course would likely provide valuable data on the students’ educational experiences and the level of communication between students and instructors.
SUMMARY
We have presented an inventory of teaching practices that provides a rich and detailed picture of what practices are used in a course. We also have presented a scoring rubric that gives a quantitative measure of the extent of use of research-based teaching practices that have been shown to result in improved student learning. We believe that this instrument will be a valuable tool for evaluating and improving undergraduate STEM teaching and, after further validation studies, will likely be useful in other disciplines as well. This inventory and scoring will need to be periodically updated to reflect future research on pedagogy and learning.
APPENDIX
FOOTNOTES
1The usual psychometric measures of a test instrument, such as Cronbach's alpha as a measure of reliability and discrimination indices for items, are not relevant in this case because of the nature of what is being measured. The standard educational test instrument is typically designed to measure a general construct, such as algebra proficiency, for which there is a specific theoretical value to be measured, and the various test questions are designed to be different approximate measures of that construct. Hence, there are an underlying assumption and test design criteria that there is some relationship both between performance on individual questions and between individual questions and performance on the test as a whole. That underlying assumption is the basis for looking at discrimination indices, item-response theory, Cronbach's alpha test of reliability, etc., as measures of how well the test is achieving its intended design goal. Those tests all compare, in various ways, correlations between responses to questions, individually or as a group. That underlying assumption of a theoretical relationship between the components because they target the same construct is not valid for the TPI. There is no theoretical quantity that one is attempting to measure nor any theoretical relationship between the different items. The TPI is like the list of different items to be tabulated to take inventory in a hardware store. While there may end up being some correlations between item values when one looks at the inventory results of several hardware stores, such as the number of hammers with the number of wrenches, those correlations have no relationship to the reliability or validity of the item list to be used in the inventory. Similar arguments apply to discrimination indices; it makes no difference whether or not the number of hammers is a good discriminator of the overall level of stock in the store, you still want to know how many hammers there are in every particular hardware store, and the same reasoning applies to the different items on the TPI. In future work, it may be interesting to examine correlations between responses to learn more about instructor behaviors and choices, but such correlations are not relevant to the reliability or validity of the TPI, so we do not discuss them in this paper.
2Peter Lepage, cochair of the PCAST subcommittee on undergraduate STEM education; Susan Singer, chair of the NRC study of discipline-based education research in science and engineering; and Michelle Smith, biology education researcher and a member of the University of Maine Center for Research in STEM Education.
3Although this is not identical to the version of the inventory shown in the Supplemental Material, we are confident these results would be nearly identical if that version had been used, as the changes from version 2 are very small, about half a dozen very minor word changes and the addition of one rarely chosen response option.
4The last question on the inventory asks how long it took to fill out the inventory. The time required also included the time faculty needed to respond to three additional UBC-specific open-ended questions: What do you see as the biggest barrier to achieving more effective student learning in the courses you teach? What changes could be made at UBC to help you teach more effectively? What changes could be made at UBC to increase your satisfaction/enjoyment of teaching? Approximately half the faculty members chose to provide answers to some or all of those questions.
ACKNOWLEDGMENTS
We are happy to acknowledge the assistance of all of the CWSEI SESs in this work, as well as the CWSEI departmental directors and many other UBC instructors who provided input. We are particularly grateful to Francis Jones and Brett Gilley for collecting the COPUS data. Michelle Smith, Peter Lepage, and Susan Singer provided helpful suggestions. This work was supported by UBC through the CWSEI.