Beyond the GRE: Using a Composite Score to Predict the Success of Puerto Rican Students in a Biomedical PhD Program
Abstract
The use and validity of the Graduate Record Examination General Test (GRE) to predict the success of graduate school applicants is heavily debated, especially for its possible impact on the selection of underrepresented minorities into science, technology, engineering, and math fields. To better identify candidates who would succeed in our program with less reliance on the GRE and grade point average (GPA), we developed and tested a composite score (CS) that incorporates additional measurable predictors of success to evaluate incoming applicants. Uniform numerical values were assigned to GPA, GRE, research experience, advanced course work or degrees, presentations, and publications. We compared the CS of our students with their achievement of program goals and graduate school outcomes. The average CS was significantly higher in those students completing the graduate program versus dropouts (p < 0.002) and correlated with success in competing for fellowships and a shorter time to thesis defense. In contrast, these outcomes were not predicted by GPA, science GPA, or GRE. Recent implementation of an impromptu writing assessment during the interview suggests the CS can be improved further. We conclude that the CS provides a broader quantitative measure that better predicts success of students in our program and allows improved evaluation and selection of the most promising candidates.
INTRODUCTION
Aware that Hispanics are far outpacing other minority groups in terms of population (National Science Board, 2012), Hispanic-serving institutions like Ponce Health Sciences University are addressing the growing need to train Hispanic researchers. Currently, Hispanics receive the fewest (8%) bachelor’s degrees in science and engineering (National Science Board, 2012). Further, only 3.2% of all science and engineering doctoral degrees awarded in 2009 went to Hispanics (1301 doctoral degrees, National Science Foundation [NSF]). NSF data reveal that, although there have been increases in minority enrollment in science graduate programs, the percentage remains significantly below their representation in the population (Hispanic, 7.1 vs. 11.9%, and black, 7.8 vs. 13.8%, respectively). While the roots of these disparities are multifactorial, a fundamental reason is that fewer such students are entering the science, technology, engineering, and mathematics (STEM) doctoral programs.
The Graduate Record Examination General Test (GRE), produced and administered by the Educational Testing Service (ETS), is required by the majority of graduate programs in the United States for selection and screening of applicants (FairTest, 2007). The utility, reliability, and relevance of the GRE to predict graduate school achievement and eventual success as a scientist has been the subject of debate (Enright and Giltorner, 1989; Miller and Stassun, 2014). It is becoming increasingly recognized that the GRE, although predictive of intellectual capacity, can be influenced by many other parameters unrelated to academic preparation and scientific performance, including socioeconomic status, gender, and ethnicity. This very concern was noted by GRE-using institutions that participated in a study conducted by the ETS specifically with respect to groups whose members have historical trends of poor performance (Walpole et al., 2002). In fact, GRE quantitative scores highly correlate with gender and race, negatively impacting both women and Hispanics among others (Miller and Stassun, 2014). In one study, bilingual Hispanic doctoral students scoring low on the GRE did extremely well on a similar test given in Spanish, leading the researchers to conclude that the culturally laden language of the GRE can also have a substantial impact on score (Bornheimer, 1984). It has thus been postulated that using the GRE alone as a “filter” or “cutoff” for selecting applicants contributes to a continuing underrepresentation of these groups in the graduate student body and the sciences as a whole. Concerns regarding the impact of GRE bias on student diversity have led to acceptance of members of underrepresented groups with substandard scores on the basis of other criteria. The ETS found that these institutions express concern that such other criteria may not be adequate predictors of success (Walpole et al., 2002). Therefore, the need for evidence-based indicators of quantitative application of other characteristics in admissions decisions remains more than a decade after the report was released.
Furthermore, the GRE may be of only limited use in predicting success in graduate programs, given that the PhD completion rate in STEM fields is 53% (Council of Graduate Schools, 2008). Perhaps this is reflective of data from both the ETS and other studies, which have shown a weak relationship between GRE scores and grades during graduate school (Morrison and Morrison, 1995). Additionally, the GRE may be most relevant for gauging potential for acceptable performance in the first year of course work (Burton and Wang, 2005). While some students leave graduate programs due to failure in first-year courses that may be foreshadowed by the GRE, others leave due to the inability to pass qualifying exams or complete a thesis dissertation (Walpole et al., 2002). The latter failures are some of the measures of graduate school performance that the GRE is unable to anticipate, as the exam does not account for other applicant characteristics such as persistence, motivation, and drive, which influence outcomes that better predict retention.
Applicants to our Biomedical Sciences PhD program are generally low-income, nonnative English-speaking residents of Puerto Rico who score below the 15th percentile on the GRE. In our experience, such limited criteria as grade point average (GPA) and GRE, commonly used by many programs as benchmarks for application review, are inadequate as predictors of success in our program. Cultural differences as well as English as a second language are likely contributing factors that reduce the discriminatory value of the GRE in our applicant pool. In addition, the predictive value of the GPA varies widely across institutions and programs of study. Therefore, we developed a composite score (CS) that uses measurable indicators of research aptitude to evaluate our incoming applicants; the CS complements the GRE and GPA and better identifies incoming candidates who are likely to succeed in our program. The goal of this study was to test the validity of our CS to predict the success of students in our graduate school.
Materials and Methods
Data Collection
Application records and interview reports were used to compile data to generate a CS for the 57 applicants admitted to our biomedical sciences PhD program from 2002 to 2011. Our doctor of philosophy degree in biomedical sciences is an integrated, interdepartmental program in the basic biomedical sciences that provides students with a broad-based, 2-yr curriculum, which includes histology, biochemistry, microbiology, physiology, pharmacology, and electives in special topics followed by advanced courses and dissertation research leading to a PhD degree. The demographic information for our student population is provided in Table 1. A CS was calculated for each student by assigning equal weight to each of the following categories: general GRE (combined quantitative, verbal, and analytical score), GPA from application, research experience, advanced course work or degrees, presentations, and publications. Advanced course work scored included graduate degrees attained, graduate-level courses or participation in a postbaccalaureate program (not leading to a degree), and accredited certifications or licenses earned beyond a bachelor’s degree (i.e., medical technologist). Advanced course work did not need to be in STEM disciplines, though students who were scored in this criterion indeed held advanced degrees or course work in STEM fields. Scores for publications were assigned regardless of order of authorship. Scores ranged from 1 to 3, with a higher score signifying greater merit (Table 2). For each applicant, sufficient data were pulled from the application; thus no files were eliminated because of insufficient numerical data. Because subjective criteria are not part of the CS, we did not use different independent scorers.
| Gender | 64.9% female (n = 37) and 35.1% male (n = 20) |
| Age | 25.59 yr (20–42 yr) |
| Undergraduate | 50.88% private; 43.86% public; 5.26% foreign |
| Component | 1 point | 2 points | 3 points | Score |
|---|---|---|---|---|
| GPA | <3.0 | 3.0–3.5 | >3.5 | (1–3) |
| GRE | ||||
| Verbal | <400 | 400–600 | >600 | Average of components (1–3) |
| Quantitative | <400 | 400–600 | >600 | |
| Analytical | <3 | 3–5 | >5 | |
| Research experience | ≤1 yr | >1 and <3 yr | ≥3 yr | (1–3) |
| Course work in medical sciences postbaccalaureate degree | None | No degree | Master’s degree | (1–3) |
| Presentations | ≤3 | 4–5 | >5 | (1–3) |
| Publications | <1 | 1 | >1 | (1–3) |
| Total score | 6–18 |
Use of the CS for Admissions
The admissions committee for our program is made up of students and faculty from the PhD program, the director of graduate studies, and an admissions officer. Each member is provided a table of applicant data (GPA, science GPA, GRE score, institution(s) attended, degrees earned or expected) for use during the interview. Candidates are interviewed by the admissions committee. Their CSs are calculated based on the application information, which is corroborated in recommendation letters and during the interview. The candidates are then ranked by highest CS, and admissions recommendations are made by the committee.
Statistics
Data were analyzed by using GraphPad Instat, version 3.0 (GraphPad Software, San Diego, CA). A p < 0.05 was considered to represent a statistically significant difference. The mean difference ± the SEM was used to assess the differences between groups using an unpaired t test with Welch’s correction for normally distributed variables. A Mann-Whitney U-test was used for abnormally distributed variables. Pearson’s r correlations were calculated.
RESULTS
Given the controversy surrounding the reliability and predictive validity of the GRE, we developed a CS to provide a more comprehensive metric for improved selection of applicants for admission to our PhD program in the biomedical sciences. For the CS, we evaluated and quantified other valuable factors, such as research experience, advanced course work and degrees, and presentations and publications, which provide more useful information for predicting success in our PhD program. To determine whether our CS could be used to better predict success in our program than the GRE, GPA, or science GPA, we compared CS, GRE, GPA, and science GPA for our students with their outcomes in our program over a 10-yr period from 2002 to 2011. CSs were calculated from applicant data in admissions materials, which include the application form, academic transcripts, résumé or curriculum vitae, and letters of recommendation. These records provided sufficient data for the CS analysis and allowed all applicant files to be included in our data set. The performance of enrolled students was determined by retention beyond the third year, completion of PhD, fellowships obtained, and time to the programmatic milestones of proposal defense and thesis defense.
Because most math and science majors who leave graduate school do so by the third year, we examined retention beyond the third year as a measure of success (Cassuto, 2013). By the third year, our biomedical PhD students have settled into their thesis laboratories and have taken their qualifying exams, important program milestones. First, we analyzed students’ GRE scores to see whether there was a correlation between student retention beyond the third year and higher GRE scores. As shown in Figure 1A, we found there was no significant difference in GRE scores of students who progressed beyond the third year and those who withdrew. Because our students typically score below the 15th percentile, the clustering of scores at the lower end makes the GRE a poor discriminator for our applicant pool.
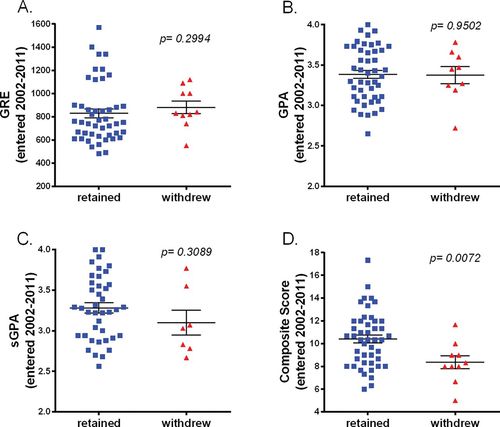
Figure 1. A higher CS predicts likelihood of remaining in the graduate program beyond the third year. No significant differences were found between those who stayed and those who withdrew when analyzed by GRE (A), GPA (B), or science GPA (sGPA; C). In contrast, those students who stayed in the program had a significantly higher CS (p = 0.0072; D).
GPA and science GPA likewise proved poor discriminators of promising applicants. As shown in Figure 1, B and C, there was no significant difference between the general or science GPAs of students who progressed beyond the third year and those who left the program. It is likely that variations in academic rigor and program of study across different academic institutions make the GPA a poor predictor of success for our graduate students. However, when we examined the CS, students who progressed in the PhD program beyond the third year had a significantly higher CS upon entry into the program than those who withdrew (Figure 1D). Although the GRE contributes to the calculation of our CS, when we compared the GRE with the CS we found no correlation (Figure 2A). Notably, when we removed the GRE points from the CS, the CS remained higher for students retained beyond the third year (Figure 2B), indicating that the GRE added little or no predictive value.
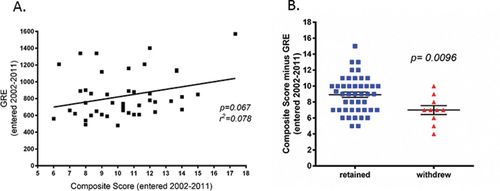
Figure 2. GRE adds little predictive value to the likelihood of remaining in the graduate program beyond the third year. No correlation was found between the GRE and the CS in those students who stayed in the program (A). Further, removing the GRE from the CS still predicts the likelihood of students being retained beyond the third year (B).
Our findings were similar when we analyzed PhD completion, which is one of the most important student outcomes. Students who continued and completed our PhD program had significantly higher CSs at time of entry than the noncompleters, whereas the GRE was similar in both groups (Figure 3, A and B). Comparable with our findings for retention, when we removed the GRE from the CS, there was still a significant difference between completers and noncompleters, indicating that the GRE added little or no predictive value of success in dissertation defense.
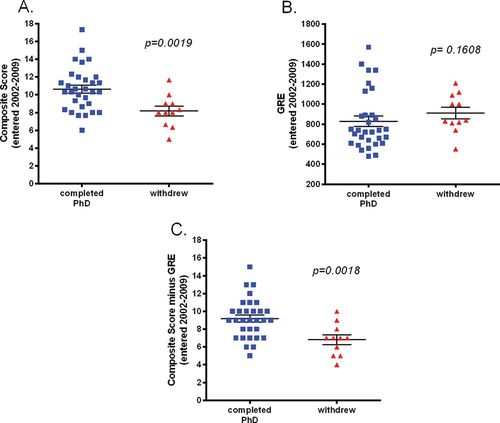
Figure 3. A higher CS predicts completion of the PhD program. Those students who completed the program had a significantly higher CS (p = 0.0019; A). GRE alone shows no significant differences between those completing and dropping out (B), whereas removing the GRE from the CS still predicts completion (p = 0.0018; C).
In graduate school and in the National Institutes of Health (NIH) career plan, fellowship history is an important predictor of success. Students in our program are highly encouraged to submit fellowship applications. This exercise develops and demonstrates core competencies of a successful scientist. In fact, trainees with grant or fellowship experience are more likely to become funded as independent researchers than their counterparts (Tabak, 2012). A demonstrated track record of funding also contributes to shortening the pathway to an independent scientific career (Tabak, 2012). Our students have been successful in securing individual fellowships from the American Physiological Society, the American Psychological Association, and the NIH. When we compared students who obtained fellowships with those who did not, we found that students who obtained fellowships had higher CSs at time of entry into our PhD program than students who did not obtain a fellowship (Figure 4A). In contrast, GRE scores were similar whether the student attained or did not attain a fellowship (Figure 4B). Even after the GRE points were removed (Figure 4C), the CS still predicted fellowship attainment, further supporting the GRE’s weak predictive validity.
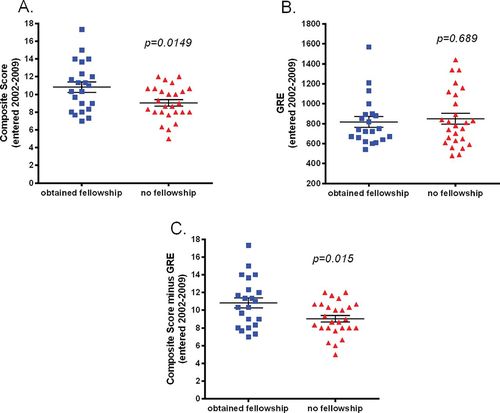
Figure 4. A higher CS predicts success in obtaining a fellowship. Students holding independent fellowships had a significantly higher CS at time of entry into the PhD program (p = 0.0149; A). GRE alone does not predict fellowship (not significant; B); however, removing the GRE from CS still predicts fellowship success (p = 0.015; C).
Time to degree is another important metric used to determine the success of students. Time to degree can vary based on the institution’s established duration of graduate study for doctoral programs, duration of student financial support, and other individual circumstances (loss of mentor, illness, family leave, etc.). Nevertheless, it is expected that more successful students will defend their theses sooner and enter postdoctoral training or other career opportunities. We found a negative correlation between the CSs and time to degree of our PhD students (Figure 5A). Students with a higher CS completed their thesis in less time than those with a lower CS, suggesting that the former were more successful. The correlation was maintained but weaker when we compared either the GRE or the CS minus the GRE with time to degree (Figure 5, B and C).
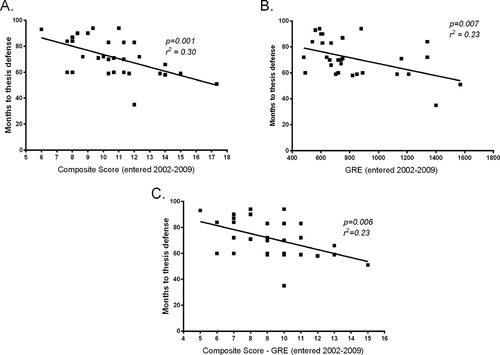
Figure 5. A higher CS predicts time to completion of the PhD. The higher the CS, the shorter the time taken to defend the thesis (p = 0.001; A). This relationship also holds for the GRE alone (p = 0.007; B) and if the GRE is removed from CS (p = 0.006; C).
In summary, our findings showed that the GRE did not predict retention, completion of the PhD degree, or attainment of fellowships for students in our program. In contrast, a higher CS did predict the same outcomes and showed a stronger correlation with shorter graduate school duration. These findings suggest that a tool such as the CS, which accounts for research experience, publications, presentations, and advanced course work or degrees without omitting GPA and GRE, can better predict successful outcomes in student populations who underperform on the GRE.
DISCUSSION
Our main findings are as follows: 1) the average CS was significantly higher for our students who progressed beyond the third year and completed the graduate program versus those who dropped out; 2) students who obtained an independent fellowship also had significantly higher CSs; 3) GPA, science GPA, or GRE did not predict completion of the graduate program or fellowship attainment; and 4) a higher CS correlated with a shorter time to thesis defense. The GRE did not predict these outcomes or add obvious predictive value to the CS. Thus, the use of a CS that measures other competencies and markers of achievement seems to be more effective than the GRE in predicting success in a graduate program with our student demographics. Although we developed the CS to evaluate our applicant pool, we feel it could easily be adopted by other institutions to evaluate incoming applicants. Our CS involves objective criteria commonly found in most applications to PhD programs. However, the categories and merit scores may need to be tailored to include additional evaluation criteria pertinent to a particular program.
Women and minority applicants consistently score lower on the GRE quantitative section than men and white applicants (ETS, 2011). In fact, the GRE is a better indicator of sex and skin color than of ability and ultimate success (Miller and Stassun, 2014). Therefore, GRE cutoff scores place women and underrepresented minorities at a disadvantage by limiting their access to graduate school. Ultimately this practice may contribute to the underrepresentation of this demographic in the STEM workforce. Moreover, screening applicants solely on GRE scores can impede the admission of otherwise promising young scientists. Students selected to our PhD program based on their CSs despite low GRE scores proved to be productive students. Analysis of our low-scoring applicants (< 800 total on the GRE) who were retained or completed the PhD showed that 79% contributed to one or more scientific publications and 73% received funding by a program or individual training grant. Further, of those low scorers who have already graduated, 42% continued on to postdoctoral training, and 47% obtained a faculty or nonacademic research position.
Several studies concluded that undergraduate students leave STEM programs mainly because of the nature and quality of science teaching and unfamiliarity with the science culture rather than lack of ability in science and math (Levin and Wyckoff, 1988; Carter and Brickhouse, 1989; Treisman, 1992; Seymour and Hewitt, 1997; McGee and Keller, 2007). Failure to retain outstanding candidates weakens the pipeline and ultimately reduces diversity of the STEM workforce and slows the United States’ ability to effectively compete on a global scientific scale.
A Council of Graduate Schools report identifies student selection as one of the key factors influencing student outcomes and PhD completion. Research by ETS indicates that the predictive validity of the GRE test is limited to first-year graduate course work. Students with strong scores and impressive grades still leave the pipeline; only 52% of U.S. STEM graduate students complete their PhDs (Council of Graduate Schools, 2008). Graduate school performance is multidimensional (Enright and Giltorner, 1989). There is increasing evidence that success in graduate school requires a number of qualities, including curiosity, motivation, persistence, goal orientation, and passion, that are not captured by GRE scores (Walpole et al., 2002). Therefore, graduate program admissions need better tools, like the CS, to assess other markers of achievement and personality measures to help recruit and retain diverse applicants with potential for long-term success as scientists and boost PhD completion rates.
In a study at the Mayo Clinic College of Medicine, characteristics like adaptability, independence, curiosity, enjoyment of problem solving, and desire to help or impact others predicted persistence into PhD and MD/PhD training (McGee and Keller, 2007). Some institutions are now beginning to recognize the importance of trying to identify the other “elusive” factors that contribute to student success in graduate school. The approach at Fisk-Vanderbilt includes structured interviews, intensive mentoring, and eliminating standardized test scores as a criterion for admission. In their interviews, they screen for the “grit factor,” a predisposition for pursing long-term, challenging goals with passion and perseverance (Powell, 2013).
Graduate school admission is just one part of the success equation. After admission to a STEM doctoral program, there are other criteria that contribute to success, such as program environment, research experience/scientific progress, family and financial support, and mentoring. Through the Research Initiative for Scientific Enhancement (RISE) program, a student-development training program granted by the National Institute of General Medical Sciences (NIGMS), we are addressing some of these issues by providing continuous team-based and individual mentoring, hands-on professional development and research training, advanced instruction in communication and writing, multiple networking opportunities, and financial support.
Since developing the CS, we have revised it by adjusting the scale to include 0, thereby assigning value when the criterion is none and better distributing the value. Looking to the future, we envision improving the CS further by incorporating additional indicators, such as a formal evaluation of the interview performance and writing skills through assessment of an impromptu essay. Given the importance of publications, grant applications, and presentations, writing is continually ranked as one of the most sought-after skills by STEM employers. We are also considering improving our CS by assigning different weights to the various components. For example, more weight could be given to first-author publications or participation in formal postbaccalaureate programs, since these items reflect greater participation in research. Additionally, we plan to track our alumni through postdoctoral training and attainment of positions in academia and industry to evaluate the predictive value of the CS for their future career success.
ACKNOWLEDGMENTS
We thank Dr. Pedro Santiago for comments on the manuscript. This work was supported by MBRS-RISE 1R25 GM 0820406 from the NIGMS. The content is solely the responsibility of the authors and does not necessarily represent the official views of the NIH.


