Error-Discovery Learning Boosts Student Engagement and Performance, while Reducing Student Attrition in a Bioinformatics Course
Abstract
We sought to test a hypothesis that systemic blind spots in active learning are a barrier both for instructors—who cannot see what every student is actually thinking on each concept in each class—and for students—who often cannot tell precisely whether their thinking is right or wrong, let alone exactly how to fix it. We tested a strategy for eliminating these blind spots by having students answer open-ended, conceptual problems using a Web-based platform, and measured the effects on student attrition, engagement, and performance. In 4 years of testing both in class and using an online platform, this approach revealed (and provided specific resolution lessons for) more than 200 distinct conceptual errors, dramatically increased average student engagement, and reduced student attrition by approximately fourfold compared with the original lecture course format (down from 48.3% to 11.4%), especially for women undergraduates (down from 73.1% to 7.4%). Median exam scores increased from 53% to 72–80%, and the bottom half of students boosted their scores to the range in which the top half had scored before the pedagogical switch. By contrast, in our control year with the same active-learning content (but without this “zero blind spots” approach), these gains were not observed.
INTRODUCTION
Increasing and diversifying the number of college graduates successfully completing their degrees in science, technology, engineering, and mathematics (STEM) is a national priority (President’s Council of Advisors on Science and Technology, 2012). This workforce challenge is relevant both within STEM majors such as computer science, in which women and minorities are underrepresented (National Research Council [NRC], 2011; National Academies of Sciences, Engineering, and Medicine, 2016), and for “cross-training” between STEM fields (e.g., science majors need to learn computational skills in areas such as bioinformatics; Zatz, 2002; Ranganathan, 2005; Donovan, 2008; Lewitter and Bourne, 2011). STEM education ideally needs to reach students both from diverse backgrounds and also across disciplinary boundaries (Schneider et al., 2010).
One major challenge to achieving this goal is the difficulty of teaching conceptual understanding and reasoning (as opposed to other skills such as memory and trained procedures; Mazur, 1997). Real-world problem solving requires students to do more than simply recapitulate exercises done in class. Instead, they must think for themselves about how to use the concepts correctly in novel situations. In real life, they will likely find themselves working on quite different applications in which robust knowledge transfer (Halpern, 1998; van Gelder, 2005) is the key to success. Unfortunately, teaching students this skill set is easier said than done. Core concepts are often a critical barrier to entry for students (Loertscher et al., 2014), especially when they go outside a given student’s field and “comfort zone” (e.g., when biology students in a bioinformatics course struggle with statistics concepts). These barriers can cause both student attrition (failure to complete a course) and poor conceptual understanding despite completion of a course. In particular, study after study has shown that conventional lecture courses typically leave students with serious misconceptions on about half the core concepts in a course (Hestenes et al., 1992; Crouch and Mazur, 2001; Smith et al., 2008; Shi et al., 2010).
Active learning has emerged as an important teaching approach that can address these barriers to student learning. It focuses on moving students from passively receiving and replicating instruction to actively using, testing, and formulating what they are learning for themselves (NRC, 2012; Freeman et al., 2014). Shifting college teaching to this student-centered format can lead to large increases in student learning (Crouch and Mazur, 2001; Knight and Wood, 2005; Michael, 2006), although this is by no means an automatic recipe for success (Andrews et al., 2011). Many studies have reported that active-learning approaches boost student engagement, improve conceptual understanding, reduce the achievement gap for underrepresented groups in STEM, and increase persistence in STEM majors (Walczyk and Ramsey, 2003; Deslauriers et al., 2011; Haak et al., 2011; Gasiewski et al., 2012; Watkins and Mazur, 2013; Freeman et al., 2014). However, despite the evidence of the benefits of active learning, and national recommendations that it should be the norm in college classrooms (Kober, 2015), barriers persist to changing teaching practices and achieving large-scale improvements in STEM education. For instance, many research-focused faculty cite having insufficient time, incentives, or support to engage in instructional development (Dionisio and Dahlquist, 2008; Fairweather, 2008; Buttigieg, 2010; Austin, 2011; Henderson et al., 2011). Even motivated instructors who overcome these barriers and try to implement reforms often fail to sustain them over time (Ebert-May et al., 2011; Kober, 2015). It therefore may be useful to ask what makes it so hard for faculty to implement active learning successfully and sustainably.
One possible answer is that active learning is in a sense an empty container, in that it does not become truly effective unless filled by the instructor with exercises that zero in on precisely the conceptual obstacles that students need to overcome (Andrews et al., 2011). We will refer to such obstacles generically as misconceptions, or scientifically inaccurate ideas about a concept (Andrews et al., 2012). As this study will demonstrate, we can detect student misconceptions as any erroneous application of a concept during problem solving. Many studies have shown that the average student has misconceptions on about half the concepts in a STEM course, and different students may have different misconceptions on the same concept (Hestenes et al., 1992; Crouch and Mazur, 2001). Figuring out how to identify these conceptual obstacles, let alone enabling students to overcome them, is a difficult empirical problem that many instructors are not trained to address, nor are they necessarily equipped technologically to do so for every individual student in a large class.
In practice, both instructors and students suffer serious blind spots, which we will define as anything that blocks an individual from identifying a necessary next step for successful learning. For example, instructors typically cannot see what every student is actually thinking on each concept in each class, and hence may not identify specific misconceptions that block many students. Such blind spots make it hard for instructors to know precisely what instructional materials students actually need and place an excessive burden on instructor experience, insight, and trial and error. Similarly, students often cannot tell whether their thinking is right or wrong, let alone exactly how to fix it. Whereas the same “right answer” can be broadcast to every student (one-way communication), different students will have different misconceptions to identify and address, and that requires two-way communication (Smith et al., 2009). Unless a course provides a reliable way for all students to accomplish that while they are still working on solving the problem, student engagement is not merely blocked but drained of incentive—because it does not provide a pathway forward for the student (Posner et al., 1982; Leonard et al., 2014). Thus, blind spots can impede student engagement, by blocking the two-way communication necessary for figuring out what the individual student needs to do next.
How significant an obstacle do such blind spots pose to instructors? The well-established field of concept inventories provides several insights. Concept inventories are multiple-choice tests for assessing conceptual understanding of a specific topic and are widely considered the “gold standard” for measuring conceptual learning gains (Garvin-Doxas et al., 2007; D’Avanzo, 2008; Smith and Tanner, 2010; Campbell and Nehm, 2013). When developing these assessment instruments, researchers do seek to identify common student misconceptions within a topic, because these are essential for designing plausible wrong answers in multiple-choice questions. Unfortunately, this adds greatly to the cost and effort of developing a concept inventory for a given topic, commonly a multiyear and potentially expensive process (D’Avanzo, 2008; Adams and Wieman, 2011). This highlights several problems. First, such an effort is beyond the resources of a typical instructor seeking to adopt active learning. Second, the formulation of concept inventories as multiple-choice questions is not designed to discover novel misconceptions, but only to survey known misconceptions. Third, if no concept inventory exists for a topic, how is an instructor supposed to discover, de novo, the specific misconceptions that block student learning?
These considerations suggest that instructors using active learning need efficient and scalable ways of solving blind spots in their courses, and that students’ wrong answers may provide a more important learning opportunity than their right answers—because wrong answers expose important student misconceptions that instructors must address (NRC, 2005; Klymkowsky and Garvin-Doxas, 2008; Ambrose et al., 2010). We have sought to test these ideas by implementing a data-driven, Web-based error-discovery learning cycle both in class and online (Courselets.org, which is a free, open-source platform for STEM instructors to share and reuse active-learning exercises), consisting of the following stages (Figure 1; Supplemental Video):
Stage 1. Real-world “target problems” (instructor asks question): To efficiently identify misconceptions with the biggest impact on real-world performance, we followed two “sampling principles” for selecting problems to use as active-learning exercises. First, the instructor sampled real-world problems that were representative of the course’s conceptual learning objectives (“after this course, students should be able to solve target problem X”). Second, to measure students’ ability to transfer their learning to novel situations (as in real-world problem solving), target problems had to be problem types or situations not previously covered in the course. Students should not be able to solve a target problem via a previously trained procedure, but only by original thinking about the concept’s implications in a novel situation.
Stage 2. Open-response concept testing (ORCT; students submit answer): Instead of giving students multiple-choice answers to choose from, the instructor challenged each student to articulate his or her own solution to the target problem and to briefly explain the thinking that led to this answer. Students wrote their answers in class on their laptops or smartphones, and the instructor was able to see student responses in real time and later mine them from a database in a variety of ways. By running an ORCT exercise (∼10 minutes) immediately after introducing a new concept, the instructor could see what every student was actually thinking about how to use each concept.
Stages 3–5. Self-assessment and peer instruction (students discuss in pairs; instructor discusses answer; students self-assess): Students also performed a number of self-assessment and peer instruction steps comparing their own thinking against that of their peers and the expert answer. This design gives students constant exercise and feedback on the metacognitive skills of articulating, reflecting, comparing, and critiquing conceptual arguments, highlighting the importance of these skills for real-world problem solving. Students directly experience that transferring a concept to solve real-world problems always requires such “reflective thinking” (NRC, 2000).
Stage 6. Error identification (known error?): Students who made errors were automatically asked by the system whether their errors matched any of the known misconceptions in the database, with the aim of helping each student identify his or her specific misconception(s) within 1 minute of his or her initial answer. The known misconceptions for a given target problem are presented to students as first-person, single-sentence statements so they can easily recognize whether that was what they were thinking (e.g., “I thought that p-values can be multiplied if they are independent”). In Courselets, these data give the instructor an immediate prioritization of the specific misconceptions that blocked the largest numbers of students.
Stage 7. Error discovery (instructor categorizes error): Random samples of “novel” student errors (i.e., student self-assessments that reported their answers as both incorrect and not fitting any existing misconception) were periodically analyzed by the instructor to discover new misconceptions, which were categorized and added to the database. We recommend analyzing an initial sample as soon as 10% of students have answered a question, because this is sufficient to identify four to five distinct misconceptions covering on average 80–90% of all student errors (see Supplemental Figure 1). When an instructor submits four to five such error models to Courselets within 2 hours of the first 10% of students completing the question, the majority of these students’ misconceptions are directly addressed in that rapid timeframe, and all subsequent students answering the question will receive these error identifications immediately (as soon as they submit their answers). While such “immediate resolution” is the ideal, and is both practical and scalable, a slower error-discovery process (2–5 days) can still produce large benefits (e.g., see the data in this study for 2011).
Stage 8. Error resolution: For each such error, the system immediately directed the student to specific “error-resolution” lessons showing precisely why it is wrong, and how to address it, as exercises with multiple forms of evidence lead students to test and reorganize their thinking (Posner et al., 1982; Leonard et al., 2014). The system then assessed whether further help was needed. In Courselets, these data give the instructor a prioritization of the specific misconceptions that still confuse the most students—that is, where students need additional error-resolution lessons to help them overcome a misconception.

FIGURE 1. Stages of the error-discovery learning process. Students answer challenge problems by writing text on their laptops or smartphones and then briefly discuss their answers in pairs, before assessing their individual answers against the correct answer and against known conceptual errors that have been previously observed on that question (see the text for more details). Optional stages that can be performed outside class (online) are highlighted in yellow.
We refer to this cycle as error-discovery learning (EDL) because it focuses the bulk of each student’s learning effort on discovering and resolving his or her specific conceptual errors (Figure 1). Note that, at present, Courselets enables students to do all EDL stages both online or in class, except for stage 3 (in class only) and stages 7 and 8 (online only).
For this study, we evaluated the impact of EDL on student learning and retention in an elective, upper-division bioinformatics course over a period of 4 years (2011–2015) compared with its previous baseline, in which the course was taught without EDL (2003–2009). This is a course on probabilistic modeling theory and algorithms with bioinformatics applications. It is offered to both undergraduate and graduate students, with the latter completing more challenging assignments and exams. For historical reasons, this course is offered through several departments (under multiple “cross-listings”; see Supplemental Table 1). The course has moderate enrollment, averaging 66 students during 2011–2015, split approximately equally into undergraduate and graduate students.
As summarized in Table 1, the course was taught using conventional lectures from 2001 to 2008, and then switched to a Socratic format (Prince and Felder, 2006) by asking students questions, first verbally (2009) and later (2011–2015) by having students type text answers explaining their thinking through their laptops or smartphones. The same instructor (C.J.L.) taught the course over its entire history. Overall, from 2001 to 2015, the course became more rigorous, mathematical, and computationally challenging. During the period most relevant to this study (2008–2015), however, the course content remained constant (with the exception that one subtopic was added), and the cognitive demand of exams was consistent from year to year (for undergraduates, the main focus of this study).
| Year | Major changes in course format |
| Conventional lecture (pre-EDL) | |
| 2001 | Offered as standard lecture course (Chem 160/260) |
| 2007 | Cross-listed in computer science (CS 121/221); statistics and programming prerequisites added |
| Transition to active learning, stage 1 (pre-EDL) | |
| 2009 | Switched pedagogy to Socratic format, posing questions and soliciting student answers verbally; switched from “grading on the curve” to grading on the historical curve (see Discussion); increased class time from 2 to 4 hours per week |
| 2010 | Course not offered |
| Transition to active learning, stage 2 (EDL) | |
| 2011 | Switched to using in-class question system (Socraticqs) that enabled each student to answer target problems by typing text on a laptop or smartphone; began clustering distinct conceptual errors made by students for each question |
| 2012 | Identification of conceptual errors incorporated into EDL self-assessment process |
| 2014 | Course not offered |
| Transition to active learning, stage 3 (EDL) | |
| 2015 | Switched course to online e-learning platform (Courselets.org) |
METHODS
This study used data from more than 10 years of the bioinformatics course to examine the effectiveness of EDL on student academic performance, engagement, and attrition. This course is cross-listed in several departments (chemistry, human genetics, bioinformatics, and computer science; see Supplemental Table 1) and enrollment is available for both undergraduate and graduate students. Beginning in 2011, separate assignments and exams were given to the two groups. Data sources used in this study include student course records, the registrar’s database, instructor communications and records, classroom observations, recorded lectures, and course exams. Throughout 2008–2015, the class was recorded on video, all course material changes were tracked by a distributed version-control system (Git), and student EDL response data were stored in databases (Sqlite3 2011-3; PostgreSQL 2015). All human subject protocols in this study were reviewed and approved by the University of California, Los Angeles (UCLA), Institutional Review Board (IRB #14-001129).
Classroom Activities Analysis
The instructor (C.J.L.) provided lecture recordings for five years: 2008, 2009, 2011, 2012, and 2013. The Classroom Observation Protocol for Undergraduate STEM (COPUS) developed by Smith et al. (2013) was used to document time use in the classroom. The original protocol was designed to document student and instructor activities such as lecturing, listening, asking and answering questions, group activities, and the use of student response systems (e.g., clickers) with follow-up discussion (Lund et al., 2015). The protocol was modified to include EDL activities in place of clicker activities. Recorded lectures consisted of the instructor’s voice, PowerPoint slides, digital images of overhead transparencies, and computer screen captures, as opposed to a full view of the classroom, and therefore the protocol was modified to focus on only those instructor activities that could be accurately characterized by COPUS within the limits imposed by the audio and video recordings. Interrater reliability (Cohen’s kappa = 0.82) was measured using lecture recordings from 2013.
For establishment of a representative sample of course activities before, during, and after the transition to EDL (Landis and Koch, 1977; Smith et al., 2013), three recorded class sessions corresponding to weeks 3, 6, and 10 from 2008, 2009, 2011, and 2013 were each coded by three independent observers (B.T.-L., C.S., M.S.). Descriptive statistics were used to illustrate the range of activities taking place at 2-minute intervals during each class session. During Fall term 2015, the COPUS protocol was applied to live observations of classroom sessions. For consistency, observations were conducted during weeks 3, 6, and 10 for a total of six observations by three independent observers.
Attrition Rate Analysis
Course attrition rates, defined as the proportion of students that either drop or withdraw from a course or who do not earn a passing grade, were measured from 2003 to 2015 using course data from the registrar and the instructor (C.J.L.). Final enrollments for each year from 2003 to 2015 were obtained from the registrar. Week 1 enrollment data were drawn from a variety of sources, because the registrar did not begin retaining week 1 enrollments until 2010. For 2003, the data were derived from the instructor’s printed week 1 roster. From 2004 to 2009, data were obtained from email records of week 1 enrollment counts, and permission to enroll (PTE) requests from students seeking to enroll in the course. Attrition rates obtained from PTE requests track with attrition rates from complete week 1 rosters and/or registrar data for years 2003 and 2011–2015, thus validating PTE requests as a measure of attrition rates. Week 1 enrollments from 2011 to 2015 were obtained directly from the registrar. Fisher’s exact test is the standard statistical test for whether the frequency of a Boolean event (e.g., drop vs. complete a course) is the same in two samples. To test the null hypothesis of no change in attrition rate, we used the one-tailed Fisher’s exact test, computed from the hypergeometric distribution using the scipy.stats software package. As a validation of our week 1–10 attrition results, we also obtained registrar enrollment data from the end of week 3 for the entire period (2003–2015). These data independently demonstrate the statistical significance of attrition reductions during this period (see Tables 2 and 3).
 |
 |
Registrar data were used to obtain student demographic information, including race/ethnicity, gender, Scholastic Aptitude Test (SAT) scores, and high school grade point average to consider any differences in enrollment patterns attributed to particular background characteristics. A subset of graduate students were excluded from the attrition rate analysis if Bioinformatics 260A was a required course for their degree programs, because these students were not allowed to drop the course. Data for 2010 and 2014 were not included, because the instructor was on sabbatical during those two terms. Descriptive statistics were used to examine the percentage of students who dropped the course during the first 3 weeks of the quarter as well as the overall course completion rate.
Learning Outcomes Assessment
Students’ academic performance was examined before, during, and after the implementation of EDL. Throughout 2008–2015, the exam questions followed a consistent open-response format (like that of in-class ORCT questions). Midterm and final exam scores were collected from the instructor for available years between 2008 and 2015, and mean exam scores were calculated to look for changes in student performance across years. Graduate students enrolled in Bioinformatics 260A were excluded from this analysis. To check for differences in academic experiences before college, we used one-way analysis of variance with Bonferroni post hoc criterion for significance (Mitchell and Jolley, 2012), and no significant differences were found in SAT math and verbal scores for undergraduate students from 2008 to 2015.
To account for potential differences in rigor associated with exams, an external content evaluator, who had an advanced degree in computer science and had previously served as a graduate student teaching assistant for the bioinformatics course, categorized each exam question using Bloom’s taxonomy (Anderson et al., 2001; Semsar and Casagrand, 2017). This cognitive framework is composed of six levels of conceptual knowledge, with each level corresponding to various intellectual operations that a student can be asked to perform. The three lower levels (remember, understand, and apply) are grouped together as lower-order cognitive skills (LOCS) and the three higher levels (analyze, evaluate, and create) as higher-order cognitive skills (HOCS) (Zoller, 1993; Crowe et al., 2008). We classified each exam question as demanding LOCS versus HOCS following the framework described by Lemons and Lemons (2013), which also considers three additional dimensions of rigor: 1) the length of time required to complete a question (estimated to be at least twice as long as the content expert); 2) the degree of prior experience students had practicing the skills or applying the concepts required to solve similar types of problems (evidenced by a review of lecture materials and other class assignments preceding the exams); and 3) the content expert’s rating of question difficulty, here in terms of whether it required students to perform genuine knowledge transfer (e.g., use a concept in a new context), versus using a concept in a context similar to their prior experience in the course, versus simple recall. This delineation was especially helpful in consistently differentiating questions spanning the two midlevels of Bloom’s taxonomy (apply and analyze), which represent the transition in the framework from lower- to higher-order intellectual operations. To measure cognitive demands of exam questions by year, we calculated the percentage of HOCS questions by combining tallies from a midterm and final exam across the 6-year study period (2008–2015). To validate this metric of exam rigor, we compared it with the standard difficulty index (P, percentage of students who answered the question correctly; Wood, 1960) on exam data from 2013, the only year for which we had exam scores broken down by individual question part. We found that increasing cognitive rigor (%HOCS) strongly correlates with decreasing P index value, that is, fewer students answer correctly (Pearson correlation coefficient of −0.619).
RESULTS
Boosting Student Engagement
The course first switched away from a conventional lecture format in 2009, with the instructor posing questions and calling on individual students to answer verbally. Basic measures of student engagement in class increased considerably: COPUS scoring of classroom video recordings (see Methods) showed that the number of times students volunteered to answer questions increased from 0.2 per class (2008) to 21.3 per class (2009), and the number of questions that students asked the instructor increased from 4.0 per class (2008) to 11.0 per class (2009). However, no improvement in learning outcomes was apparent: mean undergraduate exam scores were 56.5% in 2008 and 54.1% in 2009. In 2009 it appeared that only a small number of students, mostly graduate students, were answering most of the questions, with most undergraduates in the class answering few if any. Thus, the increase in apparent engagement seems mainly to have increased the gap between the most engaged students versus the rest of the class.
A second stage of the transition to active learning began in 2011, using a Web-based system in which all students were directed to individually answer each question in class by typing their answers in a Web browser on their laptops or smartphones. To do this, we developed an experimental in-class question system Web server (Socraticqs) that allowed us to rapidly prototype and test open-response concept-testing protocols. That is, instead of posing closed-ended, multiple-choice questions, the instructor asked open-ended questions designed to elicit student explanations of their thinking in their own words. In addition to training students to articulate, compare, and evaluate conceptual arguments, this process was intended to discover novel conceptual errors directly from student response data and then to provide each student with “error-resolution lessons” addressing their individual misconceptions via exercises with multiple forms of evidence. In 2011, the basic EDL cycle was implemented (Figure 1), with error-resolution lessons being presented by the instructor as slides in the next class session. In 2012, the Web-based Socraticqs system was extended to automatically ask students whether they made any of the previously identified conceptual errors, and error-resolution lessons were presented as online videos for students to view outside class (940 views total). For 2011–2013, students could access the EDL system only in the classroom as part of the instructor-led class discussion. Hence, during those years, all EDL stages were done in the classroom. In 2015, Socraticqs was replaced by a fully online platform (Courselets.org) that enabled students to do EDL exercises either strictly in class, or in class with online follow-ups (e.g., error-resolution lessons), or entirely online.
This second stage produced even bigger increases in student engagement (Figure 2). The mean number of target problems answered by each student during class increased from 14 in 2009 (including graduate students; the mean for undergraduates was likely much less) to more than 30 for undergraduates in 2011, and approximately 60 for undergraduates in 2015 (a time effort equivalent to approximately 40% of the total course hours). Perhaps more importantly, in 2011–2015, this increase in class participation involved essentially all of the students. For instance, in the first year of EDL (2011), 90% of undergraduates answered more than both the estimated median in 2009 for undergraduate plus graduate students (seven target problems) and the mean in 2009 (14 target problems). This number approximately doubled over the study period; by 2015, 90% of undergraduates were answering 30 ORCT questions or more per student. It is useful to compare the number of questions answered by the least engaged students versus most engaged students. In 2009, it appeared that about a quarter of students answered no questions at all, while at the opposite end of the engagement spectrum, another quarter of students likely answered more than 20 questions per student. During the EDL period, this disparity diminished markedly. In 2011, the least engaged quartile answered 16 questions per student, while the most engaged quartile answered 53 questions per student, a ratio of 3.3. In subsequent EDL years, the disparity ratio was even lower: a ratio of 2.0 in 2012, 2.8 in 2013, and 2.5 in 2015. A second measure of disparity can be obtained by comparing the number of questions that each undergrad in the class answered and the number that each graduate student answered. In 2009 and prior years, graduate students dominated the answering of questions in class, and undergraduates answered few questions. In 2011, that disparity greatly diminished, and largely disappeared in 2012–2015, with undergraduates each answering as many questions as the graduate students (see Figure 2).

FIGURE 2. Increasing student engagement in answering target problems in class. Cumulative distribution functions for the number of questions answered by each student in class, before (2008, 2009) and after (2011–2015) the switch to EDL, for undergraduates (UG, solid lines) and graduate students (G, dashed lines). Thus, a point (x,y) on the graph for a given year means that y percent of students answered x questions (or fewer) that year. For 2008 and 2009, in the absence of individual counts for each student, we simply plotted the mean number of questions answered per student.
We also observed an increase in the number of questions that students asked the instructor during class, from an average of 4.0 per class in 2008 and 11.0 per class in 2009, to 13.7 per class in 2011–2015. To obtain a complete picture of class time usage (Figure 3), we performed COPUS coding (Smith et al., 2013) of classes as a retrospective study from 2008 to 2013 (using video recordings) and a live classroom observation study in 2015. Overall, these data are consistent with a transition from a conventional lecture format to active learning. Specifically, whereas lecturing constituted 85% of class time in 2008, it dropped to 60% in 2009, and to around 33% of class time in 2011–2015.

FIGURE 3. COPUS analysis of class-time usage. The total fraction of instructor time spent on lecturing, answering questions, and so on, as defined specifically by COPUS before (2008, 2009) and after (2011, 2013, 2015) the switch to EDL.
Impact on Learning Outcomes
To assess EDL’s impact on student performance, we compared undergraduate exam score trends with an external evaluator’s rating of the cognitive rigor of exams (Figure 4). Mean student scores increased markedly after the introduction of EDL (2011–2015), even though exam cognitive rigor remained as high or higher than pre-EDL (2008–2009). Throughout 2008–2015, the instructor tried to maintain the same level of cognitive rigor on undergraduate exams to allow a direct comparison of exam scores as a measure of student learning across this time period. To directly measure cognitive rigor for each year’s exams, an external evaluator used Bloom’s taxonomy to classify all exam questions (Anderson et al., 2001; Lemons and Lemons, 2013; Semsar and Casagrand, 2017) as requiring either LOCS or HOCS (Zoller, 1993; Crowe et al., 2008). Combining tallies from the midterm and final exam yielded the percentage of HOCS questions for each year in the study period (2008–2015; Figure 4). The percentage classified as HOCS gradually increased from 54–57% of questions pre-EDL (2008–2009) to 53–74% of questions during EDL (2011–2012 and 2015). Together, these data show that the level of cognitive rigor of the undergraduate exams was the same (or greater) during the EDL period compared with the pre-EDL period, providing a conservative basis for interpreting any observed increases in exam performance as indicative of actual improvement in student learning outcomes. We wish to emphasize that we are by no means suggesting that EDL is the sole factor influencing these exam scores. For example, during the years 2011–2015 (all of which used EDL), increasing cognitive rigor (%HOCS) appears to correlate with decreasing exam scores in Figure 4.

FIGURE 4. Undergraduate exam cognitive rigor versus student performance. Independent assessment of exam cognitive rigor (%HOCS, rated as the percent of questions requiring HOCS in Bloom’s taxonomy) before (2008, 2009) and after (2011–2015) the switch to EDL, versus the mean undergraduate exam score each year.
Similar to the engagement data, the undergraduate exam score distributions for each year within the study period of 2008–2015 (Figure 5) seem to show an even greater benefit of EDL for lower-scoring students than for top-scoring students. For example, the top exam score per year increased from around 83% (pre-EDL) to around 90% (EDL), a ratio increase of 1.08. By contrast, the 10th-highest exam score per year increased from around 47% (pre-EDL) to around 80% in 2012–2015 (EDL), a ratio increase of 1.70. Similarly, the bottom half of the exam scores per year increased from a mean of 42% (pre-EDL) to a mean of 65% (EDL), a ratio increase of 1.55. Roughly speaking, under EDL, the bottom half of the exam scores per year moved up into the range of the top half of the exam scores per year pre-EDL.

FIGURE 5. Undergraduate exam scores distributions. The percentage of students scoring above a given exam score before (2008, 2009) and after (2011–2015) the switch to EDL. Thus, a point (x,y) on the graph for a given year means that y percent of students obtained an exam score of x or higher that year.
Impact on Student Attrition
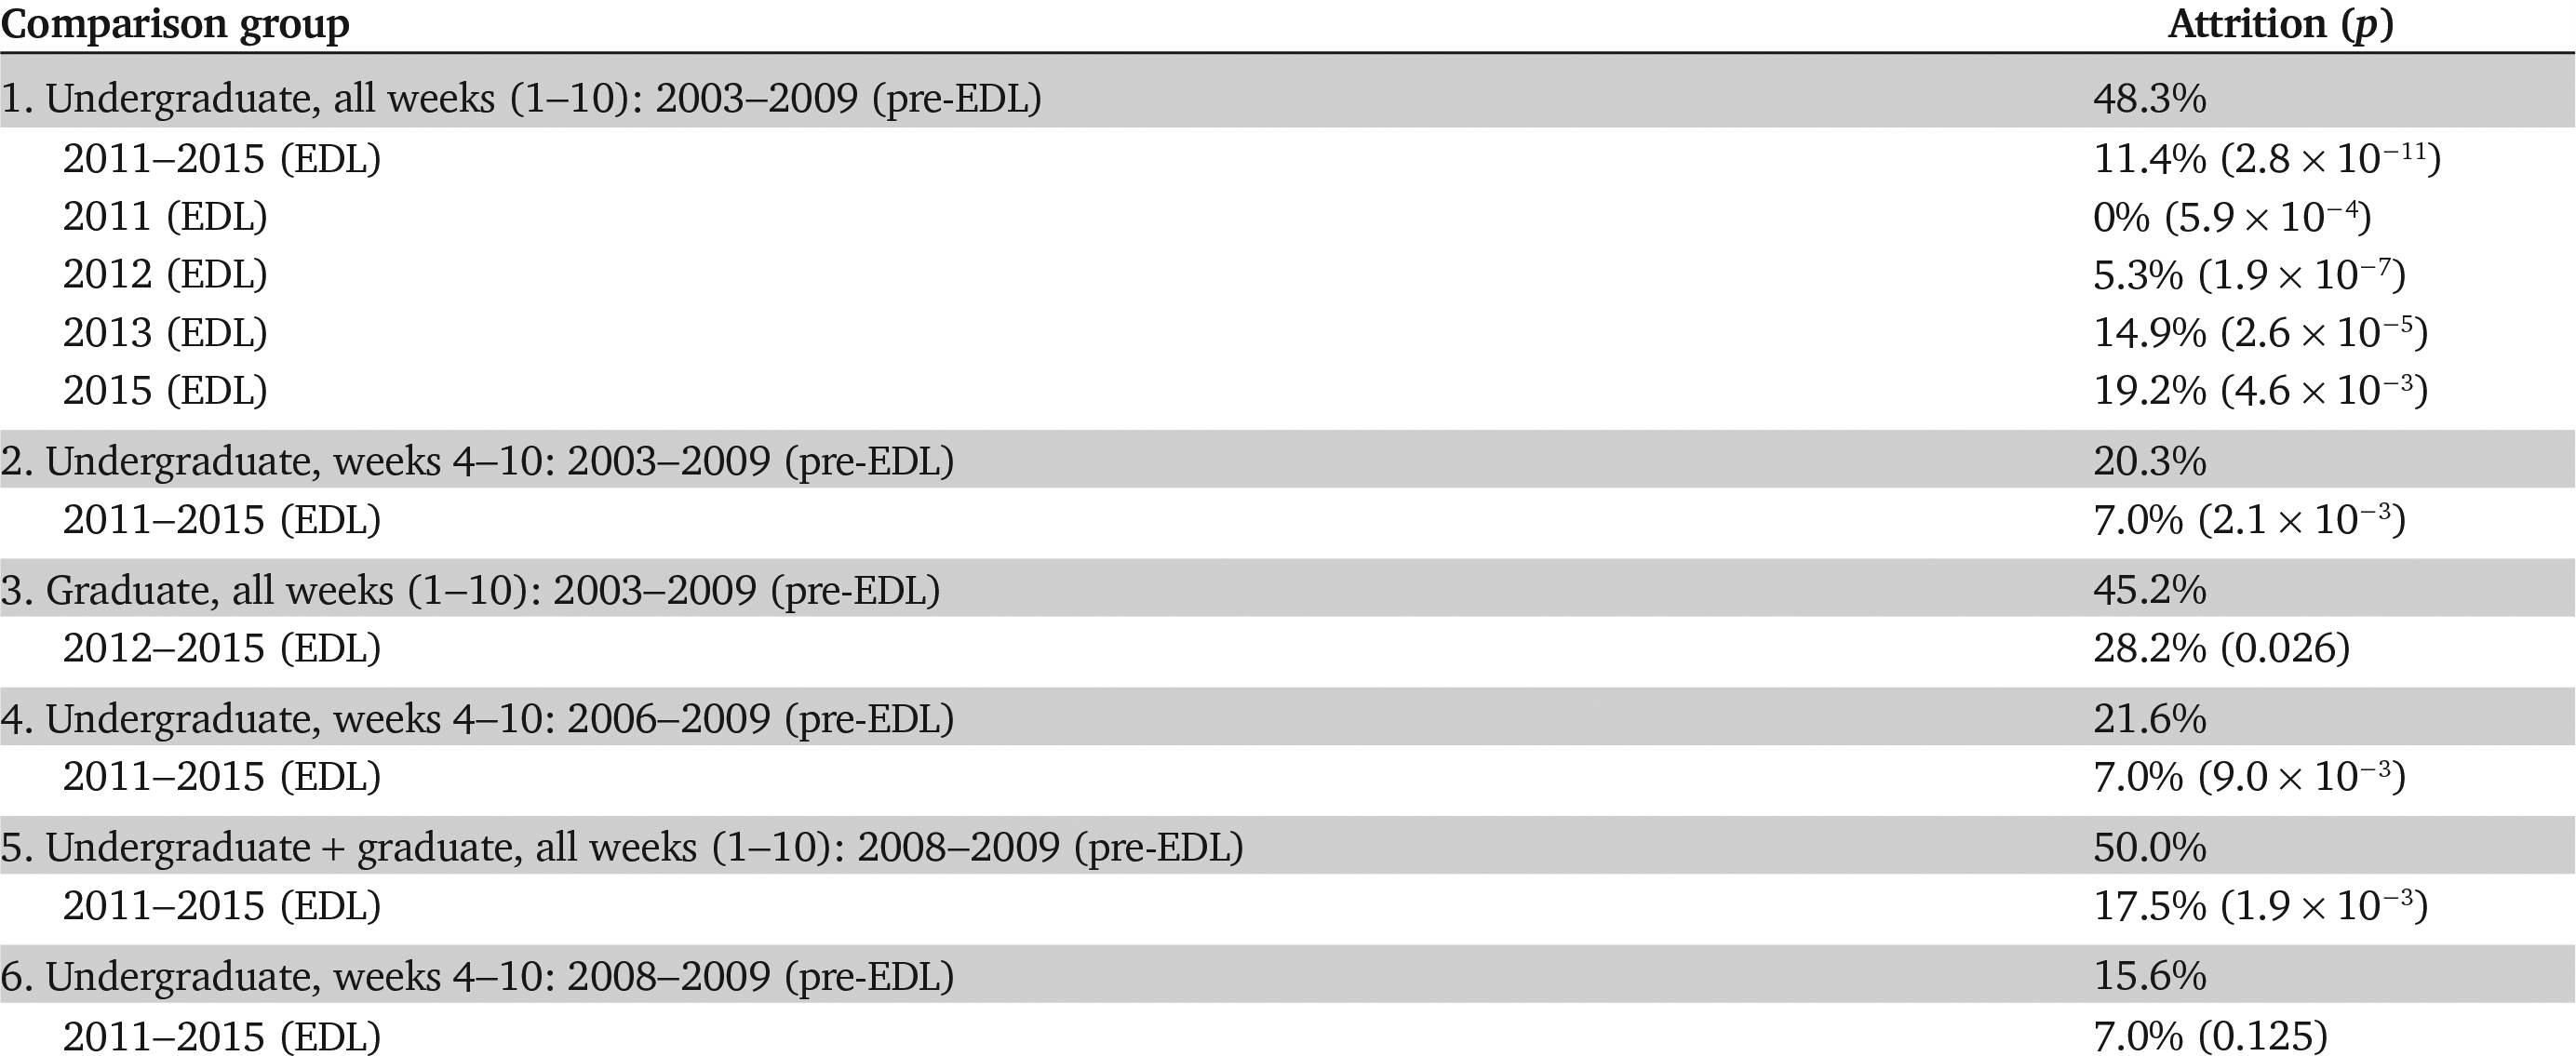
Importantly, this shift in student performance on exams reflected not just an improvement in the learning outcomes of a fixed number of students, but also the retention of many students who previously would have dropped out of the course. From 2001 to 2009, the course had consistently experienced a dropout rate of approximately 50% (typically during the first 2 weeks, when the equations started). As shown in Figure 6, the attrition rate began to decrease, first among undergraduates in 2011. During the 4 years of EDL data collection (2011–2015), the overall undergraduate attrition rate dropped to 11.4% (2011–2015), a statistically significant 4.2-fold reduction (p = 2.8 × 10⁻¹¹). We saw no evidence of reduced attrition in the first, non-EDL stage (2009) of the switch to active learning. The attrition rate in every year post-EDL (2011, 2012, 2013, 2015) was much lower than that in every year pre-EDL (2003, 2004, 2005, 2006, 2008, 2009), and the reduction was statistically significant for each post-EDL year (Table 2). The reduction in attrition appeared to be greater for undergraduate women (9.9-fold, from 73.1% pre-EDL to 7.4% post-EDL, p = 7.5 × 10⁻⁷; see Table 3) than for undergraduate men (3.1-fold, from 38.6% pre-EDL to 12.5% post-EDL, p = 6.2 × 10⁻⁴).

FIGURE 6. Rates of student attrition from the course. Total rates of attrition before (2003–2009) and after (2011–2015) the switch to EDL for undergraduates (A) and graduate students (B). Note that the large error bars in some years (e.g., undergraduates in 2008–2009) are due to having attrition rate data from only a small sample of students in those years (PTE request data, etc.; see Methods).
We observed a similar reduction in the attrition rate for graduate students, but it did not coincide with the transitional year when EDL was first introduced into the course (2011), instead becoming evident the following year (2012). The attrition rate in each post-EDL year (2012, 2013, 2015) was lower than during five out of six of the pre-EDL years. And the overall reduction of 1.6-fold (28.2% post-EDL vs. 45.2% pre-EDL) was statistically significant (p = 0.0255). Again the reduction in the attrition rate for female graduate students (3.3-fold, from 67% pre-EDL to 20% post-EDL, p = 0.0322) appeared to be stronger than for male graduate students (1.23-fold, from 37.5% pre-EDL to 30.4% post-EDL, p = 0.303). Although the reduction in attrition was observed for both female undergraduate students and female graduate students, this trend cannot be explained by increasing representation of women in the course. The fraction of female students in initial course enrollment data was actually slightly lower post-EDL (22%) than pre-EDL (29%).
Assessing Internal Factors Driving Performance
These shifts in student performance and persistence raise important questions about what internal factors might have contributed to these outcomes. While many distinct (but not necessarily incompatible) explanations are possible, two basic hypotheses seem accessible to assessment within our data: 1) increased engagement might simply drive students to work harder in the EDL course than in previous years (pre-EDL); 2) EDL may help students learn more effectively by enabling them to quickly identify misconceptions that previously blocked them from using the concepts correctly (NRC, 2005; Ambrose et al., 2010). (We will discuss other possible explanations in the Discussion.)
To assess the impact of EDL on overall student effort, we compared student self-reports of course workload from anonymous course evaluations from 2004–2015. Although adequate data are not available for every year (due to changes in how the institution collected course evaluations during this period; see Methods), they do provide one indicator of whether course workload changed significantly with the introduction of EDL (Figure 7). The EDL period did not show a trend of increased workload; instead, the workload seemed to fluctuate from year to year within approximately the same range as in the pre-EDL years. This result is particularly striking in view of the 10-fold increase in student activity in the classroom (answering target problems; see Figure 2). Students apparently did not perceive EDL as adding substantially to their workload, perhaps because it takes place during class time and thus may not increase the total amount of time they spend working on the course. Because these data measure perceived workload only subjectively, strictly speaking, they cannot verify that students are not in fact putting more hours into the course. However, they provide no support for that hypothesis.

FIGURE 7. Undergraduate evaluations of course workload. The mean and SD (error bars) of student-reported course workload before (2004–2006) and after (2011–2015) the switch to EDL.
Next, we assessed to what degree EDL helped individual students identify and address misconceptions that were blocking them from solving problems. We assessed three separate elements of the EDL process: student errors in problem solving; discovery of specific misconceptions from student response data; and student resolution of misconceptions. Our data for 2011–2015 show that, each year, the typical student revealed 15–20 serious conceptual errors on the ORCT problems (Figure 8) that blocked them from solving problems correctly about two-thirds of the time (i.e., the fraction of their self-assessments that reported errors). By contrast, in the absence of EDL (2009 and before), these misconceptions simply were not detected in the course.

FIGURE 8. Increasing student engagement in self-assessment and detecting conceptual errors. The number of in-class questions for which students completed key steps such as independently formulating and articulating their own answers (problems answered, green line), assessing the correctness of their answers (self-assessments, blue line), and identifying conceptual errors (errors detected, red line), both before (2008, 2009) and after (2011–2015) the switch to EDL.
The high level of student participation in EDL, and technology for automatic collection, viewing, and mining of student response data, enabled the instructor to easily see what every student was actually thinking on each single concept. These data rapidly revealed many misconceptions in students’ thinking about basic concepts not previously known to the instructor, totaling 105 distinct types of misconceptions in the first year (2011). In subsequent years, these specific misconceptions recurred frequently, and the number of new misconceptions identified in each year declined: 80 in 2012, 17 in 2013, and 20 in 2015. The instructor provided students with detailed explanations of each conceptual error they made, why it was wrong, and how to address it. These lessons were initially provided in class (2011), later through online videos (2012–2013), and most recently by the online e-learning platform (2015; Courselets.org). Providing ORCT exercises online (outside the classroom) appeared to engage students equally well. In 2015, each student initiated an average of 27 online ORCT exercises, of which they completed the self-evaluation and error-resolution steps in 95% of the online exercises they initiated.
To evaluate the reliability of student self-assessments, the instructor independently identified misconceptions in a random sample of 20 student self-assessed incorrect responses from 2013. We then compared the student’s self-reported misconception identifications with the instructor’s calls. In 19/20 cases, the students’ self-identified misconceptions were validated. In one case, the instructor classified the student answer as “correct” (i.e., no misconception found). This suggests that students’ classifications of their misconceptions on Courselets is reasonably accurate (∼95%).
Finally, in 2015, we measured the extent to which each occurrence of a student error was resolved by these specific materials and the overall EDL process. We found that, in fully 90% of cases, students reported that these materials resolved their specific confusion and that they needed no further assistance. While these self-reported data give only a subjective measure, the students’ claim that EDL is reducing their conceptual errors is validated by the objective exam score data, which show an approximately twofold reduction in their error rate (from losing 47% of exam points due to errors 2008–2009, to losing only around 25% of exam points in 2011–2015; see Figure 4). Overall, these results indicate that EDL helped students learn the concepts more effectively by addressing misconceptions that they previously might not have even identified.
DISCUSSION
These data appear to support the hypothesis that undiagnosed conceptual errors are a key factor in STEM education, in that direct intervention to identify and resolve each individual student’s conceptual errors reduced attrition and increased exam scores in all 4 years of EDL instruction. Particularly suggestive in this connection are the results from 2009, when the course was first converted to a Socratic format, that is, teaching by posing challenge questions, which students answered verbally, without the EDL system. On the one hand, the 2009 COPUS class-time usage data and basic event counts (e.g., an average of 32 student questions and answers per class, filling 40% of class time) show a transformation to a more active, student-centered format. On the other hand, the 2009 exam scores and attrition rates show no resulting benefit. So why did the Socratic method yield major benefits in 2011–2015 but not in 2009?
The main difference when comparing 2009 with subsequent EDL years (2011–2015) is the level of student engagement and the resulting systematic identification of individual students’ misconceptions. In 2009, a typical student only answered three in-class questions in the whole course, whereas in 2011–2015, this number increased to 30–60 questions per student. Three target problems are far too few to identify the number of conceptual errors each student needs to address (an average of 20 per student; see Figure 8). Solving this blind spot requires getting all students to answer every target problem, and that is what the EDL process was largely able to achieve every year.
Indeed, one could say that the abstract goal of “solving blind spots” must always translate in practice to boosting student engagement. After all, the instructor cannot gain insight into how each student thinks about a concept without getting that student to use and articulate the concept. Equally well, the student cannot fix a misconception without first engaging in a target problem-solving process that clearly exposes the misconception. Such exposure, in turn, leads students to practice metacognitive skills such as comparing, critiquing, and reflecting on their own cognitive processes. In this way, students can genuinely change their conceptual thinking, because they are genuinely engaged (Posner et al., 1982; NRC, 2000; Leonard et al., 2014).
A second crucial factor is the immediacy with which misconceptions are identified and resolved, ideally while the students are still trying to figure out how to solve the problem, within 60 seconds of their initial attempt. In our experience during this study, delay (e.g., the time that elapses between doing a homework problem and getting back the graded assignment) is harmful, because it breaks the learning cycle at a most fragile point. In place of a clear pathway forward, delay maroons students in their existing blind spots, and disengages them from the instructor (and other students) who are barreling onward to more complex concepts. Thus, we would propose that a practical recipe for making EDL succeed (vs. fail) can best be summarized as “zero blind spots + immediate resolution.” We must hasten to emphasize that, during this study, we were far from achieving either of these ideals! We regard this as good news, in that it implies further big improvements in learning outcomes may be possible.
The 2009 data also control for two other factors, namely switching from “grading on the curve” to grading on a fixed scaled based on historical grade distribution data (i.e., “grading on a historical curve”) and increasing total class time to 6 hours per week. Both changes began in 2009. The practice of grading on the curve is widely considered to promote competition between students and, consequently, to discourage cooperative learning (if any student helps others improve their scores, that will raise the overall class mean, reducing the generous student’s own z-score relative to that mean; Covington, 1992; Hughes et al., 2014; Schinske and Tanner, 2014). This grading policy was replaced in 2009 by simply switching to a historical curve: letter grade cutoffs were fixed before each year based on the score distribution from the previous year, eliminating any possible penalty for students helping others. The instructor also actively encouraged students to help each other learn. However, no resulting improvement in student performance or attrition is apparent in the 2009 data. This may imply that, in the presence of serious blind spots, student cooperation by itself may not be sufficient to drive large improvements in learning outcomes.
It is important to bear in mind some limitations of our data, and possible alternative interpretations. First, because the registrar did not retain week 1 enrollment data before 2010, we were forced to use the instructor’s records for week 1 data from 2003 to 2009 (which were not complete for all cross-listings; see Supplemental Table 2). It should be noted that the attrition results from these week 1 data are validated by the official registrar week 4–10 enrollment data for 2003–2015. That is, the same trend of attrition decreases is observed and again is statistically significant (see Table 2). Second, because we compared course outcomes in different years, it is difficult to definitely exclude the possibility of changes in incoming students’ level of preparation or achievement during the study period. As one basic test, we used SAT scores to check for such changes in incoming student qualifications and found no significant differences in SAT math and verbal scores for undergraduate students in the course from 2008 to 2015.
A third explanation that must be considered is the possible effect of improved course organization; instructor preparation and experience; and elimination of disruptions such as defective, untested, or overly difficult course materials. Unfortunately, this course transformation effort did not produce such ideal circumstances. It would probably be more accurate to say that the period 2011–2015 suffered the biggest disruptions in course materials and instructor preparation in the course’s history, due to radical changes in pedagogy, materials, and software platforms nearly every year. In 2011, the instructor converted the course to a 100% “flipped” format, necessitating the creation of all-new classroom materials; and all student activities were performed on an untested, experimental, in-class question system (Socraticqs). In 2012, the EDL process was overhauled to incorporate the identification of conceptual errors into the Socraticqs EDL cycle. And in 2015, the course switched to a new, untested, online e-learning platform for all class activities (Courselets.org). It is noteworthy that the only EDL year that did not suffer such major disruptions (2013) had low attrition for both undergraduates (15%) and graduate students (5%).
While the observed boost in engagement and immediate feedback on student misconceptions seems the most direct explanation for the improvement in student learning in 2011–2015, there are other important factors that will be considered in future studies. In particular, it is interesting to consider what motivational and affective variables might play an important role in the EDL process (Posner et al., 1982). It is possible that EDL boosted students’ self-efficacy and self-confidence and helped them to stay in the course long enough to successfully complete their first high-stakes assessment (Rittmayer and Beier, 2008; Trujillo and Tanner, 2014). EDL might also foster students’ development of a growth mind-set and “grit,” defined as the ability to persevere when faced with an academic challenge (Hochanadel and Finamore, 2015). EDL is designed to teach students to value effort and focus on improvement and, perhaps more importantly, to see “error” (pushing their ideas to a definitive test that sheds new light) as a normal and highly positive learning skill. Above all, they learn every day to “make your mistakes your most powerful learning tool.” Further work is needed to investigate these questions.
Our results also raise interesting questions about what aspects of the EDL cycle contribute most to student learning gains. For example, how much does immediate resolution improve learning (as opposed to delaying error identification and resolution for a week, say), and how fast does resolution have to be to achieve most of these gains? What is the effect of different ways of phrasing and presenting misconceptions to students, and what tone or language is most effective? To what degree of consistency do different instructors identify the same spectrum of misconceptions from a class’s ORCT responses? How accurately do different stages of students (e.g., lower- vs. upper-division college students, undergraduates vs. graduates) self-assess their disagreement with an expert answer and recognize their matching misconception statement? Again, these questions require further studies.
While this study has focused on boosting student engagement in the classroom, our EDL approach and results may be applicable to online education, because our current platform (Courselets.org) is entirely Web based. Concretely, the way students perform the EDL exercises (by answering a question in a Web browser on their laptops or smartphones) is the same regardless of whether they are doing it inside or outside a classroom. In practice, students in this study actually did much of their EDL work online and outside class. Hence, our results already contain a substantial online learning component. One question is whether eliminating blind spots and boosting engagement via EDL would remain valuable in a purely online course. The fact that students greatly increased the number of EDL exercises they completed when given a chance to do so online (as opposed to only in class; compare 2015 with 2013 in Figure 2) is encouraging. This question will require further study.
Finally, it is interesting to consider how systemic blind spots may affect instructors. Our data suggest first that blind spots are a serious barrier to success for implementing student-centered learning strategies such as active and collaborative learning. That is, in the presence of major blind spots, implementing such strategies may not be sufficient to achieve large improvements in learning outcomes. This could lead to instructors judging their results as disappointing or “not worth the effort.” For example, if the instructor in this study had persisted only through stage 1 of this effort (2009), the results would likely be judged a failure. Second, scaling the process of solving blind spots is the core of translating an instructor’s “good intentions” of reform into success in practice. Active learning requires a transformation from the one-way communication mode of lecture to the two-way communication and synthesis necessary for figuring out what each student needs to do next to overcome his or her obstacles. This is easier said than done. Even with all the best intentions in the world, an instructor who cannot see what every student is actually thinking on every concept is de facto trapped in a one-way communication mode. Such an instructor can speak, but cannot hear what most of the students are thinking. This is above all a scalability challenge. The key to success for EDL is not only its scalability as a Web platform but also its human scalability. That is, by a small amount of sampling of student answers and identifying a small number of common errors, an EDL instructor can resolve the vast majority of students’ obstacles on a given concept.
A natural corollary of EDL’s human scalability is that EDL suggests an important new form of sharing and reuse of educational materials. In the past, the model for most online educational materials (such as massive open online courses [MOOCs], lecture videos, online textbooks) has been to greatly expand an instructor’s distribution to reach larger and larger numbers of students. In this model, the online audience for a given material is students. By contrast, EDL seems to invite global collaboration among instructors in the form of online sharing of target problems, error models, and error model resolutions. That is, because most students make the same four or five common errors on a given challenge, reuse of those error models (and their associated resolutions) is likely to be valuable to many instructors teaching a given concept, even if their courses are otherwise quite different in content. In this model, the (initial) online audience for a given material is other instructors, who will remix, modify, and extend it, before in turn distributing it to students. Adding a “second layer of reuse” in this way may actually increase the reuse-multiplier effect for online educational materials. EDL also opens new opportunities for students to be valued as important contributors and authors, for example, by articulating their own proposed error models (for how their thinking diverged from the expert’s usage of a concept) and proposed resolutions (which instructors can validate).
As an illustration of these new possibilities, Courselets.org is designed as a platform for making it easy for instructors to discover, share, reuse, remix, and write their own target problems, error models, and resolutions. The existing set of such materials on Courselets.org was developed for bioinformatics and computational biology courses and is licensed for free reuse and modification under a Creative Commons license. We expect this to be a common scenario for materials contributed to Courselets.org by other instructors across STEM disciplines. Courselets.org attempts to provide a working demonstration that a public repository for such open-source instructional materials becomes useful 1) when depositing materials there makes them immediately reusable by any instructor or student; and 2) when reuse fundamentally improves the materials, for example, by increasing the sample of student responses, discovering new error models, and adding new error-resolution lessons and empirically testing their effectiveness. In this “teaching as publication” model, the author publishing a material benefits not only from the credit of many peers choosing that material as the best available for teaching a given concept (a form of peer review that can be automatically tracked), but also from the community’s investment in extending and improving it (as outlined above). The key to these benefits is that each participant need only make a small contribution for a sustainable, continuous-improvement cycle to grow. That said, Courselets.org leaves decisions about sharing and licensing to the individual contributors (e.g., to keep their materials strictly private).
ACKNOWLEDGMENTS
We extend special thanks to Marilyne Stains at the University of Nebraska–Lincoln and Elizabeth Roth-Johnson at UCLA for their critical reading of the article. This work was supported by National Institutes of Health grant 5R25GM114822, John Templeton Foundation grant FP053369-G via a subaward from the University of Chicago Knowledge Lab, and a grant from the Howard Hughes Medical Institute (#52008380). In addition, institutional support was received from UCLA Office of Instructional Development’s Instructional Improvement Program grant IIP-13-35 and UCLA-CCLE Innovation and Development Program grant CCLE-IDP-Spring2014. Funders played no role in the design and conduct of the study; in the collection, analysis, and interpretation of the data; and in the preparation, review, or approval of the manuscript.