New Thermodynamics Boxes Simulation
To the Editor:
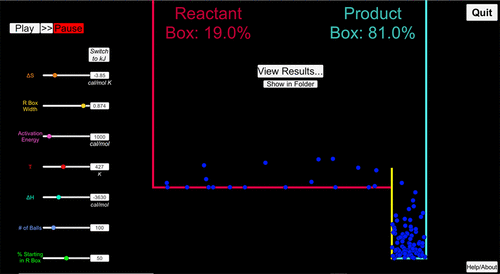
Thermodynamics is notoriously difficult to learn. Even students who can use and understand the relevant equations involved often have misconceptions about equilibrium, entropy, and enthalpy and have a difficult time interpreting free-energy values and predicting effects of catalysts (Ayyildiz and Tarhan, 2018; Cooper and Stowe, 2018; Kohn et al., 2018). “Molecular Thermodynamics for Cell Biology as Taught with Boxes” offers a visual approach to helping students learn thermodynamics using a quantitatively accurate thermodynamics boxes simulation (Mayorga et al., 2012). This simulation uses the familiar visual of y-axis height to quantitatively represent the difference in enthalpy between reactants and products of a reaction (see Figure 1 and the Supplemental Material; Mayorga et al., 2012). Entropy change during the reaction is related to the relative probabilities of the two states (reactant and product), which are shown on the x-axis as the relative width of the reactant and product boxes. If reactant and product boxes have equal width, the change in entropy is 0, because there is an equal probability of the ball being in either box. If the product has a lower entropy, then the product box width is smaller.

FIGURE 1. New thermodynamics boxes simulation. The example shows a snapshot of the boxes for the isomerization of 1-propanol to 2-propanol with ΔH = −3630 cal/mol and ΔS = −3.85 cal/mol at 427 K. The red box is the reactant box, the blue box is the product box (percentages of balls shown inside the boxes). The yellow bar between the boxes represents an activation energy of 1000 cal/mol.
Reactant and product molecules are represented as balls moving randomly back and forth from reactant to product box and bouncing up and down with a Boltzmann distribution of kinetic energies (as a function of absolute temperature). Students can change the proportion of balls in either the reactant or product box and watch them move back and forth between the boxes as the reaction approaches equilibrium. Data sets associated with the simulations may be downloaded into Excel files, which students can then graph to investigate various thermodynamic or kinetic relationships. For instance, students can test the idea that reaction reactants and products will reach the same equilibrium ratios regardless of whether they start with 100% reactant or 100% product. They also can investigate equilibrium constants at different temperatures. The kinetics of the simulated reactions are meaningful, even though the time unit is arbitrary. Specifically, students can see how the addition of an activation energy barrier slows down a reaction, or how the forward and backward reaction rates (assuming an elementary reaction) relate to the equilibrium constant.
Unfortunately, the boxes simulation download available in the Mayorga article is not compatible with current versions of Excel. Fadi Greene and I have created an improved download for Windows and Mac (see “Boxes Simulations” in the Supplemental Material); Mayorga advised us during simulation redesign. We are writing to make this new tool available to educators to incorporate in their classes. In the process of updating the simulation, we made the following additional changes and improvements:
A toggle for students to choose units of kJ or calories as energy units was added.
An About box provides the underlying equations and limitations for each variable.
A function allows students to open simulation results as a CSV Excel file from a link that appears when the simulation is paused, which they can use to construct any graphs of interest.
A Fast Forward button that allows students to speed up the simulation was added.
The option to select a number of balls within the range of 1–500 was added, with all the simulated balls shown (unlike the original simulation, in which some balls were included in the calculations but not shown visually). Changing the number of balls can help students understand the stochastic nature of statistical processes with small numbers and can eliminate bugs that can occur on some computers with large numbers of balls and large entropy changes.
The simulation was programmed using the video game engine Unity, which provides a nicer aesthetic than Excel macros and will be usable for many years rather than being tied to one release of Excel.
I hope that this updated and improved simulation resource will be useful to instructors in helping their students learn thermodynamics concepts.
ACKNOWLEDGMENTS
Thanks to Fadi S. Greene for programming the simulation. Special thanks to Luis Mayorga for technical advice (and for writing the inspirational article). Thanks to Kenneth Jacobs (Northwestern University) for technical testing of the simulation. Thanks to the Judson University (Elgin, IL) physical chemistry class of Fall 2017 and the Albright College (Reading, PA) Biochemistry class of Fall 2018 for class testing the simulation.


