Punnett Squares or Protein Production? The Expert–Novice Divide for Conceptions of Genes and Gene Expression
Abstract
Concepts of molecular biology and genetics are difficult for many biology undergraduate students to master yet are crucial for deep understanding of how life works. By asking students to draw their ideas, we attempted to uncover the mental models about genes and gene expression held by biology students (n = 23) and experts (n = 18) using semistructured interviews. A large divide was identified between novice and expert conceptions. While experts typically drew box-and-line representations and thought about genes as regions of DNA that were used to encode products, students typically drew whole chromosomes rather than focusing on gene structure and conflated gene expression with simple phenotypic outcomes. Experts universally described gene expression as a set of molecular processes involving transcription and translation, whereas students often associated gene expression with Punnett squares and phenotypic outcomes. Follow-up survey data containing a ranking question confirmed students’ alignment of their mental models with the images uncovered during interviews (n = 156 undergraduate biology students) and indicated that Advanced students demonstrate a shift toward expert-like thinking. An analysis of 14 commonly used biology textbooks did not show any relationship between Punnett squares and discussions of gene expression, so it is doubtful students’ ideas originate directly from textbook reading assignments. Our findings add to the literature about mechanistic reasoning abilities of learners and provide new insights into how biology students think about genes and gene expression.
INTRODUCTION
The structure and function of genes are foundational concepts of molecular genetics instruction. Gene expression is the outcome of a complex system of inputs, both internal and external, which is further complicated by the fact that organisms are multifunctional and ever changing. Systems in molecular genetics are dynamic, complicated networks that involve dozens of molecular interactions, each of which, in turn, is governed by a variety of internal and external signals. Experts recognize the vast interconnectedness of biological processes and can integrate knowledge at different levels of biological organization (Schönborn and Bögeholz, 2009; Trujillo et al., 2015). Learners, on the other hand, struggle to think on a systems level, especially in the context of molecular biology and genetics. For example, there is rarely a straight line from genotype to phenotype, a fact that tends to be lost on novices (Briju and Wyatt, 2015; Phelps-Durr, 2016; Mann et al., 2017; Weigel et al., 2020). The central dogma of molecular biology is key to understanding the complex and dynamic processes that underlie expression and regulation of gene products, which may lead to phenotypic outcomes in a cell, organism, or population. Yet undergraduate students face numerous difficulties mastering these concepts (Lewis and Wood-Robinson, 2000; Shi et al., 2010; Wright et al., 2014; Cooper, 2015; Newman et al., 2016; Pelletreau et al., 2016; Reinagel and Bray Speth, 2016; Crowther et al., 2019) that are foundational to biotechnology and biomedical applications.
National calls for improvement of biology education specifically cite the need for students to understand the nature of systems as well as the role of feedback and networks in genetics information flow (American Association for the Advancement of Science, 2011; Brownell et al., 2014). To deeply understand a molecular phenomenon, learners must recognize the need for specific molecules, the physical changes created by the interactions, and the temporal and spatial organizational scheme that allows for the interactions to occur or not (Machamer et al., 2000; Russ et al., 2008; van Mil et al., 2013). We argue that a long-standing and central mission of biology education is to help students learn to construct a chain of reasoning to explain natural phenomena such as phenotypic outcomes. In other words, students should be able to explain the underlying causes of natural phenomena with a mechanistic model (Braaten and Windschitl, 2011). Westerman and colleagues (2020 p. 385) posit that “mechanistically connecting genotypes to phenotypes is a longstanding and central mission to biology.” We define mechanistic reasoning similarly to Abrams and Southerland (2001), as the ability to answer a “How does it occur?” question with a “how” and not a “because” answer. Studies show that students often focus on the end result (the outcome) while missing the process or processes (the mechanism, or the “how”) that drive the outcome (Abrams and Southerland, 2001; Trujillo et al., 2015). For example, when asked how a plant grows toward the sun, a student might answer “because it needs the light.” This type of answer, while representing a correct concept about outcome (the plant’s functions are aligned with its needs), does not address the question asked, which is to explain the process. To answer “how,” one would need to discuss differential growth rate in the stem of the plant.
Processes in molecular genetics are only indirectly observable, so scientists use data and representations to build models of an “un-see-able” world. In the same vein, it is impossible to see what is in someone else’s mind. Visual representations (graphs, diagrams, and illustrations) are the language that researchers and educators use to study, communicate, make predictions, and ask questions about molecular biology phenomena. Drawings have been described as “external models that involve the formation of internal models” (Quillin and Thomas, 2015 p. 2), a statement backed by the literature (e.g., Johnson-Laird, 1980; Jonassen et al., 2005). Asking learners to draw their mental models of a phenomenon in molecular genetics can be a productive way to uncover their ideas and reasoning about that concept or process. Analysis of student-generated sketches in chemistry and biochemistry have revealed fascinating insights into how learners conceptualize phenomena such as precipitation reactions (Kelly et al., 2010), intermolecular forces (Cooper et al., 2015), and secondary protein structure (Harle and Towns, 2013). Similarly, analysis of wave sketches has revealed numerous misunderstandings held by physics graduate students (Porter and Heckler, 2019), and the Draw-an-Ecosystem assessment task has been a useful tool for understanding and measuring changes in undergraduate and in-service teachers’ ideas about ecological knowledge (Sanford et al., 2017).
Study Aims
Novice–expert comparisons can provide insight into what students need to learn and how to help them think more like experts (National Research Council [NRC], 2012). Thus, we investigated how students and experts explain and visualize molecular structures and processes related to genes and gene expression and where their ideas originate. In this study we posed the following research questions:
Research Question 1: How do novices and experts differ in their mental models of the terms “gene” and “gene expression”?
Research Question 2: Is there an alignment between students’ mental models and their reasoning about genetic outcomes?
These questions are important, because educators must understand student reasoning (and how it may differ from that of experts) about these core ideas to better inform curricula and assessment strategies to improve learning (NRC, 2012). Poor mental models could explain some of the struggles that students have with these topics, and understanding the weaknesses in these models would be useful to undergraduate educators.
METHODS
Development and Implementation of Interview Protocol
We developed a semistructured interview protocol meant to probe subjects’ understanding of core ideas in molecular biology. The concept of a gene, the basic physical and functional unit of heredity, is essential to many topics in molecular biology. Thus, we wanted to explore through drawing how subjects (novices and experts) conceptualized a gene and the concept of gene expression. During the interview subjects were asked, “What is a gene?,” and then, “How would you describe gene expression?” Participants were asked to draw their ideas while describing all aspects of their drawings. Subjects were recruited via Listservs (experts were recruited through Promoting Active Learning and Mentoring Network and the Society for the Advancement of Biology Education Research) and social media platforms (students were recruited through Facebook and Instagram) as well as personal contacts (faculty at institutions that one of the authors was affiliated with) to ensure adequate representation from locations across the United States. Interviews were conducted using Zoom and were recorded and later transcribed. Participants were asked to hold up their drawing papers for the interviewer to see and/or participants sent digital images via email after the interview was completed. In total, 23 undergraduate biology students (individuals who had completed at least one college biology course but had not yet graduated) and 18 experts (Individuals with a PhD in Molecular Biology, Genetics or a related sub-discipline of Biology) participated in interviews. One student did not generate a drawing for “gene expression,” so only 22 novice drawings were analyzed. Due to technical issues, the audio recordings of five interviews were lost, so only 16 expert and 20 student verbal descriptions were analyzed.
During the process of conducting interviews (which took place over two consecutive summers), field notes indicating the main types of representations drawn by the subjects (chromosome drawing, helix, boxes and lines, etc.) were used to create an emergent coding scheme. Once the broad categories were established, two coders (A.C. and A.L.) independently analyzed participant-generated drawings of “gene” and “gene expression.” Interrater reliability was calculated using Cohen’s kappa (Carletta, 1996); agreement for each of the nine categories was very high (kappa scores for interrater reliability ranged from 0.88 to 1.0), and the few disagreements were resolved through discussion. Likewise, participants’ explanations of gene and gene expression were analyzed and coded using an emergent theme. Descriptions for “What is a gene?” fell into one of three categories: structural (part of a chromosome, made of DNA), molecular process oriented (genes encode proteins and/or products), or phenotypic outcome oriented (genes code for phenotypes or traits). Descriptions for gene expression fell into one of two categories: molecular process oriented (described molecular processes of transcription and translation) or phenotypic outcome oriented (described that genes resulted in certain phenotypes and traits).
Survey Design and Implementation
Data from the drawing interviews revealed a surprising finding: a number of students drew Punnett squares when asked to draw and describe the process of “gene expression.” To probe students’ ideas about Punnett squares more deeply, we developed an anonymous Qualtrics survey. The only demographic question we asked of participants was to select which biology courses they had taken from the following list: introductory/general biology, microbiology, genetics, molecular biology, cell biology, and biochemistry. We divided the respondents into groups based on the courses they reported having taken. “Intro” students had only taken introductory or general biology, “Midlevel” students had taken introductory or general biology plus one to two advanced courses, and “Advanced” students had taken four or more courses. We excluded respondents who did not select any courses or who claimed to have taken one or two of the advanced courses but not Intro/Gen Bio. We did not include any other questions about demographics, academic metrics (grade point average), or the type of institution the participants attended. While it might have been interesting to have this information, we did not want our student participants to feel “judged” or experience stereotype threat as they considered our survey questions. Questions discussed in this paper included:
Punnett square question: “Below is an example of the Punnett square showing the genotypes corresponding to blue and brown eye color. Brown (B) is dominant to blue (b). As shown in the Punnett square, all children of parent 1 and 2 will be heterozygous and have brown eyes. Propose a mechanism or process to explain why the offspring have brown eyes.” This question included a diagram of a Punnett square showing the cross BB x bb, leading to Bb offspring. Participants were presented with a text box to enter their answers.
Gene expression representation question: “When you think of the term gene expression, which of the following images is most similar to your mental picture? Rank in order from most similar (1) to least similar (4).” Participants were given four images to rank by dragging the images into their preferred order. Two of these images were standard illustrations from molecular biology textbooks: an operon containing four genes that are transcribed into a single mRNA and then translated into four proteins (operon diagram) and a double-stranded DNA transcribed to single-stranded RNA, the mRNA now carrying a cap and polyA tail being exported from the nucleus, and then translation to a polypeptide in the cytoplasm (central dogma diagram). These illustrations of the molecular processes involved in gene expression were chosen because they aligned with drawings and verbal descriptions by experts in our interviews. The other two images showed a Punnett square of a monohybrid cross with green and yellow peas that showed both genotypes and phenotypes (Punnett square diagram) and an X-shaped chromosome with an arrow pointing to a purple flower (phenotype diagram). These illustrations of the phenotypic outcomes of gene expression were chosen because they aligned with drawings and ideas articulated by students (and not experts).
The online survey was distributed via social media and email messages to target biology undergraduate students at institutions across the country (several biology classes and clubs). As an incentive for participation, we randomly drew a $25 Amazon gift card for every 25 people who participated in our survey (and supplied an email address). There were two different implementations of the survey. The first took place in July 2020 and included both of the above questions, separated by three other questions not discussed here. A total of 121 individuals responded to that survey, but only 52 completed it. Because we saw some interesting trends in the first set of data, particularly with the second question, we sent out a new version to different target classes. We moved this question (gene expression representation question) to the beginning of the survey in hopes of getting a higher response rate on it and removed the first question because it did not seem as important. In hindsight, it would have been better to leave it in, as we gleaned interesting insights from responses to that question in later analyses. The second iteration took place in December 2020. After compiling all responses to our two target questions, we had 52 responses to the Punnett square question and 156 responses to the gene expression representation question.
Coding Open Responses from Question 1 (Punnett Square Question)
Responses from 52 participants were analyzed using an emergent coding scheme. After initial investigation, it was determined that responses appeared to fit within one of three categories: Allelic (explanations that alleles and traits were linked, with no description of molecular process), Meiotic (concepts related to meiosis were included in the explanation, but not elaborated upon), and Gene Product (explanation included a process that resulted in a product of some kind). Two researchers then independently recoded all responses using the three-category strategy and achieved 94% agreement. After discussion, we combined responses originally coded as Allelic or Meiotic into the code Outcomes and responses that included molecular-level processes were coded as Process, similar to the framework described by Abrams and Southerland (2001).
Textbook Analysis of Punnett Square Descriptions
During the interviews, it became apparent that many student participants were equating Punnett squares with the concept of gene expression. Because we did not know where this concept originated, we wondered whether college biology textbooks routinely used the term “gene expression” in conjunction with Punnett squares. Thus, we analyzed captions of 118 figures containing Punnett squares as well as the paragraphs that referenced each figure from 14 introductory biology, genetics, and cell biology textbooks (Russell, 1997; Griffiths et al., 2000; Klug and Cummings, 2002; Shuster et al., 2011; Hillis, 2012; Fowloer et al., 2013; Reece et al., 2013; Morris et al., 2015; Freeman et al., 2016; Goodenough and McGuire, 2016; Lewis, 2017; Clark et al., 2018; Alberts et al., 2019; Nickle and Barrette-Ng, 2020). The research team first identified all images showing Punnett square diagrams in each of the textbooks and made digital images of the figures and text explaining the Punnett square diagrams. Then we specifically looked for the molecular process–related terms “gene expression,” “transcription,” and “translation” and compiled a list of terms that were commonly used in the accompanying text.
RESULTS
Experts and Novices Have Different Conceptions of “Gene”
Using an emergent coding scheme, we found that all participants used three different categories to explain their understanding of the term “gene.” Participants’ explanations could fall into more than one category, so we calculated the percentage of each participant group (expert or student) that used each explanation (Figure 1). There was a striking difference between experts and students. All experts and the majority of students described a gene as something that was located on chromosome or a stretch of DNA (structural). However, all experts described a gene as something that codes for an RNA or protein (molecular process), compared with only 15% of students, and 70% of students described a gene as something that determines a trait/characteristic (phenotypic outcome; e.g., “Certain genes code for eye color or hair color.”), which was a definition never used by experts.
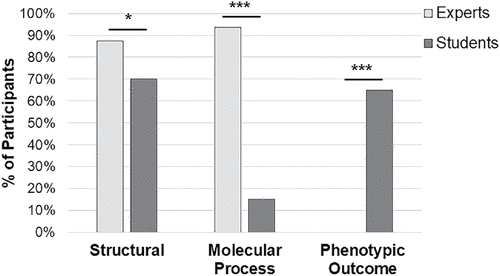
FIGURE 1. Student and expert explanations of “What is a gene?” focus on different concepts. Verbal responses to the prompt were coded using an emergent theme. The y-axis represents the percentage of participants that used a particular description, as several participants used more than one category in their explanations (n = 16 experts, n = 20 students). *p < 0.05; ***p < 0.001.
We also found that experts and students represent the concept of “gene” quite differently through drawing. Eighty percent (Figure 2A) of experts used a box-and-line style diagram (i.e., a straight line was used to represent DNA, important regions of the DNA were boxed and sometimes an arrow was used to indicate a promoter region), while only 30% of novices did. In contrast, 52% of novices chose to draw a chromosome to represent a gene. Two of 16 experts drew a chromosome during their explanation of a gene, but both also drew close-up regions of their chromosomes and then used a box-and-line diagram to represent a specific gene region. Figure 2B illustrates the most common drawing types for gene by students and experts.
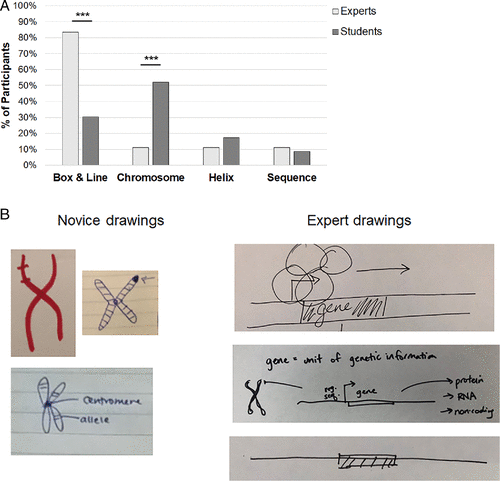
FIGURE 2. Experts and novices use different representations when asked to draw a gene. (A) Drawings in response to the prompt were coded according to an emergent scheme. The y-axis represents the percentage of participants who used a particular representation, as several participants used more than one category of representation in their drawing (n = 18 experts, n = 23 students). **p < 0.01; ***p < 0.001. (B) The most common representation created by experts was a box-and-line diagram, while students most often drew chromosomes.
Experts and Novices Have Different Conceptions of “Gene Expression”
Using an emergent coding scheme, we found that all participants’ explanations fell into two different categories as they discussed their understanding of a gene (Figure 3). One hundred percent of experts and 52% of students described gene expression as a process involving transcription and translation. Unlike experts, though, 67% of students described gene expression in terms of traits or characteristics, with a high percentage of students drawing and explaining gene expression using a Punnett square diagram to go along with the explanation. To illustrate the difference in focus, contrast this expert response: “DNA is transcribed and modified to make mRNA and then translated to make a protein product.” with this student response: “I think of it as a Punnett square and that controlling what traits you have, like having curly hair.”
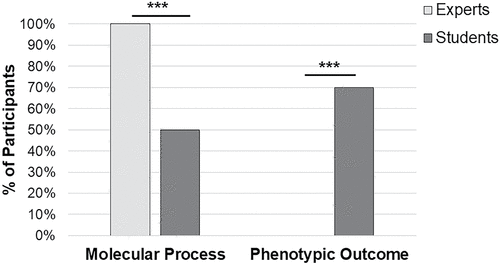
FIGURE 3. Student and expert explanations of “What is gene expression?” focus on different concepts. Verbal responses to the prompt were coded using an emergent theme (n = 16 experts, n = 20 students). ***p < 0.001.
Figure 4A shows a breakout of the ways in which students and experts chose to illustrate the idea of “gene expression.” Fourteen of the 16 experts (88%) drew a box-and-line diagram, while only six of 22 students (28%) used this scheme. Ten of the 22 students (45%) drew a Punnett square—the most common drawing created by students. In contrast, none of the 16 experts drew a Punnett square to illustrate their thinking about gene expression. Four students drew a chromosomal representation and four students drew DNA sequences to show gene expression (18% each), and neither of those schemes was used by experts. Representative student and faculty drawings are presented in Figure 4B.
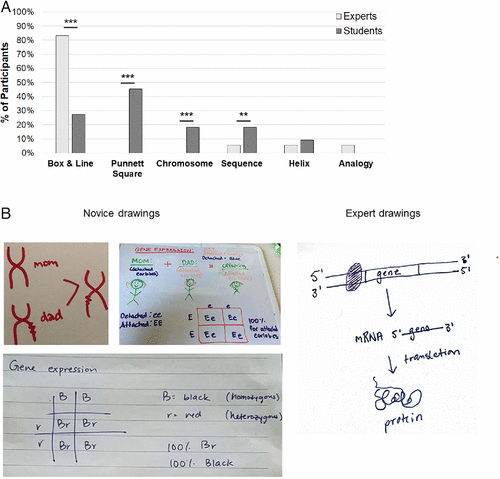
FIGURE 4. Experts and novices used different representations when asked to draw gene expression. (A) Drawings in response to the prompt were coded according to an emergent scheme. The y-axis represents the percentage of participants who used a particular representation, as several participants used more than one category of representation in their drawing (n = 18 experts, n = 22 students). ***p < 0.001. (B) The most common representation created by experts was a box-and-line diagram outlining the basic steps of transcription and translation, while the most common representation drawn by students was a Punnett square. A chromosomal-level drawing (by a student) is also included as an example.
When Given a Choice, Novice Students Identified Outcome-Based Images as Matching Their Mental Models
Although students drew Punnett squares when asked to represent gene expression, we hypothesized that if they were presented with a canonical diagram of transcription and translation, the representation might prime them to align their idea of gene expression with the more traditional visual. Thus, we presented students with four different images in an online survey and prompted them with, “When you think of the term gene expression, which of the following images is most similar to your mental picture? Rank in order from most similar (1) to least similar (4).” Two of the diagrams were standard transcription/translation illustrations from molecular biology textbooks: a prokaryotic operon structure with transcription and translation (operon diagram) and the multistep process in a eukaryotic cell (central dogma diagram). We also included a Punnett square diagram and a diagram of an X-shaped chromosome with an arrow pointing to a purple flower (phenotype diagram) to align with student ideas from the interview data.
Our hypothesis turned out to be incorrect; 32% percent of beginning students and 27% of intermediate students chose the Punnett square diagram, even when presented with images showing the molecular processes (Figure 5A). In contrast, only 5% of Advanced students selected the Punnett square first. On average, beginning students preferred the Punnett square diagram as a representation of their mental models of gene expression (Figure 5B). As a group, Intro students did not differentiate much among three of the figures, only showing a distinct bias against the operon figure. With more classes under their belts, intermediate students gravitated toward the diagrams that illustrated a molecular process (operon and central dogma diagrams) with an accompanying decreased alignment with the ones that showed a phenotypic outcome (Punnett square and phenotype diagrams). Advanced students, who had taken at least four courses that presumably included some discussion of gene expression, had clearly shifted their mental models toward the central dogma diagram, followed by the operon diagram, with the two phenotypic outcome representations ranked at the bottom. When considering the top two choices of each student, the majority of Intro (68%) students selected a diagram showing a phenotypic outcome but few Advanced students (20%) did; slightly more than half of the Intro students (53%) chose a molecular process figure, while nearly all Advanced students did (91%; Figure 5C). It is interesting to note that Intro and Midlevel students often chose both types of conceptual models, as demonstrated by their relatively high rate of choosing both types of figures in their top two, but Advanced students as a group tended to reject the phenotypic outcomes model in favor of the molecular process model. The Midlevel students are closer to the Intro students in their choices. Advanced students showed much more expert-like understanding, but it did seem to take the accumulation of many biology courses for them to reach that point.
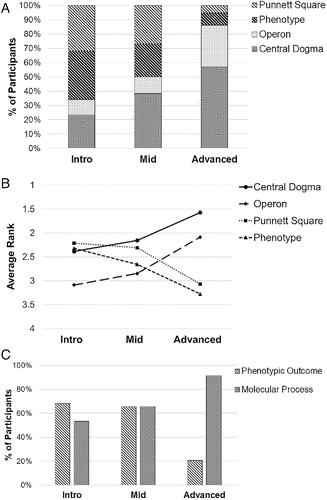
FIGURE 5. Students change their mental models of gene expression with experience. Students were asked to rank four different images for their fit with their own mental images of the term “gene expression” on an online survey. Two images showed a phenotypic outcome (Punnett square, phenotype diagrams), and two showed the processes of transcription and translation (operon, central dogma diagrams). Intro students (n = 57) had only taken introductory or general biology, Midlevel students (n = 34) had taken introductory or general biology plus one to two upper-level courses, and Advanced students (n = 65) had taken four or more courses that are likely to include concepts of gene expression. (A) First choice of image changed from Punnett square and phenotype (phenotypic outcome diagrams, striped boxes) to central dogma and operon diagrams (molecular process, dotted boxes) as students completed more courses. (B) The average relative ranking of each diagram also changed with experience level. (C) The top two choices of each student were considered, collapsing the four diagrams into two categories.
Students with Expert-like Models Are More Likely to Describe Mechanistic Processes
In addition to asking students to choose the diagram that fit their mental images, we asked them to propose a mechanism that explains the phenotypic outcome for offspring of a simple cross (BB × bb → Bb). Most students responded with an outcome-based definition that gave no insight into the process of how alleles lead to phenotypes (e.g., “B is the dominant phenotype. B is dominant over b. Therefore, all offspring will have brown eyes.”). Only 21% used process-based explanations to answer the question (e.g., “The gene may code for a protein that deposits melanin in the iris. Allele B codes for a functional protein, allele b does not. One copy of a functional B allele is enough to deposit normal amounts of melanin.”). It is possible that learners could provide a mechanistic explanation that is factually incorrect, but we did not find any instances of that in our data set. Triangulating students’ answers to both survey questions led to an interesting observation: nine of the 10 students who proposed a molecular mechanism also chose one of the molecular process diagrams as the best representation of their mental models of gene expression (Figure 6). No Intro students discussed processes; all participants who gave mechanistic explanations had taken at least two upper-level courses in addition to Intro/Gen Bio.
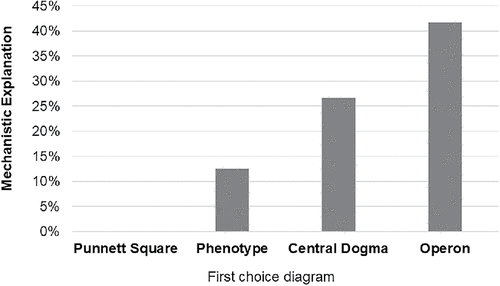
FIGURE 6. Choice of molecular process diagrams to explain gene expression correlates with mechanistic reasoning about dominance. Students (n = 48) were asked to propose a mechanism to explain how a dominant phenotype came about. Most answers did not address the process at all, simply stating that dominant alleles are the ones that are observed in a heterozygote. However, almost all students who did propose a mechanism also chose a process-based diagram as the one that most closely resembled their mental model of “gene expression.”
Biology Textbooks Do Not Use Terms about Gene Expression to Describe Punnett Squares
The finding that almost half of students drew a Punnett square diagram to demonstrate their understanding of gene expression was very surprising to us. Our experiences as educators and learners who have spent much time reading textbook passages suggested that textbooks did not incorporate language about gene expression in their discussion of inheritance, but we did the analysis to be sure. While we did not analyze the entire textbook or entire chapters that contained Punnett square diagrams, we did analyze the text that described the figures. None of the 14 books used the process-related terms “gene expression,” “transcription,” or “translation” to describe Punnett squares. The most common terms used in the books included “gamete,” “phenotype,” “genotype,” “homozygous,” “heterozygous,” “recessive,” “dominant,” “allele,” “gene,” “trait,” “chromosome,” “meiosis,” and “gamete.” We did not specifically look for the term “expression” alone, so we cannot comment that it was not used in the chapters. Interestingly, we only found one introductory book that used the terms “protein” and “enzyme” when describing the concepts of inheritance, traits, and characteristics (Reece et al., 2013).
Although we did not do an exhaustive analysis of textbooks, our findings suggest the majority of textbooks do not include ideas about gene expression (as defined by experts) when describing concepts of inheritance, traits, and characteristics. Punnett squares are typically used in units about inheritance, traits, and characteristics.
DISCUSSION
We analyzed expert and student drawings of genes and gene expression to gain a better understanding of how students’ mental models may differ from those of experts. Results from the drawing analysis led us to examine textbook passages and create an online survey to gather more data on students’ conceptions of these terms. Our findings revealed that many students hold rather superficial, imprecise ideas of a gene. Students in our qualitative drawing study, represented genes at the chromosomal level and described genes as entities responsible for trait/characteristics. Very few students described genes as regions of DNA that encoded an RNA or protein product. This finding is perhaps not surprising, as the concept of a gene is extraordinarily complex and highly context dependent. A collection of videos curated by the National Human Genome Research Institute illustrates this point as 11 high profile experts each provide their definition of “What is a gene?” (National Human Genome Research Institute, 2013). More surprising was how students chose to represent the concept of gene expression using drawings. We found 45% of students in our study represented this concept using a Punnett square, while none of the faculty experts did. Only half of the students in our qualitative study described gene expression in terms of a molecular process (while all experts did), and 67% of students linked gene expression with phenotypic outcomes (while none of the experts did).
Machamer and colleagues (2000) argue that “mechanistic reasoning” is a specialized type of reasoning needed to understand the complex interactions and molecular mechanisms of a cell. When asked to describe gene expression, experts consider how regulatory gene regions and the DNA template itself interact with transcriptional proteins to produce mRNA, but only under certain conditions. In other words, experts describe gene expression with a “how” answer—they describe a process. Learners, particularly beginning students, focus on the outcome of gene expression, but not the underlying process. While our results were initially surprising (to us), they align with other work describing the difficulties students have in providing mechanistic reasoning, such as the inability of learners’ to connect the role of proteins to the high-level phenomena of hereditary traits (van Mil et al., 2013, 2016). Our work is important, because it highlights the conceptual models students have of “genes” and “gene expression” and may help explain some of the difficulties students have learning topics in molecular biology and genetics. For example, many learners do not grasp what the term “dominance” actually means in genetics (Allchin, 2000; Abraham et al., 2014; Newman et al., 2020). Our outcomes versus process framework posits that students who misunderstand dominance are not thinking of the underlying processes, particularly how the production and interaction of gene products (proteins) at the molecular level explain the development of a trait or phenotype.
We are not suggesting that students who provided the outcomes explanation do not have knowledge of molecular processes; they may be familiar with the processes of transcription and translation. However, students may struggle to articulate molecular processes, because their knowledge is fragmented, rather than integrated (Southard et al., 2016). Therefore, the terms that are connected for an expert (e.g., “gene” is connected with “transcription”) may not be strongly associated for a learner. For these students, the term “gene expression” does not appear to prime them to think about molecular processes, so they gravitate toward something they are more familiar with—Punnett squares and phenotypes. In contrast, experts and Advanced students do appear to be primed to think about the processes of transcription and translation when they hear or read the term “gene expression.” Images of chromosomes and Punnett square diagrams could be used to correctly illustrate ideas of gene expression, but it would require a sophisticated mechanistic explanation of gene expression at the molecular level (e.g., transcription and translation of a particular allele results in a functional or nonfunctional product that contributes to a particular phenotype by a particular molecular pathway). Research subjects in our study did not provide this reasoning. We found that students with expert-like models of gene expression (students who chose operons or central dogma images to match their own models of gene expression were more likely to use mechanistic reasoning when asked to explain a genetic outcome (illustrated by a Punnett square diagram).
Implications for Teaching
There is rarely a simple, direct link between genotype and phenotype, and students have trouble reasoning all of the “in-between” steps (Briju and Wyatt, 2015; Phelps-Durr, 2016; Mann et al., 2017; Weigel et al., 2020). Thanks to the molecular biology revolution, understanding the in-between steps (mechanistic understanding) is now possible (Kemble et al., 2019), and biology educators should strive to help their students uncover and learn these hidden processes. Unfortunately, the propensity of students, particularly beginning and intermediate students, to focus on phenotypic outcomes rather than molecular processes may contribute to the adoption of ideas linked with genetic determinism. Learners who hold ideas of genetic determinism may inappropriately attribute agency and the ability of a gene to automatically result in a phenotype with no intermediary or secondary processes. Gericke described this idea, “as if the trait was already contained in the gene” (Gericke et al., 2017, p. 1226). Deterministic views are problematic for both genetic and health literacy, as these ideas may lead people to undervalue environmental factors in complex diseases such as mental illness, cancer, and other public health threats (Parrott et al., 2004; Carver et al., 2017). Unfortunately standard genetics curricula may help cement ideas of genetic determinism in students (Castera et al., 2008; Mills Shaw et al., 2008; Dougherty, 2009; Castéra and Clément, 2014; Jamieson and Radick, 2017) instead of encouraging students to think more critically and with a systems view (as described by Brownell et al., 2014). Deterministic views also ignore elements of randomness, which are extremely important in terms of selection and inheritance, but conceptually difficult for students to acknowledge (Klymkowsky and Garvin-Doxas, 2008; Henson et al., 2012).
Introductory biology curricula often limit discussion of genetics to descriptions of meiosis and analysis of Mendelian inheritance using Punnett square diagrams (Batzli et al., 2014). These Punnett square diagrams are quite common in introductory books and appear in chapters such as “Mendel and the Gene Idea” from Campbell Biology in Focus (Urry et al., 2016), “Mendel and the Gene” from Biological Science (Freeman et al. 2016), and “Inheritance, Genes and Chromosomes” from Principles of Life (Hillis, 2012). In each of these three textbook examples, Mendelian inheritance chapters appear before chapters describing the molecular basis of inheritance and the molecular basis of gene expression. One interesting future research question is to ask whether this sequence promotes outcomes thinking over process thinking in molecular genetics. Some educators and researchers in genetics education have argued that the genetics curricula should be reversed and should not begin with Mendelian traits but should lead with inheritance and expression of measurable continuous traits influenced by numerous genes and environmental inputs (Dougherty, 2009; Redfield, 2012; Duncan et al., 2017). Educators who lead with Mendelian genetics may be inadvertently encouraging rote memorization of crosses and outcomes before students have grasped the underlying molecular processes that actually lead to expression of proteins and, later, traits. Once a faulty schema is established, it is difficult to deconstruct it to learn a new way of thinking (Chi, 2013).
Only one of the textbooks analyzed (Campbell Biology) included molecular-level explanations of phenotypic outcomes in text surrounding a Punnett square figure: “The maternally inherited chromosome (red) has an allele for white flowers, which results in no functional protein being made…. Through a series of steps, this DNA sequence results in production of an enzyme that helps synthesize purple pigment” (Reece et al., 2013, p. 271). We suggest that educators adopt and/or create visuals that, like this example, explicitly connect molecular processes with phenotypic consequences and challenge students to create these links multiple times during the curriculum. For example, perhaps students can annotate traditional Punnett square diagrams with DNA sequences showing nucleotide differences between the two alleles. We also suggest educators make the meaning of gene expression explicit and help students articulate the differences between gene expression (the molecular processes transcription and translation) and expression of a trait (multiple proteins working together that result in an observable phenotype) during instruction. These ideas may promote mechanistic reasoning and help students focus on underlying processes, but more research is needed.
Implications for Future Research
A question for future research is whether the term “expression” is used in the context of phenotypic expression rather than gene expression in textbooks. The use of the former term is more common in the vernacular and not incorrect but may cause confusion due to its similarity with the molecular biology term. We also wonder whether learners confuse “gene” and “genetics” and thereby retrieve inappropriate information when challenged to think about concepts in molecular genetics. Future studies should focus deeply on student understanding of Punnett square diagrams and their ideas about when and why these visual tools should be used. Our finding that gene expression equates to the molecular processes of transcription and translation for experts but often equates to a monohybrid cross such as “BB × bb” for learners is concerning. Experts demonstrate mechanistic reasoning (based on molecular processes), while most beginning and intermediate students focus more on phenotypic outcomes and do not provide mechanistic reasoning. Future studies could focus on tracking students (on course assessments, in later parts of the curriculum) who display different reasoning patterns about gene expression. We hypothesize that students with expert-like reasoning abilities have a higher success rate in more advanced courses such as genetics. We can also ask what happens to students who do not develop expert-like reasoning about genes and gene expression. Are these students lost from the discipline? Biology educators need to be aware of communication and conceptual gaps between themselves and their students if they are to design and implement useful classroom activities and curricula to improve learning. Future research should focus on interventions and assessments that could be used to encourage expert-like reasoning about gene expression and other concepts in molecular genetics.
ACKNOWLEDGMENTS
This work was supported by the Thomas H. Gosnell School of Life Sciences at Rochester Institute of Technology and National Science Foundation grant DUE-1757477. We thank Tony Wong for advice on statistics and all of our research participants for their participation.


