The DNA Landscape: Development and Application of a New Framework for Visual Communication about DNA
Abstract
Learning molecular biology involves using visual representations to communicate ideas about largely unobservable biological processes and molecules. Genes and gene expression cannot be directly visualized, but students are expected to learn and understand these and related concepts. Theoretically, textbook illustrations should help learners master such concepts, but how are genes and other DNA-linked concepts illustrated for learners? We examined all DNA-related images found in 12 undergraduate biology textbooks to better understand what biology students encounter when learning concepts related to DNA. Our analysis revealed a wide array of DNA images that were used to design a new visual framework, the DNA Landscape, which we applied to more than 2000 images from common introductory and advanced biology textbooks. All DNA illustrations could be placed on the landscape framework, but certain positions were more common than others. We mapped figures about “gene expression” and “meiosis” onto the landscape framework to explore how these challenging topics are illustrated for learners, aligning these outcomes with the research literature to showcase how the overuse of certain representations may hinder, instead of help, learning. The DNA Landscape is a tool to promote research on visual literacy and to guide new learning activities for molecular biology.
INTRODUCTION
Molecular biology is challenging for learners, because biomolecules (e.g., DNA, RNA, and proteins) and biomolecular processes (e.g., DNA replication, transcription, and RNA processing) are not directly visible to the observer. DNA, which is both unimaginably large (e.g., some human chromosomes are hundreds of millions of base pairs long) and incomprehensibly small (e.g., 6.2 billion base pairs of DNA fit inside a human nucleus 10 µm in diameter), is at the heart of almost all topics in molecular biology. Teaching and communicating about topics in this realm rely heavily on visual representations (Evagorou et al., 2015), which are often difficult for novices to handle (Daniel et al., 2018; Wright et al., 2018). Visual representations are simplified models that appear in biology textbooks, teaching materials, and even as hastily constructed drawings on whiteboards during instruction. No instructor, no matter how dedicated or experienced, can possibly write out millions of nucleotides on the board to illustrate one “real” chromosome! Thus, shorthand symbols (e.g., chromosomes drawn as “X's,” boxes and lines to represent genes) are often used to communicate with learners during instruction. Whether or not learners “see” the same things in these representations as their instructors remains an open question.
Visual literacy skills, which involve the ability to comprehend and create visual representations (Trumbo, 1999; Schönborn and Anderson, 2006; Towns et al., 2012), are used almost daily by professional scientists and experts. Visual representations in classroom settings can be critical for allowing students to develop and practice scientific reasoning skills, because they provide something to reason about (Anderson et al., 2013). But undergraduate students do not have expert-like skills in visual literacy; these skills must be developed through practice (Schönborn and Anderson, 2006; Tibell and Rundgren, 2010; American Association for the Advancement of Science, 2011). Recent work has established a hierarchy of tasks involving visual representations in teaching biochemistry, based on Bloom's taxonomy (Arneson and Offerdahl, 2018). This Visualization Blooming Tool is useful for examining not just which visuals are employed, but how they can be used to foster higher-order cognitive skills (HOCs). Whereas visual representations can be used simply to test knowledge or comprehension (lower-order cognitive skills), they can also be used to probe students on their conceptual understanding of the underlying process (i.e., analysis, evaluation, synthesis). Because experts typically work at those higher levels, teaching students to apply HOCs to visual representations is a key learning outcome that undergraduate educators need to work toward.
Visual literacy skills cannot be mastered in a vacuum; rather, conceptual understanding and visual literacy within the discipline go hand in hand. In other words, visual information within external representations is processed based on existing conceptual knowledge (Stylianidou, 2002). In the field of biochemistry, Schönborn and Anderson (2006) have described many factors that influence to what extent learners can visualize and interpret external representations. Two of those factors are the students’ ability to reason with their own conceptual knowledge and how well they understand concepts related to the representation. In other words, if learners do not have at least some content knowledge, they will not be able to reason productively about a representation. Furthermore, Schönborn and Anderson (2006) argue that well-designed instructional activities that support development of visual literacy can also enhance conceptual understanding, and vice versa.
An additional component of visual literacy is the ability of learners to create visual representations of their own (Schönborn and Anderson, 2010). In biology, creating visual diagrams is often limited to the ability of learners to correctly construct graphs (Coil et al., 2010; Angra and Gardner, 2017). Quillin and Thomas (2015) argue that drawing is an important skill that should be acknowledged as a scientific tool for reasoning in biology, as is described for chemistry (e.g., drawing bonds and molecules) and physics (e.g., vectors). Image interpretation and image creation are not separate categories but ends of a continuum of visual learning (learning using images). From a pedagogical standpoint, asking students to create a visual or drawing of their own conceptual models is an example of active learning; learners must construct new knowledge based on previous knowledge and experience.
Instructors and/or researchers may glean important insights into student understanding by asking students to draw their ideas. For example, recent work from our laboratory elucidated striking differences between how biology learners and biology experts conceptualize “gene expression” through their own drawings: nearly half of biology learners drew Punnett squares and phenotypic outcomes (e.g., individuals with large vs. small ears), while 100% of experts drew molecular processes of transcription and translation (Newman et al., 2021). In another instance, we once had a student research participant say to us, “What's in the box? Why don't you ever show us what's in the box?,” when trying to decipher a typical box-and-line gene diagram of an operon during a research interview (unpublished data). These observations, combined with some of our previous work exploring textbook depictions of the process of meiosis (Wright et al., 2020) and how learners interpret the arrow symbol in the central dogma diagram (Wright et al., 2014), led us to think about the vast landscape of representations in the world of molecular biology. Because DNA is at the heart of nearly every topic in molecular biology, investigating how DNA is illustrated for learners is important if we are to further understand how students use visuals to learn concepts and develop visual literacy skills to learn concepts related to molecular biology. Through our work, we set to answer the following research questions: 1) What are the important/common features of DNA representations found across undergraduate biology textbooks? 2) How often are different DNA representations used in undergraduate textbooks in general and for specific topics?
METHODS
Our methodology involved both the creation and the application of a new framework, called the DNA Landscape. Figure 1 provides an overview of the process, which we divided into three stages: themes, initial framework, and landscape framework, all of which are explained in detail in the following sections.
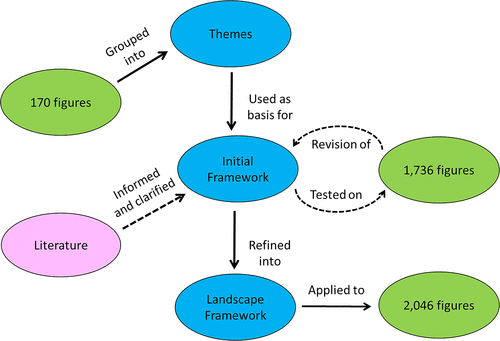
FIGURE 1. Creation and revision of the DNA Landscape framework. A flowchart of the process is illustrated with blue ovals for stages of the framework development; green indicates data, and pink shows theories that informed the work.
Development of Themes, Initial Framework, and Landscape Framework
To better understand the wide variety of DNA representations commonly found in undergraduate biology textbooks, we analyzed 170 figures (total) from nine different biology textbooks (Supplemental Table 1). For this analysis (Figure 1, Themes stage), we focused only on sections or textbook chapters involving transcription and gene expression. We did not attempt to analyze entire chapters or entire sections of textbooks; we sought to identify common types of DNA illustrations used, such as “double helix” or “sequence.”
Once we had a sense of the types of DNA representations commonly found in textbooks, we expanded our analysis to develop the initial framework (see Figure 1). We used the same nine textbooks from the themes stage but expanded the analysis to include all DNA-containing figures within the chapters that were identified in the original study. To balance the number of introductory and advanced textbooks, we incorporated three additional books for a total of 12. In the end, our expanded analysis included 1736 figures (Supplemental Table 1). We had two independent coders (E.W. and J.S.) during this part of the study and found that DNA representations frequently fell into multiple categories, resulting in low interrater reliability scores. Discrepancies were discussed with the larger research group, often resulting in clarification or revision of codebook descriptions. Eventually a new scheme emerged (Figure 1, Landscape Framework) that took into account both scale and levels of abstraction, for which a 3 × 3 matrix began to take shape. We consulted the literature as we made further adjustments to our framework. For example, description of the macro-, micro-, and sub-microscales of visual representations from the chemistry education research literature was helpful as we revised our framework (Johnstone, 1991, 2000). We also incorporated ideas proposed by Talanquer (2011) in considering how a phenomenon was being represented and the scale/level the representation was focused on. For DNA representations, we considered “small” the level of nucleotides, “medium” the level of a gene, and “large” the level of a whole chromosome or genome.
Application of the Framework to Textbook Images
Once we had finalized our 3 × 3 matrix, we returned to the 12 textbooks and conducted a page-by-page search to ensure we coded all possible DNA figures within each of the textbook. This resulted in figures being added to our study, but in some cases, it also resulted in figures no longer being coded, because they were not agreed-upon representations of DNA (e.g., dendograms or figures involving only RNA representations with no accompanying images of DNA). Our final analysis totaled 2046 figures: 569 figures from six introductory books and 1477 figures from six advanced books (Supplemental Table 1). As each figure was analyzed by the type of DNA representation it contained, it was also categorized by content (e.g., gene expression, DNA replication), as described in the figure legend.
All figures were analyzed by two coders (E.W. and L.T.). Figure legends and descriptions were used to determine content categories. E.W. and L.T. coded a subsection of figures independently and then compared results to ensure coding consistency. All figures were then recoded using the final scheme until a high degree of agreement was reached (Cohen's kappa > 0.8 for interrater reliability). The entire process was extensive and took more than 2 years to complete. The final product (Figure 2) is a comprehensive overview of how DNA figures are illustrated in a wide variety of college biology textbooks.
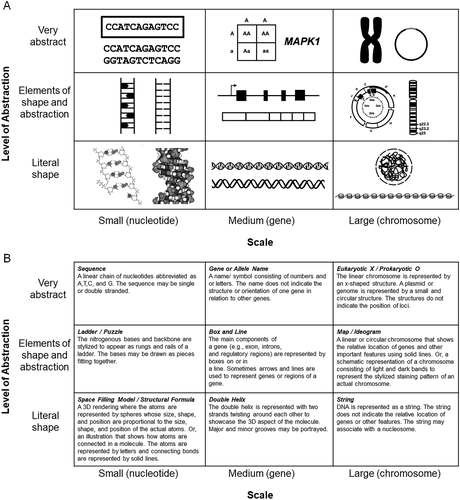
FIGURE 2. The DNA Landscape and Category Definitions. (A) Examples of DNA illustrations that would fall into each of the nine categories of the DNA Landscape with scale indicating the focus of the illustration, and level of abstraction indicating the relationship to the actual molecule. (B) Definitions for each of the nine categories of the DNA Landscape.
Analysis
Heat maps were created to quantitatively show how categories of the DNA Landscape are used throughout introductory and advanced textbooks overall, and how the landscape is used to illustrate topics linked with gene expression and meiosis. Each category was analyzed for the proportion of total coded figures it represented, and the percentages were then used as the basis of color coding to provide a visual map. Note that the totals add up to greater than 100%, because many figures contain multiple representations.
RESULTS
Research Question 1
After our preliminary analysis, we found that DNA representations ranged from abstract to realistic. The main themes that emerged from the analysis were chemical structure, sequence, helix, ladder, box and line, chromosome and informational. For how a particular phenomenon was being represented, we used a scale of realism; images were drawn to mimic reality (showcasing the actual structure), were very abstract (few to no underlying structures or contexts were included) or fell somewhere in between (some structural information was presented, but the illustration did not try to mimic reality). Thus, we constructed a framework for DNA representations to incorporate both scale and the degree of realism, giving us a 3 × 3 matrix of nine distinct intersection points (Figure 2A). Our final codebook is presented in Figure 2B.
The initial figures used in the first analysis were found in chapters about the molecules of life, DNA replication, and gene expression and regulation. As the analysis continued, chapters on topics such as DNA repair, genome structure, inheritance, cell division, and evolution were used to identify DNA-related figures. The content areas were established after the research team went through all of the figures and sorted them into broad categories of DNA replication, gene expression, meiosis, mutation, evolution, structures (illustrations of molecules not involved in any particular process), mitosis, DNA repair, chromosome visualization, chromosome packing, and prokaryotic genetics.
Research Question 2
The DNA Landscape framework was used to classify more than 2000 textbook representations of DNA (Figure 3). All of the figures could be placed in one of the nine boxes, but some areas of the landscape were used more frequently than others. In general, textbooks focused more on the levels of genes and chromosomes than on nucleotides. Maps and ideograms were less common representations and tended to be used only in chapters focusing on certain aspects of genetics. The double helix type of illustration, on the other hand, is found throughout many different chapters of many different textbooks.
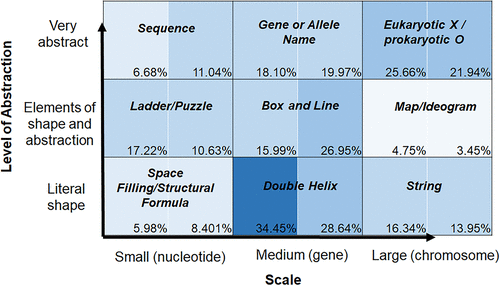
FIGURE 3. The Landscape of DNA representations in textbooks. Analysis includes six introductory (569 figures) and six advanced (1477 figures) textbooks. Each square on the matrix is divided in half: figures from introductory books are on the left, and figures from advanced books are on the right. The percentage of figures that fell into each category for all introductory or all advanced textbooks is shown, with shading corresponding to frequency of usage (lightest for least common, darkest for most common, where every 10% increase is shaded a little darker).
While the overall pattern of usage is interesting, we wanted to see how particular challenging concepts, such as “gene expression” and “meiosis” mapped onto our framework (Figures 4 and 5). Not surprisingly, figures related to gene expression were commonly drawn at the medium level (the gene level). The more realistic double helix drawing was used most often in both introductory (45.11%) and advanced (43.60%) textbooks, but the midlevel box-and-line representation (22.13% and 29.73%, respectively) and abstract gene or allele name (30.21% and 23.78%, respectively) were also used frequently.
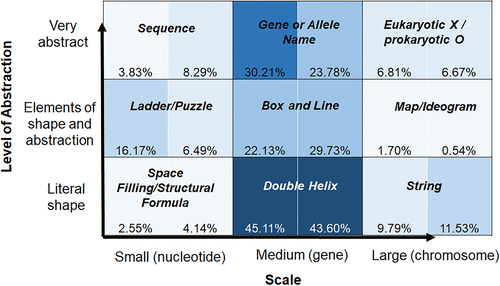
FIGURE 4. The Landscape of DNA representations about gene expression. Analysis includes six introductory (235 figures) and six advanced (555 figures) textbooks. Each square on the matrix is divided in half (introductory books, left; advanced books, right). The percentage of figures that fell into each category for all introductory or all advanced textbooks is shown, with shading corresponding to frequency of usage.
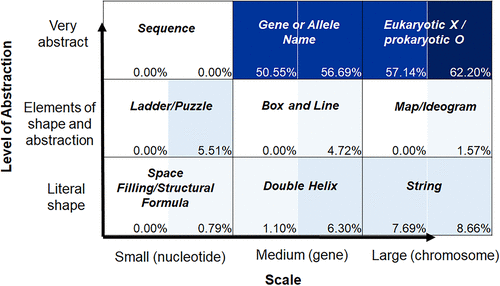
FIGURE 5. The Landscape of DNA representations about meiosis. Analysis includes six introductory (91 figures) and six advanced (127 figures) textbooks. Each square on the matrix is divided in half (introductory books, left; advanced books, right). The percentage of figures that fell into each category for all introductory or all advanced textbooks is shown, with shading corresponding to frequency of usage.
In contrast, figures related to the process of meiosis were found to be overwhelmingly at the most abstract medium (gene or allele name, 50.55% for introductory and 56.69% for advanced) and large (chromosome, 57.14% for introductory and 62.20% for advanced) levels. There were hardly any figures in any of the other categories; string was the greatest, with 7.69% and 8.66%. This is consistent with previous work, which found that molecular representations (i.e., nucleotide level) are missing from most textbook discussions and drawings (Wright et al., 2020).
DISCUSSION
We present a novel framework that can used to better understand how DNA-linked topics in biology are communicated to learners through visual representations (Figure 2). We applied this framework to more than 2000 DNA representations found in a wide variety of biology textbooks (Figure 3). Using our framework, we also took a deeper look into how the topics of gene expression and meiosis are presented to learners (Figures 4 and 5). Findings from our analyses may even begin to shed light on why certain topics are difficult for biology learners to grasp.
Development of the Framework
Our preliminary framework was a continuum, similar to work described by Roth and Pozzer-Ardenghi (2013). This continuum was based primarily on abstraction, where more “realistic” and “detailed” content (e.g., the chemical structure of a nucleotide) was on one end and purely informational content (e.g., AGCT) was on the other. When two independent researchers worked through a new set of textbook figures using the DNA continuum to categorize figures, problems were encountered—illustrations frequently fell into multiple categories and interrater scores were low. We realized the fundamental problem of the original linear framework boiled down to this: a short sequence of nucleotides, a single gene, and an entire chromosome are all “DNA,” but they emphasize different aspects of the molecule! Putting all of the DNA representations on the same continuum, without acknowledging scale, did not make sense. We considered the chemistry education research literature acknowledging the macro-, micro-, and sub-microscales of visual representations (Johnstone, 1991, 2000), referred to as “Johnstone's triangle” or the “chemistry triplet.” Talanquer (2011) offered a further expansion of the chemistry triplet by acknowledging how a particular phenomenon is being represented and the scale/level the representation focuses on. In terms of DNA representations, we considered “small” being at the level of nucleotides, “medium” being at the level of a gene, and “large” being at the level of a whole chromosome or genome. Thus our final framework was the 3 × 3 matrix shown in Figure 2.
Representations of Gene Expression
Concepts linked with gene expression are often difficult for students to grasp (Marbach-Ad and Stavy, 2000; Wright et al., 2014; Briggs et al., 2016; Southard et al., 2016), so we were keen to understand how material was showcased for learners. Figures about “gene expression” illustrated processes of transcription, transcriptional regulation, and protein translation. We note that representations that focused solely on the process of translation (e.g., a ribosome catalyzing peptide bonds in a growing polypeptide chain) would not be included in our analysis if the figure did not contain an image of DNA. Both introductory and advanced textbooks favored the medium (gene) scale, which is not unexpected, given the topic. What is more surprising is the relative lack of focus of figures that illustrate the nucleotide structure/sequence within a molecule of DNA.
Students have difficulties understanding topics linked to gene expression and regulation, which may be exacerbated by the types of illustrations they encounter, especially if the illustrations are mainly of the same type. For example, some students do not realize promoters are sequences of DNA (Newman et al., 2016), a fact that may not be obvious when box-and-line diagrams are used. During our research, we came across a textbook operon diagram that may be particularly problematic, as both the regulatory operon regions (DNA) and interacting transcriptional proteins were shown to interact together like LEGO brick pieces snapping in place. To naïve learners, this illustration might suggest that gene regulatory regions and transcriptional proteins are the same type of molecule (which is untrue). Prior research also reveals that students struggle to articulate what, exactly, transcription really is (Wright et al., 2014), so figures that focus only at the gene level may not help students connect the idea that specific building blocks (ribonucleotides) are used in the synthesis of a new complementary RNA molecule during transcription. Signal transduction pathway diagrams that showcase an increase or decrease in “gene expression” with up and down arrows next to gene names may also be confusing to learners because of the abstract way that gene expression is being portrayed.
We are not suggesting that certain types of figures are “bad” and should not be used during instruction. Learners need to be familiar with a wide range of representations, including those used by professional scientists. Instead, we caution instructors to avoid relying on the same kinds of figures, over and over, and suggest instructors should take care to make sure different parts of the DNA Landscape are incorporated at least some of the time when discussing concepts linked to gene expression. They should also be sure to explain the representations and relate them to each other (e.g., a box defines a segment of DNA sequence such as an exon).
Representations of Meiosis
We also mapped figures pertaining to the process of meiosis, a notoriously tricky topic for students (Newman et al., 2012; Kalas et al., 2013; Wright et al., 2017) using the DNA Landscape tool (Figure 5). Here, we found that meiosis figures are overwhelmingly positioned at the abstract medium (gene) and abstract large (chromosome) levels. Based on what has been published on student difficulties about meiosis, we suggest textbook figures about meiosis maybe particularly problematic for learners for several reasons. First, many students see homologous chromosomes as simply having the same size and shape, not recognizing that the pair share nearly identical nucleotide sequences—the actual basis of homology (Wright et al., 2017). Few figures highlight any nucleotide-level homology and instead rely on abstract images of entire chromosomes that are usually colored differently to indicate parental origin. We hypothesize that homologous chromosomes shown as two distinct colors, without any nucleotide sequence included, incorrectly prime students to focus on the differences in homologous chromosomes (e.g., red vs. blue) and on the superficial aspects of chromosome size and shape and miss the underlying reason for homology.
Furthermore, meiotic recombination involves the formation of crossovers, structures that are essential for proper chromosomal segregation and new combinations of alleles to be created (reviewed in Hunter, 2015). The processes of crossing over and meiotic recombination rely on sequence-level homology between paternal and maternal strands, a fact that is lost on the majority of biology students (Wright et al., 2017). Typical crossing over figures showcase a portion of a maternal (e.g., red) chromosome that has swapped places with a paternal (e.g., blue) chromosome of the same size and shape with no attention to the underlying molecular structure of nature of the processes. In the absence of the incorporation of, for example, complementary nucleotide sequences aligning between the homologues, we posit that the concepts of “genetic recombination” and the “creation of new alleles” is quite mysterious to students, especially when all they see are red and blue lines or allele designations of “A” and “a.” Recent work from our laboratory highlights the importance of including multiple aspects of DNA, such as DNA sequence paired with overall chromosome shape, when teaching students about the concept of homology and how it relates to the process of crossing over. In a recent study, students made impressive learning gains on meiosis concepts using a model-based activity that incorporated DNA sequence and overall shape of a homologous pair (Wright et al., 2021). Although the use of a handheld model is not the same as simply observing textbook images, the strength of this activity is rooted in the DNA landscape; incorporation of multiple scales of DNA is essential for deep learning.
Implications and Future Directions
Instructors could use the framework to reflect on their own educational approaches to teaching particular concepts by asking, “Are my students exposed to a number of different DNA representations or do they see the same type of visuals again and again?” Our framework could be used to help students create bridges between seemingly disparate (for learners) levels of representations. For example, how does a sequence of nucleotides relate to the image of a whole chromosome? How does the image of a whole chromosome relate to an image of a nucleosome? The relationship is obvious to an expert, but this is difficult for many biology learners. The literature provides many examples of students’ inabilities to conceptualize chromosome structure in the context of meiosis (Kindfield, 1991; Dikmenli, 2010; Wright and Newman, 2011; Kalas et al., 2013). Typical problematic conceptions include showing maternal and paternal chromatids joining together instead of producing identical sister chromatids through replication, incorrect ideas about the number of molecules or number of strands of DNA present, and incorrect labeling of alleles. The DNA landscape could provide added context for understanding student difficulties conceptualizing chromosome structure in relation to genes and alleles. In other words, these issues may arise because students cannot link the chromosomal-level representation (highly abstract, large scale) to the gene level (demonstrated with allele labels) or the molecular (nucleotide) level.
As one moves up the grid from “realistic” to “abstract” representations, an expert can likely draw a clear connection to the prior levels and can retain the more concrete versions as an unseen part of the more abstract image, having “chunked” them into abstract shapes or symbols. The importance of starting with realistic and moving to increasingly abstract representations has been described in physics and engineering education research (Reisslein et al., 2010; Fredlund et al., 2014). Weliweriya and colleagues (2018) describe this process as “standing fast”—building successively more generalized/symbolic figures as students gain experience until they have a solid conception. We invite the biology education research (BER) community to consider whether biologists do the same or whether we often jump right to the most abstract levels. While abstract representations are extremely useful for discussions of DNA, it seems likely that students need to build that understanding stepwise, like they do in other disciplines. Otherwise they cannot “stand fast,” because their foundation is shaky.
No single representation can capture a “disciplinary way to knowing” (Airey and Linder, 2009; Offerdahl et al., 2017). Students must work with a combination of representations to gain knowledge about a particular biological phenomenon. Thus, the DNA Landscape framework may be a useful tool for challenging students to decipher (or create) visuals they may not be as familiar or comfortable with. For example, what does a “mutation” look like in the context of a few nucleotides? What does a mutation look like in the context of a gene? A genome? Can students interpret representations of mutations that are abstract and realistic? We hypothesize that a learner who can productively use most, if not all, of the matrix to describe a particular DNA-linked phenomena, like a mutation, will have a high level of knowledge about that concept. We can test this hypothesis, as well as others, using the DNA Landscape. We are currently investigating whether subdisciplines of biology focus on different representations and whether students can connect what they learn in different contexts. Others in the BER community could use the tool to explore potential gaps or differences between novice and expert conceptions of biological phenomena and investigate how students develop visual literacy about DNA representations.
ACKNOWLEDGMENTS
We thank the Science and Mathematics Education Research Collaborative at RIT for helpful discussions. D.M.A. was supported by a fellowship from the RIT Howard Hughes Medical Institute Inclusive Excellence grant. Jesse Howard helped in the themes stage of the project.


