Re: The Use of a Knowledge Survey as an Indicator of Student Learning in an Introductory Biology Course
Reliability is a fundamental quality of the internal consistence of any measuring instrument. Researchers sometimes use “reliable” and its derivative terms, yet fail to address reliability. Bowers et al. (2005) claimed that the knowledge survey (KS) “does not reliably measure student learning as measured by final grades or exam questions.” They addressed their purpose (p. 311) “to evaluate how closely students' performance track with their confidence in their knowledge of the course material,” through correlating “plotted pre- and post-KS scores against final grades (p. 314).” This approach assumes that tests/grades of unknown reliability are appropriate standards for judging other measures. Their article offers a case study in drawing conclusions without considering reliability.
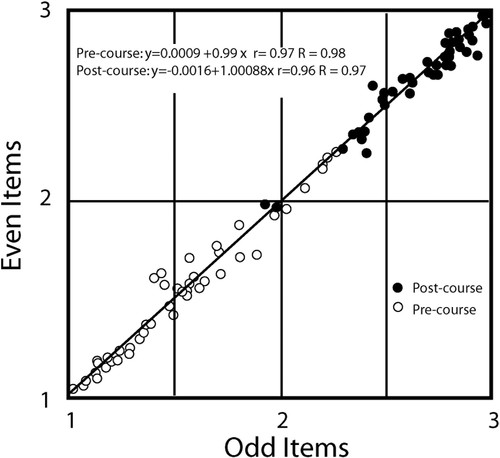
The split-halves Spearman-Brown reliability (R) measure (Jacobs and Chase, 1992) derives from the r (r) obtained from individuals' scores on two halves of a single test. It is a routine method for quantifying reliability and is applicable to both tests and knowledge surveys. When Bowers et al. attributed specific claims to us: “They report that KS results represent changes in students' learning (p. 311),” and “… are a good representation of student knowledge (p. 316),” they omitted mention of the surprising reliability that characterizes knowledge surveys' pre- and postcourse measures (Figure 1).
Figure 1. Scattergram of reliability (R = 0.98 precourse and 0.97 postcourse) measures on 49 students' pre- and postcourse knowledge surveys in an introductory geology course at Idaho State University. These students come from the same population as those described in Bowers et al.
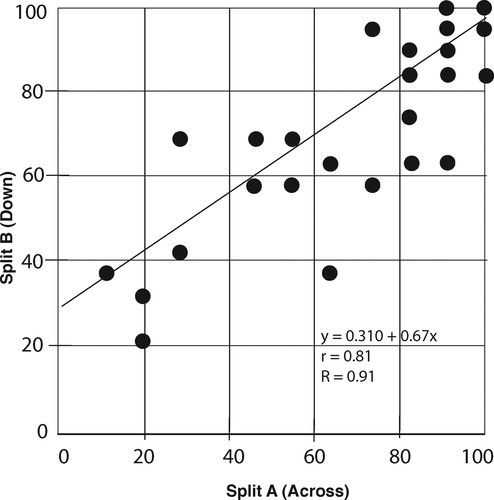
Figure 2 shows a contrasting split-halves reliability for a faculty-made test of unusually high reliability that yields an r of r = 0.8 and a reliability coefficient of R = 0.9. Good faculty-made tests achieve R >0.6 (Jacobs and Chase, 1992), but many yield reliability coefficients of <0.3 (Raoul Arreola, personal communication, April 2005; Theall et al., 2005). In correlating the test in Figure 2 with its equivalent KS, the maximum correlation to expect would be about r = 0.8 (the degree to which the less reliable instrument can correlate with itself). We believe r should be still lower, because we developed knowledge surveys to sample cognitive/affective domains that only partially overlap those sampled by tests (Wirth et al., 2005).
Figure 2. Scattergram of reliability (R = 0.91, derived from a split-halves r of r = 0.81) measures on a short-answer test (30 items, crossword fill-in-the-blank) in an introductory geology course taken by 25 students at Idaho State University.
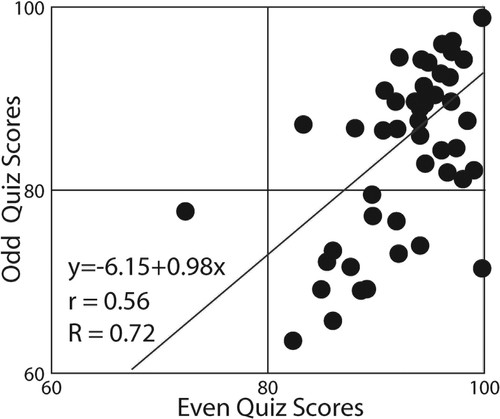
Next, consider the reliability of grades derived by averaging several tests. An example appears in Figure 3. Suppose some tests lack significant correlation with other tests, but, as is common practice, we average all the tests anyway to produce grades. The reliability of grades derived from averaging a mix of tests should be lower than the most reliable tests used during the course. If we correlate grades and KS ratings, what, then, are we actually correlating? Without reliability measures, we cannot know.
Figure 3. Scattergram of an overall reliability measure of course grades derived from 10 highly disparate quizzes (R = 0.72, for 48 introductory geology students at Idaho State University. The split-halves r of r = 0.56 reveals that, even if perfect relationships exist between the course knowledge survey and the grades, the highest r-value expected is only 0.56. The actual correlation was 0.47.
Short-answer tests longer than 40 items usually have good reliability. Such tests define achievement based largely on knowing, as manifested through short-answer test-taking skills under timed conditions. Tests that address open-ended challenges sample other cognitive/affective domains to define achievement based largely on doing, as manifested through written reports and products generated after discussion, reflection, and revision. Such tests serve as much to promote learning and to mentor students to high-level thinking as to produce grades. High reliability is difficult to achieve using open-ended challenges, and quantifying it requires methods too cumbersome for routine classroom use. Many such tests within Figure 3 contribute to lower overall grade reliability than if achievement were derived solely from short-answer tests. One should know general reliability of one's tests/grades to understand what comparisons are possible, but it is less important to optimize a correlation between tests and knowledge surveys than it is to mentor students to engage open-ended challenges. Exceptionally effective courses may show near zero reliability in plots such as Figure 3. In such cases, paired comparisons are impossible, but the assessment value of a well-designed KS as a reliable, complementary measure becomes apparent.
Unrealistic expectations for high numerical correlation coefficients between grades and knowledge surveys persist until one understands limits imposed by reliability. Thereafter, understanding permits better interpretations. The positive numerical correlations Bowers et al. (2005) reported as “low” between their postcourse knowledge surveys and grades then seem surprisingly high, given limits imposed by reliability of tests and grades.
We emphasized assessment of learning in classes through use of aggregate data (Nuhfer and Knipp, 2003), which differs from Bowers et al.'s evaluative efforts to predict an individual's grades from her/his knowledge surveys. At the class level, we were most impressed by Bowers et al.'s Figure 1. It revealed the pattern change from no correlation between grades and the precourse KS to a persistent positive correlation between grades and the postcourse KS. Their tools (tests and the knowledge survey) remained constant through their pre- and postcorrelations, so the profound pattern change seen in every class seems most simply explained by students' increased understanding of specific content. We suggest correlating the high-reliability pre- and postcourse KS measures as an additional change indicator.
Although Bowers et al.'s article derived from our work, neither the authors from Nuhfer's own Idaho State University campus nor the Journal's editors engaged us in review. The result is an article including several attributions to knowledge surveys and our thoughts/intentions that we disclaim. Readers who compare our ideas about knowledge surveys as presented by Bowers et al. with those published in our words (Nuhfer and Knipp, 2003; Theall et al., 2005; Wirth et al. 2005) should anticipate discrepancies.


