Promoting Collaborative Classrooms: The Impacts of Interdependent Cooperative Learning on Undergraduate Interactions and Achievement
Abstract
Collaboration is an important career skill and vital to student understanding of the social aspects of science, but less is known about relationships among collaborative-learning strategies, classroom climate, and student learning. We sought to increase the collaborative character of introductory undergraduate laboratory classrooms by analyzing a 9-week intervention in 10 classrooms (n = 251) that participated in cooperative-learning modules (promoting interdependence via a modified jigsaw technique). Students in an additional 10 classrooms (n = 232) completed the same material in an unstructured format representative of common educational practice. Results showed that, when between-class variance was controlled for, intervention students did not score higher on weekly quizzes, but science interest and prior science experience had a reduced relationship to quiz performance in intervention classrooms. Also, intervention classrooms showed increased collaborative engagement at both whole-class and individual levels (24 students at three time points), but the intervention was only one of several factors found to account for late-intervention classroom collaborative engagement (prosocial behavior and discussion practices). Taken together, findings suggest that integrating interdependence-based tasks may foster collaborative engagement at both small-group and whole-classroom levels, but by itself may not be enough to promote increased student achievement.
INTRODUCTION
The ability to effectively collaborate is a necessity for success in science. Collaboration across science disciplines has grown substantially over the last century (Zhang et al., 2013; Larivière et al., 2015) and is able to predict both one’s contribution to science knowledge (Wang, 2016) and overall success in the discipline (Rotolo and Messeni Petruzzelli, 2013; Sud and Thelwall, 2016). This makes sense because problems in most scientific fields are too complex and large for one individual to solve alone (National Academies of Sciences, Engineering, and Medicine, 2016). Instruction, in contrast, tends to focus inordinately on the procedural and knowledge aspects of science (e.g., protocols, scientific method, and data analysis). While fundamentally important, these must be paired with social aspects of science (e.g., collaboration, peer review, and argumentation) for students to develop a complete grasp of scientific practice (Tanner et al., 2003; Ford, 2008). When students experience these social aspects of science, they not only have the chance to take part in the rhetorical norms of science, but simultaneously take part in actions shown to promote immediate and delayed learning gains (Asterhan and Schwarz, 2007, 2009). Thus, classroom environments that promote rich student collaborative engagement may bolster both learning and experience with the social norms of science.
Despite this potential, the factors promoting collaborative classroom environments and the mechanisms by which they may foster greater undergraduate student learning remain unclear. The specific contribution of collaboration to student outcomes is often hard to assess, because collaboration is rarely the sole focus of an intervention (e.g., it is often paired with inquiry; Seifert et al., 2009; Jensen and Lawson, 2011; Gormally, 2017). The common practice of introducing collaboration in tandem with more active-learning practices (e.g., think–pair–share, problem-based learning, inquiry instruction) means that the impacts of collaborative work on both student learning and classroom environments are often entangled within broader interventions. Also, cooperative-learning models do not just include collaboration, but additional components, like positive interdependence, individual accountability, promotive interaction (i.e., students encouraging one another), social skills, and group processing (Johnson and Johnson, 1999), all of which could be differentially contributing to learning gains. This may be the case, because cooperative learning typically has positive impacts (Johnson et al., 1981; Roseth et al., 2008; Kyndt et al., 2013), but more nuanced investigations of collaborative dynamics have shown mixed results (Barron, 2003; Chiu, 2008; Kuhn, 2015; Marion and Thorley, 2016).
The complex relationships between student collaboration and both student and classroom outcomes, as well as the consistent inclusion of collaboration alongside other interventions and variables, means that student collaboration must be more isolated to understand its impacts in undergraduate science classrooms. In the present study, we evaluate how promoting student collaboration through cooperative-learning modules (designed to only support one aspect of the cooperative-learning model—interdependency) with a modified jigsaw technique (Slavin, 1980) impacts student achievement and interactions in the introductory life science laboratory classroom. We were interested in academic outcomes and the extent to which cooperative-learning structures may be leveraged to generate whole-class communities that can effectively collaborate (Tanner et al., 2003; Premo and Cavagnetto, 2018). This study focuses on the following research questions: 1) Does cooperative learning (structured to encourage interdependency) impact student academic achievement? 2) Does integrating cooperative learning shift student dispositions toward collaboration or collaborative engagement? 3) What factors shape whole-class collaborative engagement (prosocial behavior and discussion practices) throughout a semester?
COOPERATIVE LEARNING AND STUDENT COLLABORATIVE ENGAGEMENT
Cooperative-learning methodologies have historically shown widespread success in promoting student achievement. Review efforts seeking to understand how cooperative structuring impacts learning can be traced back to Johnson et al.’s (1981) meta-analysis of 122 North American studies examining the influence of cooperative learning on student achievement. The outcome of this analysis showed that structuring learning tasks in a cooperative nature resulted in higher student achievement in comparison with competitive tasks. This finding was affirmed by two more recent meta-analyses (Roseth et al., 2008; Kyndt et al. 2013). Roseth et al.’s (2008) meta-analysis included 148 international studies of cooperative learning and affirmed earlier findings by showing that cooperative goals yielded positive effects sizes over both alternative (competitive g = 0.46; individualistic g = 0.55) goal structures in the classroom. These results were again supported by Kyndt and colleagues’ (2013) meta-analysis of 65 post-1995 studies of cooperative learning, which found that cooperative learning increased student achievement (g = 0.54) to an extent similar to what was reported by Roseth et al. (2008). Thus, there is significant evidence that organizing classrooms to align with the cooperative-learning model can have positive impacts on student learning across a diversity of learning environments. It is crucial to note that the cooperative-learning model extends beyond just having students work in groups. Students must experience positive interdependency with their peers, be held individually accountable through formal evaluation, encourage their peers to interact in a group setting, and be reflective about the processes their group goes through during learning. Concomitantly, instructors must enforce specific student social skills (e.g., leadership, trust building, conflict-management skills) for the traditional model of cooperative learning to be present (Johnson and Johnson, 1999). The simultaneous inclusion of all these factors makes the mechanism(s) behind student learning in these classrooms hard to isolate and the specific contribution of student collaboration difficult to evaluate.
In contrast to the cooperative-learning tradition, other lines of research investigating collaboration during learning suggest a more opaque and nuanced view of cooperation (Kuhn, 2015). For example, while cooperative learning is typically treated as a classroom-level factor, it may not always be appropriate to assume that collaboration has a homogenous effect on students. Some investigations into student–student learning have reported that student behaviors during group work can be dramatically different between groups (Barron, 2003; Chiu, 2008; Sampson and Clark, 2011; Molenaar and Chiu, 2017). This heterogeneity means that inconsistent learning gains are often found when students are asked to learn with peers (Barron, 2003; Chiu, 2008; Asterhan and Schwarz, 2009; Sampson and Clark, 2011; Canham et al., 2012). There is also significant research noting a consistent negative effect (termed “collaborative inhibition”; Weldon and Bellinger, 1997; Barber et al., 2015) of collaborative performance of groups over individual performance (i.e., when combining the contribution of each individual student independently). Importantly, even when collaboration has been found to suppress initial group performance, long-term benefits can still accrue from collaborative interaction (Blumen et al., 2014; for a review, see Marion and Thorley, 2016). Thus, the benefits that one receives from working with others in the classroom may only arise after repeated collaborative-learning experiences around related topics over an extended timeline.
Critically, the process of simply putting students in groups does not guarantee rich collaboration (Johnson and Johnson, 1999; Soller, 2001; Kreijns et al., 2003). In fact, unstructured groups can have negative interpersonal effects, including decreased motivation (i.e., social loafing; Ying et al., 2014; Meyer et al., 2016) and the need to contend with interpersonal conflict (Freeman and Greenacre, 2011; de Jong et al., 2014). In other words, unstructured group work can result in negative pressures that accrue on top of the normal apprehension experienced by students participating in classrooms (Howard and Baird, 2000; Frisby et al., 2014). Traditional cooperative-learning approaches explicitly recognize these sources of variance and attempt to reduce their impact on learning by purposefully structuring elements of student interaction (Johnson et al., 1998; Johnson and Johnson, 1999). These include enforcing individual accountability within the group, encouraging promotive interaction among members (i.e., students must encourage and support one another), and framing of tasks in such a way that they support positive interdependency among group members.
All of these elements are critical to the cooperative-learning model of group learning, but there is evidence that positive interdependency (simply termed “interdependency” in many cases) is especially critical to how humans collaborate across diverse social situations (Balliet and Van Lange, 2013a,b; Balliet et al., 2014). Interdependency theory (Rusbult and Van Lange, 2003, 2008; Balliet et al., 2017) argues that, in order to understand social dynamics, one must take into account more than just the individual and overall social environment. In particular, one must also account for how interactions differ based on the degree to which needs and motives are aligned between individuals, because one individual’s actions can impact another’s outcomes (i.e., they are interdependent; Holmes, 2002; Rusbult and Van Lange, 2003, 2008; Balliet et al., 2017). Simply stated, individuals are more likely to invest time and resources into those around them when doing so is likely to encourage the attainment of their own goals.
Not surprisingly, the relationship between interdependency and collaborative engagement has empirical support. Studies examining interdependency within the classroom have shown interdependency to increase observed idea generation (Buchs et al., 2010) and collaborative engagement with a learning task (Lew et al., 1986; Jensen et al., 2002; Buchs et al., 2004; Brewer and Klein, 2006; Moser and Wodzicki, 2007). For example, Buchs et al. (2004) completed a study in which students (n = 64) in pairs were either given different texts (to generate interdependency through dissimilar resources) to generate reliance on their partner or both students were provided the same text. During group work, students in the interdependent condition spent more time explaining (mean resource interdependence [mr] = 397.9, mean comparison [mc] = 316.7, Z = 3.15, p < 0.001), responding to their partners (mr = 2.85, mc = 1.84, Z = 2.62, p < 0.01), asking questions (mr = 2.96, mc = 1.98, Z = 2.34, p < 0.05), and making positive comments (mr = 16.26, mc = 12.87, Z = 2.18, p < 0.05). Additional studies have shown that shifts in individual dispositions are important for collaborative engagement, including group self-efficacy (Alavi and McCormick, 2008), perceived social support (Johnson et al., 1983; Bertucci et al., 2011, 2016), and perceived social cohesion (Lew et al., 1986; Hänze and Berger, 2007). Together, these studies suggest that interdependency in the classroom may be leveraged to generate rich peer–peer collaborative engagement in undergraduate science classrooms. Research examining the observed impacts of longitudinal interdependency in undergraduate science education is rare. Further, the research that does exist does not account for other social factors present in classrooms that have been previously linked to cooperation (e.g., friendship, reciprocity, and concern for one’s reputation; for reviews, see Jaeggi and Gurven, 2013; Kurzban et al., 2015). From this literature analysis, we hypothesize that integrating cooperative-learning modules (designed to promote whole-class interdependency) will generate collaborative classroom environments that maximize the social dynamics needed for science knowledge construction.
METHODS
Participants
Participants in the study included 483 undergraduate students who enrolled in and completed an introductory-level biology course for science majors at a large research-intensive university (all provided consent for participation). Participants all completed the study during a single semester. The participants were 40% freshmen, 33% sophomores, 18% juniors, and 7% seniors, with the remaining 2% continuing education students. Thirty-three percent of participants identified as male, 66% as female, and 1% did not identify with either gender. Participants were primarily Caucasian (66%), with 10% Latino/a, 13% Asian/Pacific Islander, 4% African American, and the remainder either of another race or identifying as multiracial. Approximately 8% of students had never completed an undergraduate science course before the current semester, 44% had completed one to two courses, 33% had completed three to five courses, 12% had completed six to 10 courses, and only 3% had completed more than 10 undergraduate science courses. The participating students reported a strong preference for pursuing a career in a science-related field (90%), with only 5% reporting that they did not plan on pursing a science career and 5% unsure of their future career goals.
Design
We integrated question sets designed to support the theoretical underpinnings of a semester-long course-based undergraduate research experience (CURE) project (part of the SEA-PHAGES program; see Caruso et al., 2009; Harrison et al., 2011; Jordan et al., 2014; Staub et al., 2016) that comprised the laboratory required for all students enrolled in a freshman-level biology course (Introductory Cell Biology and Genetics). The question sets were introduced starting the fifth week of the semester, and students completed a total of nine question sets over the course of the semester. The question sets focused on fundamental concepts in the SEA-PHAGES laboratory; these concepts were identified by the laboratory instructors and graduate teaching assistants (TAs) as areas in which previous students in the course struggled to assimilate knowledge. The themes included evaluating a scientific paper (week 1), phage–bacteria interactions (week 2), logic in experimental design (week 3), experimental troubleshooting (week 4), phages as biological tools (week 5), experimental replication (week 6), serial dilutions (week 7), plagiarism in scientific writing (week 8), and DNA isolation from phages (week 9; see Appendix 1 in the Supplemental Material). There were 21 laboratory sections of 24 students each. The exact same question set was given to every laboratory section each week. Preintervention, the lab sections were divided into a comparison pool (10 unique sections) and an intervention pool (11 unique sections). Because each 3-hour time block during the week had two laboratory sections scheduled in separate rooms, we were able to run simultaneous comparison and intervention laboratory sections to minimize variance due to the time of day that a lab was offered (except for one isolated section).
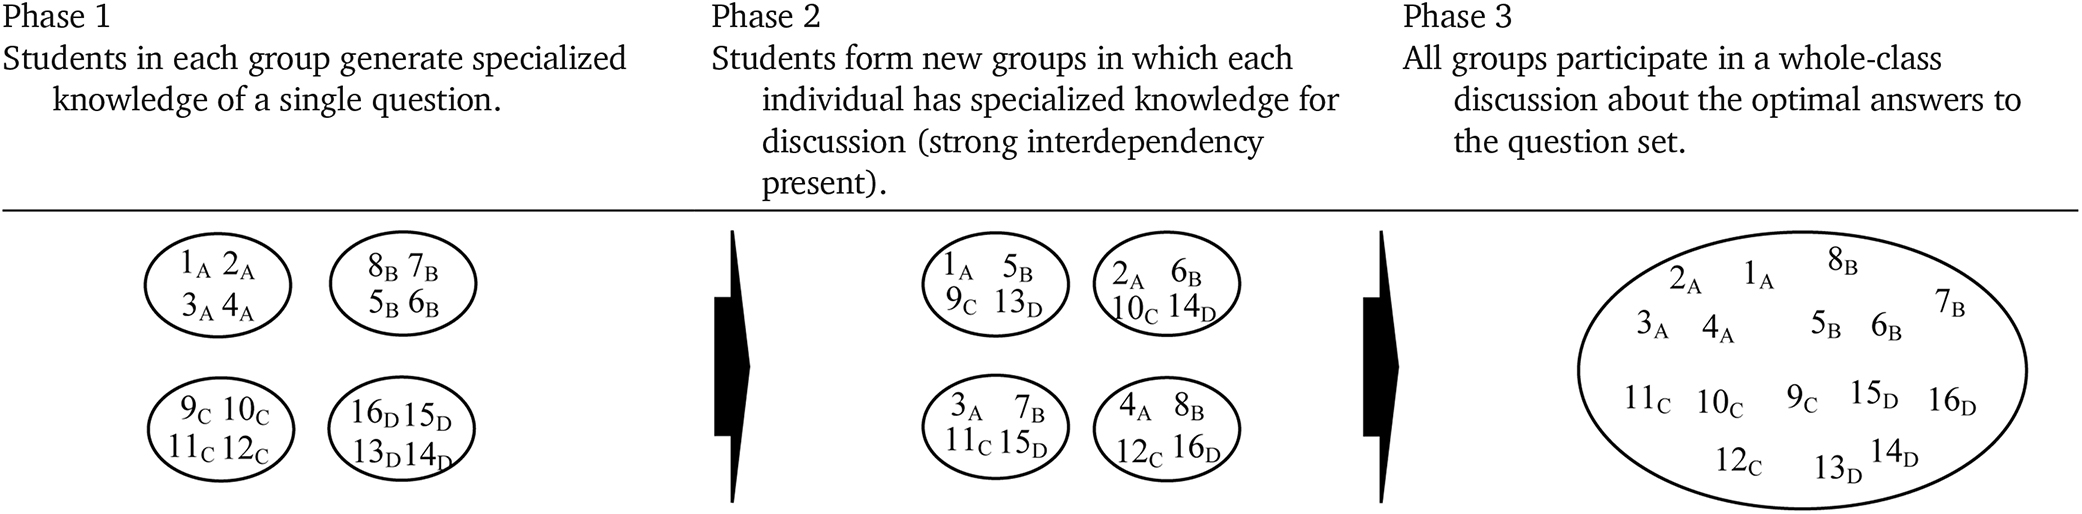
The method by which the students were asked to complete the question sets varied between the comparison and intervention laboratory sections. Students in the cooperative-learning condition (intervention sections) had to work together to address core laboratory topics through structured communication with peers (see Table 1). The end goal of the intervention was the generation of a whole-class understanding of each topic via structured task interdependency. Interdependency was encouraged by splitting how the students completed the questions sets into two distinct phases. During phase 1, each group of four students (about six per lab section) were given a single question from the complete question set and asked to work together to answer it to the best of their ability. This resulted in each table having specialized knowledge about a single question out of the larger set. During phase 2, new groups with four students were formed so that they had within them at least one student with specialized knowledge of each question in the set. In these new groups, the students were required to communicate their specialized knowledge and ideas from their first group, and then work with this second group to refine and expand on their answers to the entire question set. At the end of phase 2, all groups were asked to communicate their answers to each of the questions in the set by writing them on the classroom whiteboard, this was followed by a discussion at the whole-classroom level designed to lead the students in the section to a common, shared understanding. This structure is similar to a traditional jigsaw technique (Slavin, 1980), which has been previously used in undergraduate science instruction (Colosi and Zales, 1998), but with two alterations. First, the structure differed in both the mechanism of original knowledge development (phase 1 was a group instead of an individual learning alone, aligning with Doymus, 2008). Second, the level of integration was different (phase 2 included whole-class rearrangement of individuals into new groups as opposed to individuals forming initial groups). We made these changes because the traditional design did not necessarily lend itself to whole-class collaboration due to design features best compatible for small groups. In contrast to this high level of structure, the comparison condition required each student to complete the question sets using any means he or she chose. There was no communication to students that they could not work with other students, and there was no explicit offered incentive to do so. The total time dedicated to students completing each question set varied from 15 to 35 minutes. The phase 3 discussion (intervention only) took an additional 10–20 minutes. All data-collection and study procedures were approved by Washington State University’s Institutional Review Board (IRB #15680) before initiation of the study.
 |
Instruments
The current study made use of five different sources of data. Data sources included 1) early- and late-semester measures of student perceptions of their classroom social environment (Cooperative Classroom Environment Measure [CCEM]; see Appendix 2 in the Supplemental Material; Premo et al., 2018); 2) weekly observational rating of peer–peer collaborative interactions (Cooperative Classroom Observation Protocol [CCOP]; see Appendix 3 in the Supplemental Material) completed by course TAs; 3) six content quizzes targeting six of the nine module topics; 4) the science-career motivation subscale of the SMQ-II (Glynn et al., 2011) to provide an initial measurement of student science-career motivation before the study; and 5) both video and audio recordings of group collaboration collected from two laboratory sections (one intervention and one comparison) at three separate time points (early, midway, and late) in the intervention. The resulting video and audio recordings were analyzed using an observational coding scheme (see Coding of Individual Students’ Behavioral Engagement section).
For assessment of students’ perception of their classroom’s social environment during the second and final week of class, each study participant completed the CCEM, a self-report instrument that measures student perception of different aspects of the classroom social environment that can impact the likelihood of student cooperation (see Appendix 2 in the Supplemental Material for instrument and Supplemental Table 1 for psychometric properties). We used a version updated from Premo et al. (2018) that included subscales assessing reputational concern, perception of cooperative norms, and a student’s relative investment in cooperation. Prior work has shown that students are disposed toward cooperating with peers under conditions in which their personal resources and energy are likely to be returned (Premo et al., 2017). We added the three aforementioned subscales because the initial measure could not address social pressure at both the individual (reputational concern) or class (perception of cooperative norms) levels and had no direct measure of relative investment in cooperation (Premo et al., 2017). The important role of these subscales in the present study supported their inclusion. An examination of scale reliability for the CCEM showed that standardized Cronbach’s alpha values varied from 0.70 to 0.87 for the pretest and from 0.70 to 0.85 for the posttest, representing adequate to good internal consistency (George and Mallery, 2001). During the posttest of this measure, we also collected survey data on whether or not students planned on pursuing science-related careers (yes, no, or undecided), gender, race, and the number of undergraduate science courses they had completed before the current semester.
Student interaction at the whole-class level in each laboratory section was assessed through the CCOP (see Appendix 3 in the Supplemental Material for the instrument and Supplemental Table 2 for psychometric properties). We developed this observational protocol to be a class-level assessment that TAs could use to rate the nature of student collaborative interactions each week in their classroom. While the instrument targets cooperative interaction in general, we were cognizant that, just because students display a positive disposition toward working with others (i.e., prosocial; see Premo et al., 2017, 2018), this does not necessarily mean that any student’s talk characteristics are linked to learning. For example, discussion of presented ideas (Barron, 2003; Sampson and Clark, 2011), elaborating on the ideas produced by other individuals (van Boxtel et al., 2000; Stark et al., 2002; Barron, 2003; van Blankenstein et al., 2013), and both providing and enforcing evidence/justification for one’s ideas (Chiu, 2008; Asterhan and Schwarz, 2009; Sampson and Clark, 2011) have all been linked to learning during social interaction. Indicators of prosocial tendencies like sharing, helping, and caring about peers (Caprara et al., 2000; Luengo Kanacri et al., 2017), as well as a general preference toward social interaction (Premo et al., 2018), have the potential to exist independently from specific talk characteristics. Thus, we divided the CCOP into two subscales—student prosocial behavior and discussion practices—to address both of these dimensions of cooperative interactions.
The CCOP was independently completed each week by both the graduate TAs (the individuals who taught the section) and undergraduate TAs for each lab section. One laboratory section in the intervention group did not complete at least one protocol for the majority of the eight class periods and therefore could not be included in the final analysis of class-level behavior; this resulted in 10 comparison and 10 intervention classrooms in analyses using the CCOP. The average number of observations collected was 13.9 in each comparison classroom and 14.3 in each intervention classroom over the 8 weeks. Internal consistency for each of the subscales of the observation were adequate for research purposes (prosocial behavior α = 0.70; discussion practices α = 0.74). See the Psychometric Properties of Instruments section below for more details on structural validity. It is important to note that these observational forms were completed by TAs during phase 1 of the intervention modules (when students were interacting in a small group to answer a single question) and not during phase 2 (structured interdependency), so the classroom context was as similar to that of the comparison condition as possible.
For assessment of students’ assimilation of the core knowledge and laboratory skills in SEA-PHAGES, six quizzes were given during the module. Each quiz contained questions whose answers were related to the information developed during the prior week’s collaborative-learning exercise (see Appendix 4 in the Supplemental Material for quizzes and Supplemental Table 3 for psychometric properties). TAs graded the quizzes on a zero- to two-point scale using guidelines provided by the course instructor. Before quiz scores were analyzed, they were examined for predictive validity. The quizzes were structured to measure student understanding of science content knowledge. If scores were representative of this knowledge, then they should be related to student scores in the course overall (as this was a subsampled knowledge set). Thus, graders whose quiz scores did not correlate to students’ overall course performance suggested that factors other than student ability primarily determined the quiz scores in that laboratory section. Correlational results showed that student overall course performance was able to predict quiz score for eight out of the 10 graders. For the eight TA graders whose scores demonstrated predictive validity, there was significant variance in this relationship (variance predicted [R2] ranged from 13 to 43%). For the two raters whose scores did not indicate predictive validity, there was no predictive ability, and thus these quiz scores were not used for assessing the impacts of the intervention on student achievement. We also used confirmatory factor analysis (CFA) to examine the extent to which all six of these quizzes were measuring a common underlying construct (i.e., student knowledge of the theory and practices of the SEA-PHAGES project). Results showed that scores from only five of the six quizzes demonstrated an underlying covariance structure (i.e., they were evaluating the same construct) and were therefore maintained for analysis (Supplemental Table 3). Table 2 provides an overview of each research question and the specific instruments and/or data sources used to examine results.
| Research question | Subquestions | Data sources useda |
|---|---|---|
| Research question 1: Does cooperative learning (structured to encourage interdependency) impact student academic achievement? |
|
|
| Research question 2: Does integrating cooperative learning shift student dispositions toward collaboration or collaborative engagement? |
|
|
| Research question 3: What factors shape whole-class collaborative engagement (prosocial behavior and discussion practices) throughout a semester? |
|
|
Psychometric Properties of Instruments
While scale reliability (Cronbach’s α) is commonly used to assess scale quality in the social and behavioral sciences, it often misestimates actual reliability of multi-item scales (Brown, 2015). Therefore, we went beyond examining reliability and assessed the quality of the measurement models of instruments using definitive anchors (CCEM, CCOP, and weekly quizzes) via CFA. CFA is a form of structural equation modeling used to verify the latent dimensions of an instrument, and it provides evidence of structural validity and how these dimensions relate to the items seeking to measure them (Brown, 2015). Evaluation of the quality of a CFA measurement model is typically conducted by using fit indices that provide information about the amount of variance accounted for by the hypothesized measurement structure. Chi-squared values are reported with the recognition that, while a nonsignificant chi-squared value is ultimately desirable, in practice nonsignificance is rarely attained (for reasons like inflation based on sample size; Brown, 2015). We used three common fit indices (RMSEA, CFI, and SRMR) and chi-squared values to assess the quality of each measurement model. The root mean-square error of approximation (RMSEA) was chosen as an absolute fit index with lower values indicating better fit of the proposed model to the data. An RMSEA < 0.06 was considered as a threshold value indicating a good fit for the model (Hu and Bentler, 1999), with values up to 0.08 being considered acceptable (MacCallum et al., 1996). The comparative fit index (CFI) compares the specified model with the null model and is relatively insensitive to sample size (Byrne, 1998; Hooper et al., 2008). A CFI of 0.90 indicates adequate model fit (van de Schoot et al., 2012), with 0.95 indicating good model fit (Hu and Bentler, 1999). The last fit index to be reported is the standardized root mean-square residual (SRMR). SRMR values range between 0 and 1, with lower values indicating better fit. Values for the SRMR below 0.05 indicate good model fit (Diamantopoulos and Siguaw, 2000), and values up to 0.08 are considered acceptable (Hu and Bentler, 1999). All models were run using a robust maximum-likelihood estimator to correct for variations in normality. All of the models were of at least adequate quality in all fit indices and demonstrated good fit in at least one fit index (see Table 3). This provided substantial support for their use in the current study.
| Index | CCEM (pretest) | CCEM (posttest) | CCOP (PB) | CCOP (DP) | CCOP (combined) | Weekly quizzes |
|---|---|---|---|---|---|---|
| χ2 | 766.40* | 853.04* | 10.65 | 3.97 | 59.02* | 17.52* |
| df | 467 | 467 | 5 | 2 | 26 | 9 |
| RMSEA | 0.04 (0.036–0.047) | 0.05 (0.042–0.051) | 0.06 (0.000–0.115) | 0.06 (0.000–0.153) | 0.07 (0.044–0.089) | 0.049 (0.010–0.084) |
| CFI | 0.92 | 0.90 | 0.97 | 0.99 | 0.93 | 0.91 |
| SRMR | 0.06 | 0.07 | 0.03 | 0.02 | 0.05 | 0.04 |
Addressing the Nested Nature of the Study
Because all measures were collected from multiple classrooms, a nested data structure that could have important implications for study results was generated. Multilevel modeling (MLM) approaches can be used to address nested data, but there are several criteria that collected data must meet for an MLM approach to be appropriate: 1) the data must be collected at the individual level, but be nested into larger groups; 2) sample size at level 2 (classroom) must be sufficiently large; and 3) a significant amount of the variance (normally between 10 and 20%) for a given measure must be able to be accounted for by between-group differences (Hox, 2010). Unfortunately, because much of our data did not meet these criteria, an MLM approach was inappropriate. Specifically, the data were either collected at the whole-classroom level (i.e., the CCOP observations) or were not collected using a large enough sample size (the interaction between power and sample size at multiple levels is very complex [see Hox, 2010], with simulations commonly not conducted below 30 groups/classrooms [i.e., Maas and Hox, 2005], making data from individual coding inappropriate). Also, the between-class variance for student-reported perceptions and dispositions was relatively minor, making an MLM approach minimally meaningful (e.g., the CCEM test values for which the highest amount of between-group variance was only 5.9%).
The weekly quiz scores represented the data set closest to being appropriate for an MLM (we have ∼0.65 power, assuming a medium effect size according to Scherbaum and Ferreter, 2009). Given that quiz data included both individual and group levels (∼19 groups of 24) and 18.3% of the variance was in between classrooms, we did use a multilevel approach to address this analysis. We specifically identified between-classroom variance by using an intercept-only mixed-effects model with classroom as a random effect and student-level quiz performance being the outcome, as suggested by Hox (2010). This allowed the partitioning of variance as either class level or student level (see Supplemental Table 6 for the modeling process and results). Once this was established, each student-level variable (TA, course percentage grade, and science interest) was individually entered as a fixed effect into the model and retained if it was a significant predictor of quiz performance and reduced between-classroom variance (fit statistics also were examined). Intervention participation was entered into the model once the majority of between-classroom variance was accounted for statistically.
Missing Data and Data Normality
Missing data from the CCOP (see Appendix 3 in the Supplemental Material) were examined before analysis. Little’s missing completely at random (MCAR) determines the extent to which data are missing completely at random (Kline, 2011). Results from Little’s MCAR test results showed that the data were missing completely at random (χ2 (46, n = 360) = 52.42, p = 0.24), indicating that there was no systematic bias in the noncompletion of the CCOP. Following this result, multiple imputation was used to account for CCOP missing data. While several researchers have argued that a small number of imputations (three to five) are enough to generate stable results in most cases (Schafer and Olsen, 1998), more recent work has suggested up to 100 imputations are needed to prevent power falloff using the technique (Graham et al., 2007). Therefore, we created 100 imputed data sets, and the results presented in this study are from their pooled results. Note that the missing quiz score data were systematic and thus could not be imputed. All collected data were first examined for normality using a Shapiro-Wilk W-test. Our results revealed that the data distributions showed only minor deviations from a normal distribution, making parametric analysis appropriate. All analysis was completed using JMP PRO 12.2.0 and SPSS version 22.
Coding of Individual Students’ Behavioral Engagement
Owing to the large sample of students participating in the study, only a subsample (one class per condition at three time points) was recorded. These recordings were analyzed for an in-depth examination of student collaborative behavior using the behavioral engagement in groups (BEG) coding scheme (Premo and Cavagnetto, 2018). Seventy-two students were audio and video recorded while they completed the question sets (36 per condition, 12 at each time point). The audio files from students completing the questions sets for three tables (four students each) for two classes (one intervention and one comparison) over three class sessions (weeks 1, 4, and 8 of the study) were transcribed. A lack of statistical difference between subsampled sections and the larger participant pool (i.e., condition) was established by examining both students’ overall course laboratory performance and their CCEM subscale measures (see Supplemental Table 1) between subsampled classrooms in comparison with all laboratory classes of the same condition. Results showed that the classrooms chosen to be video recorded did not vary significantly in students’ course performance from the larger participant pool. There was also no statistically reliable difference for initial CCEM subscales between the video-recorded classrooms and all classrooms of the same condition, except that friendship was significantly lower in the comparison video-recorded sample than the comparison population as a whole (R2 = 0.03, minor effect). There was no significant difference between the two video-recorded classrooms in terms of either academic performance or CCEM pretest measures.
The BEG coding scheme (Table 4; Premo and Cavagnetto, 2018) codes the behavior of every visible student every 10 seconds based on his or her relative engagement during group work. Engagement-related behaviors varied from those representing explicit engagement with the task (discussing science content, student voicing of misunderstanding, supportive interactions) and engagement at a smaller-unit level (pair talk regarding the task) to behaviors that lacked evidence for robust engagement (passively looking at the board or listening to peers) and behaviors that signified student disengagement with the task (working by themselves on another task [e.g., text messaging] or being socially distracted by or with another student).
| Category | Behavior | Examples |
|---|---|---|
| Engaged |
|
|
|
| |
|
| |
|
| |
| No audible component; determined by visual examination of video recording | |
| Neutral |
| No audible component; determined by visual examination of video recording |
| Disengaged |
|
|
|
|
Codes were assigned based on the highest level of engagement during the 10-second interval. This resulted in 2654 coded intervals of individual student behavior (mstudent = 110.5). The analysis was restricted to when groups/pairs were actively working on the question sets (first to last instance of science discussion). For confirmation of reliable application of the BEG, all intervals were independently coded by two research assistants, and then their agreed-on codes were compared with that of J.P. (who also independently coded each interval). There was strong agreement between the research assistants (Cohen’s kappa = 0.84) and strong agreement between the agreed codes from the research assistants and the author (Cohen’s kappa = 0.85). This demonstrated reliable application of the coding scheme, supporting use of the data for further analyses. All disagreements were resolved through discussions during generation of the final data set.
Regression Model Selection
We used multiple regression to examine the factors shaping collaborative engagement throughout the semester. We were interested in investigating the impact of multiple sets of classroom-level factors (class-level CCEM subscales [Appendix 2 in the Supplemental Material], class-level change in CCEM subscales, condition, classroom population characteristics, achievement, and the raters’ level [undergraduate or graduate TA]) on the late-intervention CCOP measures (Appendix 3 in the Supplemental Material). Regression allowed us to examine the relative impact of these factors simultaneously (Field, 2013). Recall that the CCOP consisted of two subscales: prosocial behavior and discussion practices. A separate model-selection process was completed for predicting these subscales.
Following the procedure of Jordt et al. (2017), we first generated a highly inclusive initial model for predicting late prosocial behavior and another for late-intervention discussion practices. The initial regression model for predicting late-intervention prosocial behavior was as follows:
Late-intervention prosocial behavior = rater level (grad) + initial prosocial behavior + course achievement + initial science-career motivation + percentage female + percentage interest in a science career + percentage with low science experience + initial reciprocity + initial friendships + initial willingness to help peers + initial reputational concern + initial perception of cooperative norms + initial relative investment in cooperation + intervention + change in reciprocity + change in friendships + change in willingness to help peers + change in reputational concern + change in perception of cooperative norms + change in relative investment in cooperation + (change in reciprocity × change in relative investment in cooperation)
Once this initial model was established, backward stepwise regression was used to remove factors from the model until we had the best-supported model based on Akaike information criterion (AIC) validation. AIC is a relative fit index. This means that AIC values only indicate goodness of fit when compared with other potential models, and lower values indicate a more optimal model (Burnham and Anderson, 2002). We adopted the model with the lowest AIC with the more parsimonious model (that with fewer predictors) being accepted if ΔAIC was 2 > |x| > 0. Factors were retained in the preferred model if it met this criterion, even if they were not significant predictors, as the AIC indicated that these were important for explaining the data (Burnham and Anderson, 2002). Each step in this model-selection process can be seen in Supplemental Table 4. This process was repeated to examine factors predicting late-intervention discussion practices, but without the interaction between change in reciprocity and change in relative investment in cooperation (this interaction was only hypothesized to be important for prosocial behavior). Results from this second model-selection process can be reviewed in Supplemental Table 5.
RESULTS
Research Question 1: Does Cooperative Learning (Structured to Encourage Interdependency) Impact Student Academic Achievement?
Question 1.1: Did Students in the Cooperative-Learning Condition Score Higher on Weekly Quizzes?
For assessment of the impact of the intervention on student achievement in the laboratory classrooms, each student completed six weekly quizzes designed to measure his or her understanding of both the processes and theoretical underpinning of the SEA-PHAGES project. Student scores were then averaged for the five quizzes that demonstrated common factor loading (see Supplemental Table 3). A significant proportion of the variance in student quiz scores was found between classrooms (18.3% of total variance), suggesting that classroom variance needed to be accounted for before we could draw conclusions about the impact of the intervention. Our multilevel model showed that 49% of between-class variance could be accounted for by the identity of the TA teaching in the classroom, and an additional 38% more was accounted for by the difference in student academic ability between classrooms. Interest in a science career accounted for 9.3% of between-class variance. In sum, we were able to account for the vast majority of between-classroom variance in quiz score interventions (see Supplemental Table 6 for detailed results). With this between-classroom variance statistically controlled for (i.e., variables were retained), we then entered condition into the model. With these controls in place, condition did not predict significant variance in quiz scores.
Question 1.2: Do Students’ Science Interest and Prior Science Classroom Experience Differentially Relate to Performance between Conditions?
Both comparison and intervention students had approximately the same number of prior completed science courses (both three to five on average), level of initial science-career motivation (p > 0.50), and course performance (p > 0.10) at the outset of the study. A more detailed analysis of the relationships between undergraduate science experience, science interest, gender, and quiz performance was next conducted. There was no significant relationship between science experience (number of completed courses) and quiz achievement for cooperative-learning students, but a significant negative relationship between the percentage of students with low science experience (two or fewer completed courses) and average quiz score (r = −0.34, p < 0.05, R2 = 0.11) in comparison classrooms. There was also a positive relationship in the comparison classrooms between the percentage of students with substantial undergraduate science experience (six or more completed courses) and average quiz score (r = 0.32, p < 0.05, R2 = 0.10) that was not seen in the intervention classrooms. Having a higher percentage of science career–oriented students in the overall laboratory environment was predictive of increased achievement in both learning environments, but it accounted for more variance within comparison condition classrooms (r = 0.40, p < 0.05, R2 = 0.15) than intervention classrooms (r = 0.18, p < 0.05, R2 = 0.03). This observation suggests that student achievement in the intervention condition is less impacted by student demographics (prior experience in science, technology, engineering, and mathematics [STEM]; active science interest) than is student achievement in the comparison classrooms. In other words, the collaborative environment may help to “level the playing field” for students with less STEM experience and/or interest.
Research Question 2: Does Integrating Cooperative Learning Shift Student Dispositions toward Collaboration or Collaborative Engagement?
Question 2.1: Are Student Dispositions toward Collaboration Altered by the Intervention?
To examine the extent by which student dispositions toward collaboration or perceptions of the classroom were impacted by the intervention, we first added individual pretest CCEM (Appendix 2 in the Supplemental Material) subscale scores into individual regression models predicting their posttest scores for the same subscale. This allowed us to statistically control for initial variance in student subscale scores. Next, we added condition into each model predicting posttest subscale scores. Results showed that condition did not significantly predict variance in student dispositions or perception of their classroom environment for any of the CCEM subscales (p > 0.20, see Figure 1). This suggests that student views of the classroom environment and their dispositions toward working with peers did not shift in response to the intervention.

FIGURE 1. Average change in student dispositions (“Willingness to Help,” “Reputational Concern”) and perceptions of the classroom environment (“Reciprocity,” “Friendship,” “Cooperative Norms,” and “Investment in Cooperation”) from the CCEM (Appendix 2 in the Supplemental Material) for both comparison and intervention students. Change was determined by an individual student’s posttest subscale mean minus his or her pretest subscale mean. Error bars represent standard error of the mean. Condition did not predict significant variance. p > 0.20, n= 483 students.
Question 2.2: Do Students in the Cooperative-Learning Condition (Intervention) Demonstrate Increased Collaboration at the Whole-Class Level?
Observation scores from the CCOP (Appendix 3 in the Supplemental Material) were examined for the first week of the intervention, and no initial differences between comparison and intervention conditions were found for either prosocial behavior (mcomparison= 3.68, SE = 0.17, minter= 3.66, SE = 0.12, t = −0.061, df = 30, p = 0.95) or discussion practices (mcomparison = 3.22, SE = 0.16, minter = 3.37, SE = 0.09, t= 0.75, df = 30, p = 0.46) when compared using unpaired t tests. Following this, study means for prosocial behavior and discussion practices were examined between conditions. Both prosocial behavior (mcomparison = 3.53, SE = 0.054, minter= 3.86, SE = 0.047, t = 4.522, df = 358, p < 0.05, d = 0.48) and discussion practices (mcomparison = 3.07, SE = 0.054, minter = 3.48, SE = 0.056, t = 5.296, df = 358, p < 0.05, d = 0.56) were significantly higher in the intervention condition than the comparison condition (see Figure 2). Prosocial behavior also had a minor, but significant interaction with time in the intervention condition (F(1, N = 179) = 10.3, p < 0.05, R2 = 0.05) but not in the comparison condition (F(1, N = 179) = 0.30, p = 0.59, R2 < 0.001; see Figure 3). There was no significant effect of time on discussion practices in either condition. This suggests that classrooms that experienced the intervention (designed to increase interdependency) displayed more prosocial behavior and discussion practices overall, as well as longitudinal growth in prosocial behavior over the course of the intervention.

FIGURE 2. Comparison of overall average CCOP (Appendix 3 in the Supplemental Material) subscale scores by condition. Error bars represent standard error of the mean. *, p< 0.05, n = 20 classrooms.

FIGURE 3. Comparison of longitudinal change in class-level prosocial behavior between cooperative-learning and comparison classrooms using the CCOP (Appendix 3 in the Supplemental Material). Note that a significant time effect was present in intervention classrooms only. n = 20 classrooms.
Question 2.3: Do Students in the Cooperative-Learning Condition (Intervention) Demonstrate Increased Collaboration at the Individual Level?
Recall that students in the comparison condition could work by themselves, with a partner, or as a larger group, while students in the intervention condition were encouraged to work with at least three other students before the whole-class discussion. We first examined whether or not the intervention shifted student collaboration toward group-level interaction (how they were seated in the class, tables of four students) using the BEG coding scheme (Table 4). However, it is possible that the level of collaboration would be different across phases 1 and 2, because the amount of task interdependency was designed to be higher in phase 2. Thus, we independently evaluated the behaviors of the comparison group members as compared with both phase 1 and phase 2 intervention students. Regression results showed that student presence in a comparison classroom predicted increased time not working with their table group (four members) compared with the intervention students during both phase 1 (p < 0.0001, R2 = 0.24) and phase 2 (p < 0.0001, R2 = 0.25).
Next, the students’ percentage of time engaged and disengaged was compared between conditions (also BEG; see Figure 4 for comparison and Table 4 for definitions of each code). Percentages were used to normalize the data, because instructors varied in the time they spent completing the question sets. Analysis was performed using unpaired t tests with Bonferroni corrections to account for inflated alpha values. The analysis showed that students in the intervention condition dedicated proportionally more time to discussing the answers and underlying concepts of the question sets with their laboratory groups (p < 0.0001, R2 = 0.24) and being socially supportive of their peers (p < 0.001, R2 = 0.14) than did students in the comparison condition. The intervention students also spent marginally more time passively listening to peer ideas (p < 0.05, R2 = 0.24) and marginally less time recording peer ideas (p < 0.05, R2 = 0.24) than comparison students (after using a Bonferroni correction for eight comparisons that set α = 0.006).

FIGURE 4. Student behaviors in the comparison and cooperative-learning conditions using the BEG coding scheme. Error bars represent standard error of the mean. Percentages were used to control for between-instructor variance in time dedicated to the modules. ***, p < 0.001; *, p < 0.05; n = 72 students.
Question 2.4: Is Collaboration Highest When the Cooperative-Learning Activity Has the Most Interdependency?
On the basis of interdependency theory, we hypothesized that greater student collaboration (BEG; Table 4) within the intervention condition should occur when interdependency is present (i.e., during phase 2 of the module; see Table 1). Results using unpaired t tests (with a Bonferroni correction) aligned with expectations of interdependency theory and showed that intervention students in phase 2 displayed significantly more time engaged with their group work overall (p < 0.01, R2 = 0.38) than in phase 1 (Figure 5). Specifically, students in phase 2 spent more time recording peer ideas (p < 0.001, R2 = 0.34) and marginally more time discussing science content with their table groups (p = 0.03, R2 = 0.08), passively listening (p = 0.04, R2 = 0.09), and voicing misunderstanding (p = 0.03, R2 = 0.09) after using a Bonferroni correction for seven comparisons that set α = 0.007. No difference was found in the amount of time spent socially supporting peers or being disengaged (p > 0.35). These results show that, within condition, students were more collaboratively engaged during the interdependence portion of the intervention.

FIGURE 5. Comparison of student behaviors in the intervention condition between phases 1 (normal group work) and 2 (interdependent group work) using the BEG. ***, p < 0.001; **, p < 0.01; *, p < 0.05; n = 36. students.
Research Question 3: What Factors Shape Whole-Class Collaborative Engagement (Prosocial Behavior and Discussion Practices) throughout a Semester?
Question 3.1: What Factors Predicted Late-Intervention Prosocial Behavior?
Recall that the initial regression model included initial student perceptions of the classroom environment, changes in student perceptions, classroom demographics, and intervention (among other factors; see Regression Model Selection section and see Supplemental Table 4 for model selection). The final model (Table 5) included initial prosocial behavior, course achievement, condition, changes in students’ perception of classroom reciprocity, and relative investment in classroom cooperation. These factors predicted 49% of all variance in late-intervention prosocial behavior (CCOP subscale; see Appendix 3 in the Supplemental Material). The significance of initial prosocial behavior as a predictor indicates that the level of a classroom’s prosocial behavior at the beginning of the intervention was an important determinant of a classroom’s late prosocial behavior (p < 0.01, R2 = 0.07). Classroom course achievement also positively predicted greater late-intervention prosocial behavior (p < 0.01) and accounted for ∼8% of variance in late-intervention prosocial behavior. Experiencing the intervention accounted for 8% of the variance in late-intervention prosocial behavior (p < 0.01). The remaining predicted variance (R2 = 0.26) in late-intervention prosocial behavior was determined by changes in student perceptions of their classroom social environment. Increases in classroom friendships was able to predict 3% of the remaining variance. The final predictive factors were change in student perception of reciprocity (i.e., the likelihood of a future return from those you are providing immediate support for during cooperation; Trivers, 1971), relative investment in classroom cooperation (i.e., the amount of resources/energy you believe you are dedicating to cooperation in comparison with your peers), and the interaction between these two factors. The interaction between reciprocity and investment was included in the initial model because of its tight alignment to the expectations of interdependency theory (Rusbult and Van Lange, 2003). Interdependency theory argues that individuals are more likely to invest time and resources into those around them when doing so is likely to encourage the attainment of one’s own goals. Thus, when students are investing heavily into classroom cooperation and perceive a strong return of this investment via reciprocity, it is expected that prosocial behavior would be strongly encouraged. Our results support this hypothesis by showing that the reciprocity/investment interaction accounted for a greater proportion of variance (p < 0.01, R2 = 0.17) than any other single predictive factor. This left the remaining 6% of variance to be accounted for by the changes in investment and reciprocity themselves.
| Factor | B (SE) | β | R2 |
|---|---|---|---|
| Intercept | −3.65 (1.40) | 3.81 | |
| Initial prosocial behavior** | 0.57 (0.21) | 0.30 | 0.07 |
| Course achievement** | 0.06 (0.02) | 0.33 | 0.08 |
| Intervention** | 0.16 (0.05) | 0.28 | 0.08 |
| Change in reciprocity** | 1.07 (0.38) | 0.24 | 0.02 |
| Change in friendships** | 0.57 (0.21) | 0.24 | 0.03 |
| Change in relative investment in cooperation | 0.16 (0.53) | 0.03 | 0.05 |
| Change in reciprocity × change in relative investment in cooperation** | 17.29 (4.30) | 0.38 | 0.17 |
To demonstrate the impact of the interaction between changes in reciprocity and changes in relative investment in classroom cooperation, we modeled nine hypothetical classrooms in Figure 6. In our collected data, we observed that changes in class perception of reciprocity ranged from a 0.16 decrease to a 0.14 increase (out of 5) and that changes in class investment in cooperation ranged from a 0.19 decrease to a 0.22 increase (also out of 5). To model hypothetical classrooms, we used a ±0.14 change in these perceptions because this was within the naturally occurring range in our study. Each hypothetical classroom represents one of nine potential combinations for change in perception of reciprocity (decrease, no change, increase) and relative investment in classroom cooperation (decrease, no change, increase). All hypothetical classrooms experienced the intervention, had an initial prosocial behavior score of 3.7 (study mean), a classroom average course performance of 81.88 (study mean), and did not experience a change in friendships during the semester.

FIGURE 6. Interaction between changes in student perception of classmate reciprocity and change in relative investment in classroom cooperation. Each bar represents a hypothetical classroom. All classrooms experienced the intervention, had an initial prosocial behavior score of 3.7 (mean of this study), and did not experience a change in friendships during the semester. Note that decrease = −0.014 and increase = +0.14 on corresponding CCEM subscales (Appendix 2 in the Supplemental Material) and was within the range of observed changes seen in study classrooms.
Question 3.2: What Factors Predicted Late-Intervention Discussion Practices?
The final regression model predicting late discussion practices accounted for less variance (37% of total) than that for prosocial behavior (see Table 6 for final model and Supplemental Table 5 for model selection). Unlike the model for prosocial behavior, initial discussion practices in a classroom did not predict significant variance in late-intervention discussion practices. Also, unlike the situation for prosocial behavior, the level of the rater using the CCOP (Appendix 3 in the Supplemental Material) had a significant effect on the scores (undergraduate raters systematically rated discussion practices higher than graduate raters, p < 0.01, R2 = 0.02). Similar to prosocial behavior, academic achievement of a classroom predicted significant variance in late discussion practices, but to a lesser extent overall (p < 0.05, R2 = 0.01). Initial student perceptions of the classroom environment were more important to discussion practices than prosocial behavior, with initial perceptions of reciprocity and friendship and initial student reputational concern accounting for 11% of late discussion practices (of these, initial perception of reciprocity contributed overwhelmingly to this amount; p < 0.01, R2 = 0.09). Experiencing the intervention predicted increased discussion practices (p < 0.01, R2 = 0.09), while change in student perception of the classroom environment accounted for the remaining 14% of predicted variance. Of the changes in student perception of the classroom environment (reciprocity, reputational concern, investment, and willingness to help), change in student concern with their reputation was the overwhelming contributor (p < 0.01, R2 = 0.07).
| Factor | B (SE) | β | R2 |
|---|---|---|---|
| Intercept | −8.12 (2.35) | 3.29 | |
| Rater level (grad)** | 0.14 (0.05) | 0.23 | 0.02 |
| Course achievement* | 0.05 (0.02) | 0.26 | 0.01 |
| Initial reciprocity** | 3.58 (0.80) | 0.57 | 0.09 |
| Initial friendship presence† | 0.44 (0.25) | 0.19 | 0.01 |
| Initial reputational concern** | −1.79 (0.57) | −0.46 | 0.01 |
| Intervention** | 0.17 (0.06) | 0.28 | 0.09 |
| Change in perceived reciprocity† | 1.02 (0.61) | 0.22 | 0.01 |
| Change in willingness to help peers** | 2.05 (0.56) | 0.45 | 0.03 |
| Change in reputational concern** | −1.77 (0.46) | −0.44 | 0.07 |
| Change in relative investment in cooperation* | −1.67 (0.66) | −0.29 | 0.04 |
When aggregated, these results suggest that several common factors contributed to both late prosocial behavior and discussion practices. These included course achievement, experiencing the intervention, reciprocity, friendship, and relative investment in classroom cooperation. The influence of the intervention on both prosocial behavior (R2 = 0.08) and discussion practices (R2 = 0.09) was similar, but the extent to which other factors influenced these measures varied. For example, student perception of classroom reciprocity at the start of the study was a key predictor of late discussion practices (R2 = 0.12), but changes in student perceptions of their classroom during the study, specifically the interaction of changes in reciprocity and investment (R2 = 0.17), was a key predictor of late prosocial behavior. Also, student concern with how their peers are viewing them (reputational concern) appeared to function differentially by predicting decreases in student engagement in discussion practices, but was not able to predict significant variance in prosocial behavior.
DISCUSSION
We integrated cooperative-learning modules into undergraduate biology laboratory classrooms to examine the specific impacts of structured interdependency (Jensen et al., 2002; Buchs et al., 2004, 2010; Brewer and Klein, 2006) on collaborative engagement and achievement during undergraduate science learning. We recognized that traditional cooperative-learning models include many factors beyond student cooperation (Johnson and Johnson, 1999) and tested only interdependency in the current study. Our results demonstrate that student performance was not increased by interdependency over our common practice comparison. This finding suggests that interdependency may not drive the learning gains reported from those using a cooperative-learning model. In contrast, we saw substantial shifts in both classroom collaborative engagement and individual-level engagement in classrooms experiencing the intervention, suggesting that interdependency can be used to increase peer cooperation in classrooms.
We also found that changes in student perceptions of their classroom environment were important predictors of classroom collaborative engagement in addition to the impacts of the collaborative modules. For example, interactions between student investment in peers and reciprocity from peers (i.e., a return of investment) was the strongest factor predicting late-intervention classroom prosocial behavior. This result aligns with work suggesting that students are disposed to collaborate in instances in which a return is most likely (Premo et al., 2017, 2018), but this has now been expanded to include whole-class prosocial dynamics. This finding (in addition to other regression results) aligns with interdisciplinary work highlighting the importance of perception of benefit (for reviews, see Rand and Nowak, 2013; Kurzban et al., 2015), reciprocity (Trivers, 1971; Patton, 2005; Jaeggi and Gurven, 2013), and friendship (Massen et al., 2010; Kurzban et al., 2015) in determining cooperative action. Thus, student perceptions of the ratio of relative cost:return related to cooperation in the classroom may be important for instructors to consider when designing collaborative-learning environments.
Our study has specific implications both for CURE classrooms and for understanding cooperative learning in undergraduate science education. CUREs offer undergraduate students exposure to more authentic processes of science than are typically available in traditional labs or lecture courses and have been linked to positive changes in student self-report measures ranging from science interest and self-efficacy to their sense of belonging to the science community (for a review, see Corwin et al., 2015, and for a more critical review, see Linn et al., 2015). Less is known about CURE impacts on student communication and collaborative practice. The closest attention to this area within CUREs are studies examining changes in student self-reported communication skills such as performance during oral presentations (Jordan et al., 2014), self-confidence when discussing science (Shaffer et al., 2014), and ability to work within a team (Shaffer et al., 2014). The current study provides some insight into the complexity of factors impacting collaborative practice in classrooms participating in a CURE. Not only were there significant shifts in collaborative engagement in response to the intervention, but also student perceptions of their classroom environment were important predictors of the positive nature of student interaction and students’ discussion practices. These results suggest that we cannot assume that just having students work with others during CUREs is enough to generate rich collaborative interactions. We suspect that this implication applies not only to CUREs, but also to other undergraduate education settings. Supportive structures should be integrated into courses to encourage more productive collaboration if we want students to have more authentic exposure to the collaborative aspects of science.
This study results also highlights the importance of using multiple measures to holistically address observable classroom phenomena (e.g., student behavior) with multivariate contributors. By measuring collaborative engagement via multiple dimensions (prosocial behavior and discussion practices) and at multiple levels (cognitive [self-report], individual observation, and classroom-level observation), we were able to better situate the bounds in which the intervention was functioning. The triangulation between different observational measures and student self-reports allowed us to determine the impact of our intervention (8–9% of variance in collaborative engagement) relative to a diversity of other factors (e.g., academic ability, science interest, changes in student perception of the classroom). If we had relied only on student self-reports to assess the intervention, no effect would have been found. We can also imagine the inverse occurring with students reporting changes in their abilities or practice in a classroom, with a lack of independent observational support for these changes (Panadero et al., 2016). Therefore, future research in this area, with its accompanying complex interactions, should leverage multiple sources of data (self-report and observation).
Several limitations of the current study must be noted. First, despite these multiple sources of observed difference (classroom and individual levels), students in the intervention condition did not shift significantly in any of their self-reported views of their classroom or dispositions toward cooperation. The inability of the intervention to systematically shift student perceptions suggests that greater changes in course structure may be needed to influence student perceptions. Second, while significant work was put into examining the reliability and structural validity of the observational measure used (CCOP; Appendix 3 in the Supplemental Material) and a significant number of class-level observations were collected (n = 282), the measure is newly developed and must be used in a wider variety of classroom environments in order to understand both its generalizability and linkages to other features found in undergraduate science classrooms. Third, the observational analysis of video and audio recordings only included two classrooms over three time points. While we provided evidence suggesting that the two classrooms were representative of the larger samples, more examinations of student interactions are needed to support any generalizations. Fourth, the current study focused on generating greater collaborative engagement among students. The study did not specifically address shifts in specific behaviors that are particularly important to scientific practice (use of evidence and logic, providing reasoned critiques, etc.). A fruitful next step in this line of research would be to address these more nuanced aspects of student talk relative to interdependent contexts. Fifth, the weekly quizzes used in the study were not validated before use and, while we presented evidence of structural and predictive validity, we have not formally evaluated either their content/face validity or difficulty level. Past work seeking to examine the impacts of cognitive load on group learning have indicated that cooperative approaches have more consistent and substantial effects when individuals cannot complete a task alone (Kirschner et al., 2009). Thus, the alignment between the task and evaluations (quizzes) needs to be increased and a better accounting for their difficulty performed during future studies.
In conclusion, structuring student learning to encourage interdependence resulted in increased collaborative engagement, but did not increase achievement. Future work should continue to address how course structures shape student collaborative interaction, and how these interactions contribute to both student achievement and their understanding science practices within undergraduate science courses. If we want undergraduate students to experience more authentic collaborative environments, and thus experience some of the most beneficial social aspects of scientific practice, we cannot assume students will do so in unsupportive settings. Class design must be purposeful and pay attention to establishing classroom environments that drive student collaborative engagement and interdependency in order to enhance student experience with collaboration as a social aspect of scientific practice.
ACKNOWLEDGMENTS
Funding for the current study was provided by Washington State University’s College of Veterinary Medicine Teaching Academy.