Demographics Matter: Non-white and White Life Science Graduate Students Perceive and Use Resources Differently
Abstract
Many studies and interventions have been conducted to combat differential academic outcomes between majority and minoritized student populations in science, technology, engineering, and mathematics (STEM) higher education; however, few studies have examined resource use as a factor impacting these differences. Resource use is critical to success in myriad fields, and we posit that understanding resource use in graduate education, including the use and perception of resources, may be important in understanding differential outcomes and success among STEM graduate students. We employed a national survey of life science graduate students (N = 534) to describe student resource use outcomes and how these outcomes may be related to student demographic characteristics. The survey collected data on the following resource use outcomes: what resources students use, how often they use them, and how useful they perceive them to be. Academic stipend was the most frequently used resource and was perceived to be the most useful resource. Analysis of variance modeling and Tukey post hoc tests indicated that year in program, racial identity, gender identity, and college generation status all impacted student frequency of use or perception of usefulness for some resources, with the greatest differentials between white and non-white students. We conclude with recommendations for policy, practice, and future research.
INTRODUCTION
Leaders in the fields of science, technology, engineering, and mathematics (STEM) have been advocating for an increase in the racial, ethnic, and gender diversity of individuals holding STEM degrees for more than 30 years (U.S. Congress, 1991). Calls for increasing this diversity have been made at every level within higher education—from departments, to universities, to national organizations and agencies (National Science Foundation [NSF], 2019). A well-known analogy within STEM fields is that of the “leaky pipeline,” wherein there is a progressive loss from K–12 to higher education of individuals acquiring STEM degrees (Witteveen and Attewell, 2020). These pipeline losses are often members of minoritized populations, including women and people of color (Kokkelenberg and Sinha, 2010). The loss of talented individuals from STEM fields is both progressive—in that more individuals leave the field as one progresses from K–12 to postgraduate careers—and persistent—in that this problem has been discussed since the late 20th century but little has changed in terms of outcomes (Pell, 1996; Chesler et al., 2010; Liu et al., 2019).
A critical diversity “leak point” in this pipeline occurs at the stage of graduate education. For example, according to the NSF (2017), women of color represented 23.89% of the U.S. STEM graduate student population in 2014; however, during this same time period, women of color represented only 11.96% of the U.S. STEM PhD recipients. Loss of women and students of color from the beginning to the end of the PhD program reduces future scientific capacity for national innovators (Sowel et al., 2010) who improve economic, organizational, and national outcomes (NSF, 2017, 2019). While the leaky pipeline analogy has been criticized in recent years (e.g., Cannady et al., 2014), it is still an important reminder of an extant issue in STEM—the differential attrition of students who are key to a strong scientific future.
Research on the potential drivers of differentials in degree acquisition and persistence between majority and minoritized students in STEM has focused on systemic barriers and biases, which can contribute to a lack of student sense of belonging and feelings of isolation among students less represented in the field. Liu et al. (2019) detailed several types of barriers to the persistence of women of color within STEM, including implicit bias within academia, barriers to selection and advancement, and the social isolation experienced by many minoritized students. To address these barriers for minoritized students broadly, intervention strategies like mentorship programs (Dawson et al., 2015), social support networks (Schuyler et al., 2021), targeted hiring (Sensoy and DiAngelo, 2017), and implicit bias trainings (Jackson et al., 2014) have been well established and empirically tested within the literature, with mixed outcomes. However, one conspicuously understudied factor that could differentially impact student experiences within graduate education is students’ use of resources.
Students seeking a graduate degree likely use myriad resources every day, but very little of this everyday process has been systematically studied within graduate student populations. The use of resources underlies many key aspects of the graduate student experience, including making connections with a dissertation committee, finding appropriate methodological resources, and even having enough institutional support and funding to continue being a graduate student. Indeed, it is hard to imagine steps of a typical graduate program that do not require resources, suggesting that any barriers to accessing or using resources may be an unexplored factor in degree attainment.
As an example of how a resource may relate to differential outcomes, theories of social capital suggest that first-generation students may be less aware of the academic resources that are available to them, or they may experience barriers to using certain resources (e.g., networking with faculty members; Gardner and Holley, 2011; Ellis et al., 2019). This differential resource use compared with continuing-generation students may have cascading effects on academic outcomes (i.e., academic success, degree completion, persistence) and thus may present as differential outcomes between first- and continuing-generation students within STEM programs.
Given the potential importance of resources to graduate student success, and their potential to be related to differential degree outcomes, we implemented a survey to explore the use and perception of resources among life science graduate students. As part of our analyses, we investigated whether the use or perception of resources differed among different demographic groups in order to provide the empirical foundations for future studies of student resource use and student persistence. In the following sections, we will briefly review research that supports the importance of resources as factors related to higher education student outcomes and outline the study’s theoretical and methodological frameworks.
Resources and Resource Use in Higher Education
The term “resource” generally refers to an item, person, or place that facilitates an outcome. Oftentimes access to or use of certain resources is crucial to facilitate a desirable outcome, which is why resource use and access has been studied across many fields. These have included studies in economics, where differential resource use is a key factor in neoclassical economic theory (Goodland and Ledec, 1987); anthropology, where resource use has been a key factor in the cultural evolution of human civilizations (i.e., the theory of historical particularism; Bock, 1996); and ecology, where the totality of resources available in an environment (i.e., the resource landscape) is catalogued to understand which species may persist and which will not (niche theory; Hutchinson, 1961). Across many disparate domains of study, understanding fundamental aspects of resource use (e.g., how resources are dispersed in an environment, why individuals choose to use resources, which resources are favored over others) has laid the groundwork for theories that describe more complex interactions. Similarly, we posit that understanding the fundamentals of resource use within graduate education may inform future investigations into differential student outcomes within higher education.
Although resource use has been studied within the education literature for decades, graduate student resource use is not a common focus. As with many other topics within higher education, the majority of published literature concerns populations of undergraduate students. Students’ resource use has been studied as a dependent variable, that is, as an outcome of student characteristics or past experiences (K–12 students: Makara and Karabenick, 2013); as an independent variable used to predict student academic outcomes or persistence within a course (undergraduates: Soria et al., 2013; Stites et al., 2019); and as a descriptive variable, used by researchers to explain how students in a particular field or class access and use the resources available to them (undergraduates: Tenopir, 2003; Melvin, 2021; graduate students: Furlano et al., 2021). We provide here a brief summary of research on resource use in higher education, organized by studies of single-resource use and student use of multiple resources.
Studies that examine students’ resource use most often frame their research in terms of a single resource, such as student–mentor relationships (undergraduates: Woods and Preciado, 2016; graduate students: Tenenbaum et al., 2001), graduate students’ use of writing communities (Cahill et al., 2008), or the use of undergraduate tutoring centers (Pelleg et al., 2016). Students’ use and perception of a single resource is often studied as an independent variable, with student outcomes as a dependent variable (e.g., academic success, persistence, identity formation). For example, Hypolite (2022) investigated the impact of a Black cultural center on the experiences of Black graduate students at a historically white institution. That study revealed that the use of this resource had a number of benefits for Black graduate students, including access to more resources and providing a space for community and support, and highlighted that relatively simple interventions, like the promotion of a single resource, can help address disparate outcomes among graduate students (Hypolite, 2022). However, considering the large number of resources students could use and the even larger number of factors that mediate students’ use and perception of resources, studies of single resources are inevitably limited (Makara and Karabenick, 2013). Thus, studies that examine students’ use of multiple resources are needed to more fully describe students’ resource use.
Several researchers have examined undergraduate student use of multiple resources or categories of resources (i.e., related groups of resources, like those supporting mental health or all the resources provided in a single class). Studies that examine resource use by category often aim to understand the efficacy of certain programs or factors that drive students to use resources (e.g., undergraduates: Tenopir, 2003; Melvin, 2021). For example, Stites et al. (2019) measured undergraduate students’ use of nine class-provided resources in an introductory engineering class and found nine unique clusters of student resource use patterns; these patterns were mediated by students’ frequency of use of each of the class resources. A follow-up study from Stites and colleagues (2021) revealed that two of these resource use patterns were significantly predictive of students’ content knowledge and course grade. These two studies suggest that students’ use of multiple resources may be predictors of student outcomes and thus may be integral to understanding present disparate student outcomes within higher education. However, this work focused on populations of undergraduate students. We are mindful that undergraduate and graduate student populations can be quite different from each other (e.g., expectations of independence, diversity in previous experiences and outside commitments; Lovitts, 2002) and therefore it may be difficult to apply these findings to a graduate student context with confidence.
Thus, the current literature related to students’ resource use exhibits two important gaps: 1) few studies have focused on populations of graduate students, whose context likely makes them different from undergraduate students in terms of resource use; and 2) studies investigating graduate students have focused on their use of single resources (e.g., advisors, cultural centers) versus investigating the broad landscape of potential resources used by these students. Therefore, we believe that a more comprehensive examination of graduate students’ resource use is warranted. Previous research has shown that students’ resource choices are motivated by their expectations and values of the resource (e.g., K–12 students: Eccles and Wigfield, 2002; undergraduates: Wirtz et al., 2018; graduates: Bloom et al., 2007), and that student experience and identity can also influence resource use (Makara and Karabenick, 2013; O’Shea and Delahunty, 2018; Stites et al., 2019). Thus, to guide this study, we chose to use Eccles and Wigfield’s (2002) expectancy-value theory and its subsidiary theory, expectancy-value theory for help sources (EVTHS; Makara and Karabenick, 2013), as this study’s theoretical and methodological frameworks.
EVT
This study used Eccles and Wigfield’s EVT (Wigfield and Eccles, 2000; Eccles and Wigfield, 2002) as the theoretical framework driving the study’s research objectives and methods and informing the discussion of findings (Luft et al., 2022). EVT posits that the learners’ contexts and their individual characteristics impact their perceptions and interpretations (of events, themselves, or others), which in turn impact their expectations, values, and ultimately the outcome variable of students’ achievement-related choices (i.e., resource use). Figure 1 shows a reduced version of the EVT framework with only the variables used in this study. Variables within EVT can be broken down into two categories: proximal and distal variables. Proximal variables include people’s expectations for success and task-related values, while distal variables include individuals’ cultural milieu, previous experiences, and their goals.

FIGURE 1. Adapted diagram of Eccles and Wigfield’s EVT. Boxes indicate variables that influence individuals’ choices; arrows indicate direction of influence.
EVT has broad empirical support within education literature; demographic factors like gender (Watt et al., 2012) and age (Jacobs et al., 2002) as well as the external factor of culture (Pomerantz and Wang, 2009) have all been shown to impact students’ expectancy beliefs and subjective task values. This is relevant to our study, because EVT predicts that student identities would have a cascading effect on their values and expectations and thus their achievement-related choices (including resource use outcomes). As such, we hypothesized that variables such as students’ racial identity, gender, and college generation status represent aspects of their cultural milieu and thus may all impact student resource use outcomes. Similarly, students’ years in their programs represent an aspect of their previous achievement-related experiences and thus may similarly impact their resource use outcomes. These hypotheses are supported by previous literature (e.g., Benenson and Koulnazarian, 2008; Ryan et al., 2010). For example, Makara and Karabenick (2013) found that students’ resource use was significantly impacted by their gender identity, with women more willing to seek help from “social” resources (e.g., peers and teachers) compared with men. Furthermore, previous work on academic socialization found that, as graduate students advance in their programs, their needs change (e.g., need to secure a sense of belonging vs. a need to secure intellectual mastery; Golde, 1998; Austin, 2002); thus, we hypothesize that, as students’ needs change, so too will the resources they use.
EVT defines expectations as individuals’ belief that they can accomplish a task (efficacy expectations) and that a given action will lead to a certain outcome (outcome expectations). Furthermore, the concept of “values” within the EVT model comprises many components: attainment value, intrinsic value, utility value, and cost. Expectations and values directly influence students’ choices and outcomes, which are broadly defined within the theory to encompass academic achievement and academic-related choices (Wigfield and Eccles, 2000). Many studies have shown support for relationships among expectations, values, and outcomes, including studies of how students’ values impact academic achievement (Eccles et al., 1983), how expectations of hiring impact job-seeking behavior (Feather, 1992), and how expectations of anxiety impact coping strategies (Pekrun, 1992). As shown by these examples, EVT’s concept of “expectations” and “values” can be broad; thus, we drew on a derivative theory, EVTHS, to serve as our methodological framework to more precisely define our dependent variables for our data collection (Makara and Karabenick, 2013).
EVTHS
Makara and Karabenick’s (2013) EVTHS was created to understand how types of help sources (e.g., resources like peers, instructors, institutional resources, and nontraditional sources) impact undergraduates’ resource use outcomes (i.e., their probability of seeking and using help). While EVT is more useful as a theoretical framework guiding interpretation and implications of our results, EVTHS is far more specific regarding this study’s dependent variables—students’ resource use outcomes and resource perception. Thus, we used EVTHS as this study’s methodological framework. EVTHS includes only three variables, “expectations,” “values,” and “help-seeking outcomes.”
Within its conception of expectations, EVTHS includes students’ perceptions of the accessibility or availability of the resource, and the perception that the resource will provide help. These expectations are highly predictive of who or what students turn to for help. For example, Evenhouse et al. (2020) found that undergraduate engineering students preferred resources that were immediately available, such as online discussion posts, search engines, or class notes. Furthermore, choices between immediately available resources were moderated by students’ perceptions of resource relevance; for example, engineering students were inclined to choose search engines to answer problems if discussion posts or class notes did not cover the homework topics (Evenhouse et al., 2020). Thus, when choosing between a wide variety of resources to solve a problem, the choice among these resources is affected, in part, by students’ expectations about availability and relevance.
The construct of values within EVTHS is composed of students’ perceptions of the quality or accuracy of the source along with their perceptions of the alignment in type of help desired and type of help given by a particular resource. In the classroom, value can be conceptualized as how well a resource will meet the needs of the student. For example, undergraduate students who wish to learn a concept (i.e., instrumental help-seeking need) are more likely to ask professors for help as opposed to peers, presumably because professors are likely to provide learning strategies, while peers may simply provide answers; Karabenick, 2003). In the context of graduate school, students’ perceptions of resource value and resource quality have broad impacts, from the courses that students choose (e.g., “Do I want an ‘easy’ course, so I can focus on my research, or do I want a course that will allow me to gain skills for a future career?”) to their committee composition (e.g., “Will the advice this faculty member gives me be high quality? Will it be accurate?”).
Study Rationale
While student resource use may provide key insights into students’ academic outcomes, to the best of our knowledge, there is no literature that comprehensively examines how often graduate students use resources within their programs and how useful they find them, and whether resource use is related to graduate student characteristics. Studying the landscape of resource use in graduate school and identifying whether there is evidence of differential resource use among students is a necessary first step to understanding whether resources might differentially impact degree attainment across demographic groups. Thus, using EVT and EVTHS as our theoretical and methodological frameworks, the objectives of this study were to:
evaluate life science graduate student resource use outcomes (i.e., overall number of resources used, frequency of use for each resource, and perceptions of usefulness for each resource); and
investigate whether graduate student characteristics are related to students’ resource use outcomes (i.e., number of resources used, frequency of resource use, and perception of resource usefulness).
Empirical data related to these research objectives can inform university leaders, advisors, and graduate students and will provide evidence for future work on the impacts of resources and differential resource use on graduate students’ persistence and academic success.
METHODS
We implemented a survey of life science graduate students within the United States. The decision to restrict participation to just life science graduate students was made because this is the context that the researchers were most familiar with; M.W. is currently a life science graduate student, and E.E.S. is a professor within a life science department. Familiarity with the context of the study participants is important, as it facilitates data interpretation. Before the study began, its design, recruitment, and data analysis methods were approved by the University of Tennessee, Knoxville, Institutional Review Board (IRB no. 20-05870-XP).
Survey Development and Pilot Testing
The survey consisted of 16 questions related to the following topics: students’ resource use, students’ perceptions of resources, and student demographics (Table 1). All sections of the survey, aside from student demographics, were adapted from previous surveys or were created by the authors. The first survey question, which asked students to select all the resources they used in their programs, was created by the authors. Questions about students’ frequency of use and perception of the usefulness of individual resources were adapted from Wirtz et al. (2018), with additional support from survey items used in populations of undergraduate students (e.g., Howley, 2018; Stites et al., 2019). Demographic questions were adapted from Fernandez and colleagues (2016) or from the U.S. Census. All of items were compiled and evaluated by a team of education researchers experienced at developing surveys and studying graduate students (Schussler et al., 2015; Weatherton and Schussler, 2021).
| Survey question | Variable(s) gathered | Question source |
|---|---|---|
| Which of the following resources have you used within your graduate program? These may be resources that you use to collect or analyze data, publish your work, maintain your mental health, sustain a work-life balance, etc. Choose ALL that apply. | Number of resources used | Created by authors Adapted from Mallin et al., 2014 |
| Compiled resources used by student | ||
| Of the resources that you selected in the previous question, please indicate how often you use each resource within your graduate program. | Frequency of use (1–5) for each resource used by student | Adapted from Wirtz et al., 2018; Stites et al., 2019 |
| Of the resources that you selected in the previous question, please indicate how useful you have found each resource within your graduate program. | Perception of usefulness (1–5) for each resource used by student | Adapted from Howley, 2018; Wirtz et al., 2018 |
| Please list the institution that you are currently attending. | Institution type (R1/R2/other) | Adapted from Fernandez et al., 2016 |
| What “year” are you in graduate school? (Example: If you arrived this Fall, then you would be “Year 1.”) | Year in program | Adapted from Fernandez et al., 2016 |
| Are you the first person in your family to go to graduate school? | College generation status | Adapted from Fernandez et al., 2016 |
| How would you describe your gender identity? | Gender identity | Adapted from Fernandez et al., 2016 |
| With which racial/ethnic group(s) do you identify? Choose all that apply | Racial identity | Adapted from U.S. Census Bureau, 2020 |
After developing the survey questions, the authors conducted two rounds of pilot testing from October 2020 through March 2021. The goal of pilot testing is to ensure that survey questions measure the intended construct while minimizing the effect of linguistic, cultural, or individual-level characteristics irrelevant to the study (American Educational Research Association [AERA], 2014). The first round of pilot testing was used to establish a list of resources that graduate students used in their programs, as there was no extant list of these resources available at the time of the study. Thus, life science graduate students from one research-intensive institution (N = 15) were asked to list all the resources that they used in their graduate program. This list was supplemented by resources found in the graduate education literature base and review by five faculty members. This process resulted in a list of 34 resources that graduate students might use in their programs.
The second round of pilot testing (N = 18) asked life science graduate students from multiple universities within the United States to take the full survey and provide feedback about how they interpreted survey questions, any issues they had with the survey, and any resources that they thought were missing from the survey. Goals of this round of pilot testing included establishing the reliability of survey questions (i.e., to ensure the consistency of interpretation across participants; AERA, 2014; Taherdoost, 2016), further evaluating the validity of survey questions, and evaluating the validity of the list of resources. The survey and resource list were edited based on participant feedback, after which the full survey was examined by education researchers across multiple domains who evaluated the survey’s face and content validity.
Survey Design
Before beginning the survey, participants were presented with IRB-approved consent information and were asked to consent to being a part of the research project. If participants did not consent, they were taken to the end of the survey.
Participants were first asked to choose which resources they used in their graduate programs from a provided list of 34 resources. From the list of 34 resources, participants could choose as many resources as they desired to indicate the suite of resources they used in their graduate programs. These selections were carried through to the next two questions, which asked participants how often they used each resource (resource use frequency) and how useful they thought each of the resources were (perception of resource’s usefulness).
The choice to collect these variables was informed by our methodological framework, EVTHS. The resource use frequency variable was modeled after the EVTHS outcome variable “help-seeking outcomes.” The perception of resource usefulness variable was modeled after two variables from EVTHS: the expectation of “source will provide help” and the value of “perceived quality/accuracy of the source.”
To indicate resource use frequency, participants were asked: “Of the resources that you selected in the previous question, please indicate how often you use each resource within your graduate program.” This question was adapted from previous work using EVTHS with undergraduate students (Wirtz et al., 2018; Stites et al., 2019). Responses were set on anchored scales between 1 and 5, where 1 indicated “infrequently” and 5 indicated “frequently.”
Similarly, to measure perceptions of resource usefulness, participants were asked, “Of the resources that you selected in the previous question, please indicate how useful you have found each resource within your graduate program.” This question was adapted from previous work using EVTHS with undergraduate students (Howley, 2018; Wirtz et al., 2018). Responses were set on anchored scales between 1 and 5, where 1 was “not very useful” and 5 was “very useful.”
We collected the following demographic information: current institution, year in program, first-generation status, gender identity, and racial/ethnic identity. Importantly, throughout the article, we refer to first-generation status as defined by students themselves, which may include students who were the first in their families to attend college (i.e., undergraduate institutions) and students who were the first in their families to attend graduate school. Our choice to collect these variables was driven by our theoretical framework, EVT, which broadly posits that student characteristics like race and gender identity, as well as previous achievement-related experiences, effect students’ academic choices. Students could skip any questions they felt uncomfortable answering. After completing the survey questions, participants were given the opportunity to enter a drawing for twenty $20 gift cards.
Recruitment
To recruit the broadest and most demographically diverse sample possible, we used several methods to disseminate the survey and associated materials (introductory email and consent information). IRB-approved recruitment emails were sent to more than 548 program administrators (e.g., departmental administrators, graduate program coordinators, directors of graduate studies) at 120 universities nationwide. These 548 program administrators were purposefully chosen by M.W. to reach a diversity of institution types, including those with student bodies with high demographic diversity. Thus, graduate programs were chosen based on Carnegie classification status, geographic location, and status as minority-serving institutions (including those classified generally as minority-serving institutions, as well as Hispanic-serving institutions, Tribal colleges and universities, and historically Black colleges and universities).
Recruitment emails included a description of the research and participant inclusion criteria, along with a link to the survey and attached consent information. We also sent these materials to several professional society Listservs (e.g., Ecological Society of America, Society for the Advancement of Biology Education Research, National Association for Research in Science Teaching) and posted via social media platforms (e.g., Twitter). The researchers’ goal was for a sample size of ∼160 students, based on previous work that recommended at least 10 participants per survey question to maintain adequate reliability (Weston and Rosenthal, 2003).
Inclusion criteria for survey participants included being over 18 years old and currently enrolled in a life science (e.g., zoology, ecology, forestry, horticulture, botany) graduate program in the United States. “Graduate program” could refer to either an MS or PhD program. Each participant’s nationality, race, ethnicity, gender identity, or other characteristics were not specific inclusion or exclusion factors but were self-identified in the survey. The survey was open for 3 months from October to December in 2021.
Data Analysis
We received 668 survey responses. This data set was cleaned by taking out partially completed and spam entries (i.e., those defined by the Qualtrics system to have failed a reCAPTCHA test and confirmed by researchers), and those completed by participants in programs outside of the United States). After the data set was cleaned, the total sample size was 534. We conducted data analysis in R statistical software (v. 1.2.5) using the car (Fox and Weisberg, 2019), stats (R Core Team, 2013), MASS (Venables and Ripley, 2002), effectsize (Ben-Shachar et al., 2020), ggplot2 (Wickham, 2016), and ggpubr (Kassambara, 2020) packages.
Objective 1: Evaluate Life Science Graduate Students’ Resource Use Outcomes
We calculated three variables to describe students’ resource use outcomes: 1) the total number of resources used by each student, 2) the relative frequency of use for each resource, and 3) the perception of usefulness for each resource.
The total number of resources used was calculated by simply summing the number of resources each student indicated using. Resource use frequency was calculated for each resource by averaging student responses about how frequently they used that resource. Similarly, the perception of resource usefulness variable was calculated for each resource by averaging students’ answers about how useful they thought each resource was. Both variables only included responses from students who indicated they used a given resource (i.e., response values for participants who did not use a resource were left blank instead of being included as zero values). We chose to use these “relative” values for both frequency and perception of usefulness (as opposed to “absolute” values with zeros included), because the relative values for each resource more accurately represented the perceptions of students who used that resource.
Objective 2: Investigate Whether Graduate Student Characteristics Are Related to Students’ Resource Use Outcomes
We analyzed the relationship between several student-level predictor variables (year in program, racial identity, gender identity, and college generation status) and three separate response variables (number of resources used, frequency of resource use, and perception of resource usefulness). We hypothesized that students’ frequency of resource use and perception of usefulness would differ among the different resources; because of this, we ran separate models for each resource (for both frequency of use and perception of usefulness).
We entered each of our predictor variables into R statistical software as factors. We grouped several predictor variables together to ensure adequate statistical power. Statistical power refers to the ability to correctly reject a null hypothesis within any given statistical test, and statistical power is chiefly influenced by sample size (Ellis, 2010). After running a power analysis on our data, we decided to group subcategories of race and year together and to drop two categories of gender identity. Specifically, we grouped racial identities into “white” and “non-white” categories. We grouped 6, 7, and 8+ years in graduate school into one category, called “Sixth+ year.” As opposed to combining subcategories, we dropped the gender identity categories of “agender” and “genderqueer” identities from our analysis, as combining these nonbinary gender identities together did not result in statistical power required for analysis. However, descriptive statistics for agender and genderqueer student responses can be found in the Supplemental Material. Our decision to group race/ethnicity categories into white and non-white was based on the NSF’s (2019) definition of “minority” populations, which includes “Blacks or African Americans, Hispanics or Latinos, American Indians or Alaska Natives, Native Hawaiians or Other Pacific Islanders, Asians, and persons reporting more than one race.” This definition includes all racial/ethnic groups in our data besides white, and grouping race/ethnicity categories by white and non-white provided adequate statistical power. Combining or dropping demographic subcategories is not a preferred practice and represents a limitation in our ability to interpret our data (for further discussion, see Limitations). Thus, our data analysis included four factors (i.e., year, race, college generation status and gender), each with different levels (six, two, two, and two, respectively).
Number of Resources Used.
We used a generalized linear model with a Poisson link function to examine the relationship between the number of resources used (count data) and our predictor variables (i.e., year in program, gender identity, race, and college generation status; Hayat and Higgins, 2014). All predictor variables in this model returned a variance inflation factor (VIF) factor lower than 2, thus we can conclude that there was no multicollinearity present among our predictor variables (Dupuis and Victoria-Feser, 2013).
Frequency of Use and Perception of Usefulness.
To understand the relationship between student characteristics and how frequently students use resources, we first ran linear models for each resource in our survey that predicted students’ rating of their frequency of use by our predictor variables (i.e., year in program, gender identity, race, and college generation status). To ensure that our data were modeled appropriately, we evaluated the normality of model residuals using Q-Q plots (Das and Imon, 2016). Furthermore, we performed two separate tests of normality on each model (Kolmogorov-Smirnov and Shapiro-Wilk; Smirnov, 1948; Shapiro and Wilk, 1965; Das and Imon, 2016). We tested for possible multicollinearity among the predictor variables in each regression. According to the VIF, variance inflation factor (i.e., VIF; Dupuis and Victoria-Feser, 2013), inferences from our models were not affected by multicollinearity of predictor variables. After this, models were adjusted for multiple comparisons using a Benjamini-Hochberg procedure (i.e., false discovery rate adjustment). We chose to use the Benjamini-Hochberg procedure to reduce the number of type 1 errors that may occur when testing multiple hypotheses on a single set of data (Haynes, 2013; Chen et al., 2017). After an adjustment for multiple comparisons was made, only models with significance values less than α = 0.05 were further investigated.
Models that were still significant after adjustment were then evaluated by running analysis of variance (ANOVA) models. These ANOVA models were used to calculate the significance and effect size for each predictor variable. Effect size was calculated using Cohen’s F statistic, which gives the proportion of variance explained by each variable (Cohen, 1988). Standard interpretation of Cohen’s F statistic indicates that values of 0.1, 0.25, and 0.4 represent small, medium, and large effect sizes, respectively (Cohen, 1988; Chen and Chen, 2010). After this, models where year in program was a significant predictor were evaluated using a Tukey honest significant difference (HSD) post hoc test. Tukey HSD tests are used to examine pairwise comparisons across multiple factor levels (i.e., Tukey HSD tests were used here to show the difference between first and second years, first and third years, and so on; Abdi and Williams, 2010). Tukey HSD tests were only conducted on models for which year was a significant predictor, as all our other predictors only contained two levels (i.e., white and non-white; male and female; and first and continuing generation). This same procedure (i.e., linear modeling, evaluating normality, Benjamini-Hochberg adjustment, ANOVA modeling, Tukey HSD post hoc tests) was followed to model the relationships between student characteristics and students’ perceptions of resource usefulness.
Resource Categorization.
To help identify patterns within our data, resources were sorted into broad categories, indicated by an associated color. As we could not find an existing scheme to categorize resources, a team of education researchers, including the authors (M.W. and E.E.S.), created six categories based on how resources are typically used or who provides them. Researchers sorted resources into categories until they came to a consensus. After consensus, researchers created names for the categories. The categories included: academic support, institutionally provided, monetary, networking, and two types of social resources—social resources mainly found within one’s degree program (“social-academic”) and ones found outside a degree program (“social-nonacademic”).
RESULTS
Participants
Table 2 shows the demographic composition of our sample (N = 534). The majority of participants were in the first 3 years of their life science graduate program (64%) and identified as women (70.2%) and white (70.7%). Our sample was about evenly split between participants who identified as first-generation college students (52.06%) and those who did not (46.4%). Participants who chose to disclose their institutional affiliation (90.8%), represented 80 different universities. We did not ask for department names. Participants mostly attended R1 universities (75.6%), defined as those having very high research activity (The Carnegie Classification of Institutions of Higher Education, n.d.). Further, of the universities represented in our sample, 17 were classified as minority-serving institutions (MSI; U.S. Department of Education, 2020). Students attending MSIs represented 24.16% of our sample. A map showing the geographic distribution of the universities represented in our sample is shown in Supplemental Figure 1.
| Demographic category | Number of students | Percent of total sample |
|---|---|---|
| Race and ethnicity | ||
| White | 378 | 70.78% |
| Black or African American | 15 | 2.81% |
| Asian | 43 | 8.05% |
| American Indian or Alaskan Native | 0 | 0% |
| Hispanic, Latino, or Spanish origin | 32 | 5.99% |
| Middle Eastern or North African | 5 | 0.94% |
| Native Hawaiian or other Pacific Islander | 2 | 0.37% |
| Another race or ethnicity not listed | 8 | 1.50% |
| Multiracial (two or more races listed above) | 51 | 9.55% |
| Gender identity | ||
| Man | 133 | 24.90% |
| Woman | 375 | 70.22% |
| Agender | 4 | 0.74% |
| Genderqueer | 22 | 4.11% |
| First-generation status | ||
| First-generation student | 278 | 52.06% |
| Not a first-generation student | 248 | 46.44% |
| Prefer not to answer | 8 | 1.49% |
| Year in program | ||
| 1 | 118 | 22.09% |
| 2 | 126 | 23.59% |
| 3 | 98 | 18.35% |
| 4 | 87 | 16.29% |
| 5 | 61 | 11.42% |
| 6 | 32 | 5.99% |
| 7 | 7 | 1.31% |
| 8+ | 5 | 0.93% |
| Institution type (Carnegie Classification) | ||
| R1 | 404 | 75.65% |
| R2 | 74 | 13.85% |
| Other | 3 | 0.56% |
| No answer | 53 | 9.92% |
Objective 1: Evaluate Life Science Graduate Students’ Resource Use Outcomes
Number of Resources Used.
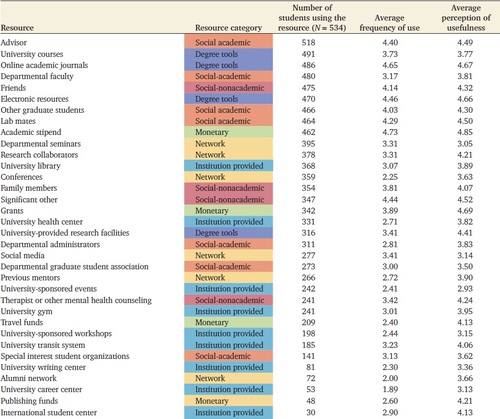
On average, graduate students reported using 19.42 (±0.245) resources from the given list of 34 resources to support their work in their graduate degree programs. The number of resources used by individual participants ranged from one to 33 resources, with a mode of 18 resources. Overall, we found that “advisor” was the resource selected most often by students (selected by 518 of the 534 participants), followed by university courses (491) and online academic journals (486). The three least-chosen resources were international student center, publishing funds, and university career center, selected by only 30, 48, and 53 students, respectively (Table 3).
 |
Frequency of Use and Student Perceptions of Usefulness.
As noted in the Methods section, we show the relative (averages reflect those who selected that resource) versus absolute values for resource use frequency and perception of resource usefulness. Descriptive statistics for each resource in terms of frequency of use and perception of usefulness can be found in the Supplemental Material.
Resources’ frequency of use was rated from 1 to 5, with 1 representing infrequent use and 5 representing frequent use. Resource use frequency ranged from a low of 1.89 (university career center) to a high of 4.73 (academic stipend). Of the 34 resources listed in the survey, the most frequently used resource was academic stipend (4.73), followed closely by online academic journals (4.65; Figure 2A).

FIGURE 2. Bar chart of 34 resources ranked by (A) average frequency of use and (B) average perception of usefulness. The different colors represent the six broad resource categories: academic support, intuitionally provided, monetary, network, social-academic, and social-nonacademic.
Similarly, participants evaluated resources in terms of their usefulness, rating resources from 1 to 5, where 1 represented “not very useful,” and 5 represented “very useful.” Average perception of usefulness ranged from 2.93 (university-sponsored events) to 4.85 (academic stipend). Following academic stipend, grants (4.69) and online academic journals (4.67) were the top most useful resources (Figure 2B).
To examine the relationship between students’ frequency of use and perceptions of usefulness, we plotted the two variables against each other (i.e., average frequency of use ∼ average perception of usefulness; Supplemental Figure 2) and calculated the correlation value between the two variables. We found that, as predicted by EVT, perceptions of usefulness and frequency of use were positively correlated, with a correlation value of 0.583.
Objective 2: Investigate Whether Graduate Student Characteristics Are Related to Students’ Resource Use Outcomes
We modeled the interactions between student characteristics (i.e., year in program, race, gender identity, and college generation status) and the three resource use variables (i.e., overall number of resources used, frequency of use for each resource, and perception of usefulness for each resource). We ran one generalized linear model to examine the overall number of resources students used. For frequency of use and perception of usefulness, we ran a separate ANOVA for each resource (thus, 34 models for frequency of use and 34 models for perception of usefulness) and evaluated effect size using Cohen’s F statistic for each model. In models in which the year in program variable was a significant predictor, we further ran Tukey HSD post hoc tests to evaluate differences among years. We report results from these models in Tables 4–6.
| Predictor variables | βa | SE | p value | Reference group |
|---|---|---|---|---|
| Second year | 0.087 | 0.031 | 0.005** | First year |
| Third year | 0.190 | 0.032 | <0.001*** | First year |
| Fourth year | 0.233 | 0.033 | <0.001*** | First year |
| Fifth year | 0.300 | 0.035 | <0.001*** | First year |
| Sixth+ year | 0.261 | 0.040 | <0.001*** | First year |
| Non-white | −0.044 | 0.019 | 0.022* | White |
| Male | −0.157 | 0.024 | <0.001*** | Female |
| Continuing- generation | 0.019 | 0.020 | 0.335 NS | First-generation |
 |
 |
Number of Resources Used.
As students’ years in their programs increased, so too did the number of resources they used, and these increases across years were highly significant (Table 4). Furthermore, our model showed that non-white students used significantly fewer resources than white students and that male students used significantly fewer resources than female students. There were no significant differences between first-generation and continuing-generation students in the number of resources used.
Frequency of Use.
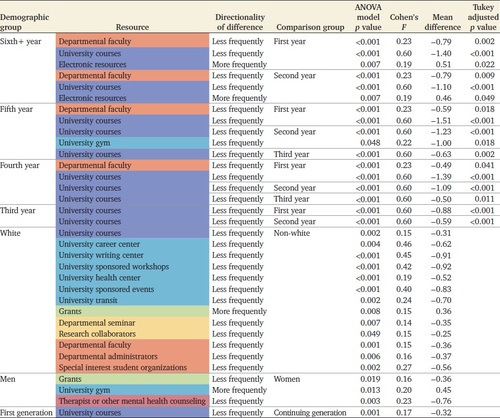
We found 16 resources that differed significantly in terms of students’ frequency of use by demographic group. Generally, as year in program increased, students tended to use academic support resources (e.g., departmental faculty, courses) less frequently as compared with previous years (Table 5 and Figure 3). The only exceptions were that students in year 6 and higher used electronic resources more frequently than in earlier years. Significant models of resource frequency of use by year are shown in Figure 3. Thirteen of the 34 resources surveyed were used with significantly different frequencies between white and non-white students; compared with white students, non-white students reported using institutionally provided resources (e.g., university workshops, transit system, health center, career center) significantly more frequently than white students. Furthermore, non-white students used some social-academic resources (i.e., departmental administrators, departmental faculty, special-interest student organizations) significantly more frequently than white students did. These comparisons between white and non-white students are shown in Table 5 and in Figure 4. Men in our study used grants and mental health counseling significantly less frequently than women did, though they used university gyms more frequently (Table 5). The only resource that was used significantly differently between first- and continuing-generation students was university courses, with first-generation students using this resource less frequently than their continuing-generation counterparts (Table 5). Generally, effect sizes for the relationships between student demographics and their frequency of resource use ranged from small to medium, with larger effect sizes for the relationship between year in program and students’ frequency of use of university courses (0.6) and the relationships between racial identity and students’ use of institutional resources (e.g., university career center, 0.46; university writing center, 0.45).

FIGURE 3. Violin plots showing resources for which there were significant differences in frequency of resource use among students based on year in program. White dots indicate median value.

FIGURE 4. Violin plots showing resources for which there were significant differences in frequency of resource use between white and non-white students. White dots indicate median value.
There were several resources with no significant difference in students’ frequency of use across demographic categories. These resources included: academic stipend, advisor, alumni network, conferences, university-provided research facilities, online academic journals, international student center, lab mates, university library, departmental graduate student association, previous mentors, friends, significant others, family, publishing funds, social media, travel funds, and other graduate students. Thus, we can assume that students in our study used these resources with relatively similar frequency, regardless of their demographic characteristics.
Perception of Usefulness.
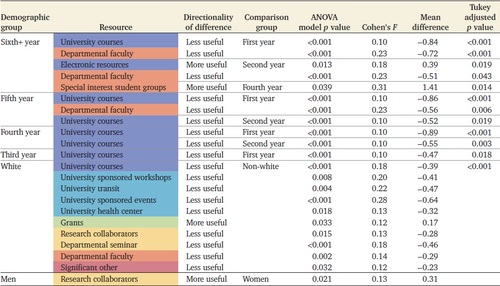
We found 12 resources that differed significantly in terms of students’ perceptions of usefulness by demographic group. Generally, as year in program increased, students tended to perceive some academic support resources (i.e., university courses, departmental faculty) as less useful (Table 6 and Figure 5). Ten of the 34 resources were perceived significantly differently between white and non-white students in terms of their usefulness. These included some social resources (i.e., departmental faculty and significant others), institutionally provided resources (i.e., university transit, university workshops, university health center), and academic support resources (i.e., university courses), all of which white students perceived as significantly less useful compared with non-white students (Table 6 and Figure 6). Only one resource, grants, was perceived as significantly more useful by white students compared with non-white students. In terms of gender differences, only one resource, research collaborators, was perceived significantly differently between men and women in our study (Table 6). There were no significant differences in perception of resource usefulness between first- and continuing-generation students. Effect sizes for the relationships between student demographics and their perceptions of usefulness were generally smaller than effect sizes seen in the models for students’ frequency of use. Effect sizes for models of students’ perceptions of usefulness ranged from small to medium, with the largest effect size for the relationship between year in program and students’ perceptions of usefulness of departmental faculty (0.23) and special interest student groups (0.31).

FIGURE 5. Violin plots showing resources for which there were significant differences in perceptions of resource usefulness among students based on their year in program. White dots indicate median value.

FIGURE 6. Violin plots showing resources for which there were significant differences in perceptions of resource usefulness between white and non-white students. White dots indicate median value.
There were a number of resources that showed no significant differences in students’ perceptions of usefulness across demographic categories. These included: academic stipend, advisor, alumni networks, conferences, university-provided research facilities, online academic journals, international student center, lab mates, university library, university gym, departmental graduate student association, friends, family, publishing funds, social media, travel funds, other graduate students, departmental administrators, university writing center, previous mentors, university career center, and mental health counseling. Thus, we can assume that, regardless of student demographic characteristics, students perceived the usefulness of these resources relatively similarly.
DISCUSSION
This study evaluated the many resources that life science graduate students used in their graduate programs and investigated the relationship between student characteristics and student resource use. We found that students used a variety of resources and that students’ rankings of their frequency of use and perceptions of usefulness seemed to reflect a hierarchy of needs (Maslow, 1965). Specifically, students’ most frequently used and useful resources often reflected the fulfillment of basic financial needs (e.g., academic stipend) first, followed by academic and social needs. When investigating the relationship between resource use outcomes and student characteristics, we found that year in program, racial identity, gender identity, and college generation status were all predictors of students’ resource expectations and resource use, with racial identity (i.e., white vs. non-white) being a significant predictor for the highest number of resources (14, compared with five for academic year, four for gender, and one for college generation status). Finally, there was a positive correlation between students’ perceptions of resource usefulness and frequency of resource use (Supplemental Figure 2) as posited by EVT and EVTHS (i.e., students’ expectations and values should be predictive of their resource use outcomes).
Overall, this study supports EVT’s theoretical assertion that students’ choices (i.e., frequency of use) and their perceptions of value (i.e., perceptions of usefulness) are related and that students’ demographic characteristics may impact their resource use choices (Figure 1). The differences between white and non-white student resource use in particular suggests a need to explore whether resources may potentially impact degree outcomes among graduate students. Overall, this study reveals implications for which resources should be emphasized in mentoring conversations, how the academic socialization process may impact student resource use, and which types of resources may matter most to different groups of students.
In previous literature related to graduate studies, the student–advisor relationship is often highlighted as the most important aspect of a graduate program. Previous work has linked the student–advisor relationship to achievement, well-being, and persistence within graduate school (Liénard et al., 2018; Sheehy, 2019). Thus, one would imagine that it would be ranked highly in students’ perceptions of usefulness and frequency of use. However, while students in our study did rank advisor highly, it was not the most frequently used resource, nor was it seen as the most useful resource. Instead, advisor was the fifth most frequently used resource and the seventh most useful resource, while resources like academic stipend, significant other, and online academic journals were all ranked higher than advisor in both categories. Thus, while our results do support previous work indicating the importance of the student–advisor relationship, our data indicate that students do not perceive advisors to be the most important resource within their graduate programs. We suggest that previous results indicating the importance of advisors may have excluded other important drivers of student achievement and persistence by focusing on one resource versus a suite of options.
When provided a broad range of resources, participants in our study seemed to rank them in terms of their ability to fill students’ basic needs, like physiological, safety, and social needs (Zivin et al., 2009; Tight, 2020; Bond et al., 2020; Calitz et al., 2020). For example, academic stipend fulfills students’ basic physiological needs (i.e., by paying for housing, food, utilities), while dissertation-specific tools like online academic journals, electronic resources, and grants help to ensure students’ continuation in their programs, and thus may be considered to fulfill academic safety needs. Beyond these categories, social resources (e.g., family, friends, significant others, lab mates) ranked relatively high in terms of frequency of use and perception of usefulness and indicate the importance of social support to graduate students’ success, especially for minoritized students (e.g., Burt et al., 2019; Estrada et al., 2019; Mishra, 2020). The prioritization of resources in this study mirrors theoretical conclusions from Maslow’s motivation model (i.e., Maslow’s hierarchy of needs), suggesting that this model may be useful in conceptualizing graduate students’ resource use in future work (Maslow, 1965).
Our results suggesting the importance of basic physiological, safety, and social needs is a reminder that many graduate students in the United States struggle to meet their basic needs and that this has cascading impacts on performance and success. In the United States, levels of food insecurity among university students (both graduate and undergraduate) are significantly higher than the national average (Bruening et al., 2017; Goldrick-Rab et al., 2018). Furthermore, a 2020 survey found that a quarter of graduate students had experienced housing insecurity in the past year. Further, previous literature has extensively documented that minoritized students (e.g., students of color, first-generation students, low socioeconomic status students) often lack adequate social support and feel stigmatized or otherwise unsafe within higher education (Maffini, 2018; Wilson and Liss, 2020; Livingston, 2021). Naturally, when students’ basic needs are unmet, their outcomes suffer; metrics like research productivity, levels of psychological distress, and program attrition have been linked to food and housing insecurity (Millett and Nettles, 2006; Dubick et al., 2016; Nazmi et al., 2019; Balzer Carr and London, 2020), as well as lack of social support (Collie et al., 2017; Li et al., 2018; Mishra, 2020). Despite this, in the United States, the majority of graduate students’ stipends are equivalent to or slightly above poverty level (on average, $35,000 a year; Flaherty, 2018). In addition to a lack of resources to fulfill basic physiological needs, significantly less social support has been reported by international students, when compared with their domestic counterparts, report significantly less social support (Brunsting et al., 2019). Further, Li and colleagues (2021) found that graduate students, regardless of group identity, reported less social and material support during the COVID-19 pandemic. The precarious nature of resources provided to graduate students—just enough stipend to get by, social support predicated on in-person interactions—can cognitively distract students from their academic and career goals. As such, our findings suggest that a need for adequate financial and social support should not be viewed by a department as unnecessary, but instead as critical for student success.
We found that year in program was a significant predictor for all three resource use outcomes: number of resources used, frequency of resource use, and perception of resource usefulness. As student year in program increased, so too did the number of resources that students used, while student frequency of use and perception of usefulness generally showed an inverse relationship with students’ years in their programs. These results support the relationship between previous achievement-related experiences and academic outcomes that is posited by our theoretical framework, EVT (Eccles and Wigfield, 2002). Eccles and Wigfield (2002) suggest that, as students gain more experience within an academic setting, they tend to change their achievement-related choices. These changes in student choices over time may be further explained by the process of academic socialization, wherein students gain the knowledge, skills, and values needed to succeed within the academic domain (Tinto, 1993; Weidman et al., 2001). Weidman and colleagues (2001) propose four distinct stages of academic socialization: anticipatory, formal, informal, and personal; each of these stages may see a change in students’ resource use outcomes (i.e., the number of resources used, frequency of resource use, and perception of resource usefulness) as well as a change in students’ overall knowledge of which resources are available to them. Furthermore, during this process, students generally become more independent and specialized (both in terms of research area and degree-related tasks), and this may explain our findings of an overall decrease in frequency of resource use and perception of resource usefulness as year in program increases (Lovitts, 2002; Griffin et al., 2020; Weidman, 2020). Our work suggests that documenting resource use of graduate students over time may be one way to track the progress of socialization or even help to identify students who are having difficulties in their programs. Previous work has found that graduate students undergo a unique socialization process and that interrupting this process can cause student outcomes to suffer (e.g., attrition from program: Golde 1998; decreased academic achievement: Benavides and Keyes, 2016; decreased sense of belonging: Strayhorn, 2018). Thus, the study of expected resource use over time may help to intervene and redirect students toward a more successful path.
Student racial identity was a significant predictor of the frequency of use and perception of usefulness for many resources. These results align with previous work, which has found that non-white students experience graduate programs differently than white students (e.g., Twale et al., 2016; Guy and Boards, 2019; George Mwangi et al., 2019). Further, these results support our theoretical framework’s proposed relationship between cultural milieu and academic choices, though more data are needed to support a causal relationship between these variables. In our study non-white students often used resources in the institutionally provided and social categories more frequently and perceived them as more useful compared with white students. These results are supported by previous work that has found social support to be integral to the success and retention of non-white students (e.g., Black male graduate students: Burt et al., 2019; nontraditional undergraduates: Cotton et al., 2017; Native American undergraduates: Jackson et al., 2003). Furthermore, previous research has found that institutionally provided resources like university career centers and student cultural centers are helpful for Black and Latino students to find community and discover pathways to success (Santiago, 2008; Museus et al., 2018; Serrano, 2020). Despite this empirical support, the past decade has seen large cuts to institutional student services, which serve both graduate and undergraduate students (Mitchell et al., 2018, 2019; Perry et al., 2020). Indeed, Mitchell and colleagues (2019) revealed that universities in the United States have significantly cut their funding for student services over the past 10 years. However, our results suggest that, while these institutional resources may not be used or perceived equally among all students, they may be critical for students previously identified to be the most at-risk for attrition. This implies that extant funding structures may be unequally affecting minoritized students. Thus, considering the nuance within students’ use and perceptions of resources when creating and enacting policy may be integral to equitable graduate student success.
Student gender identity was a significant predictor for the resource use outcomes for four resources: grants, mental health counseling, research collaborators, and university gym. Based on findings from previous literature and our theoretical framework, we expected to find significant gender differences in resource use for many more resources (e.g., classroom materials, teachers, peers; Makara and Karabenick, 2013; Pramuda et al., 2019). However, the majority of previous studies examining gender differences in resource use were conducted in primary and secondary school environments, suggesting that more work is needed regarding the relationship between resource use and gender identity within graduate education. In our study, women used more resources overall than men, suggesting that a leaky pipeline of women from graduate programs may not be related to a lack of available resources, but perhaps how those resources are being used. Thus, understanding how women use and perceive resources is one area of future study. Because of sample size constraints, our study was also only able to examine differences between students who identified as men and women, not students with nonbinary gender identities, who are critically understudied. Future work should emphasize a large and diverse sample size to include the experiences of all identities.
Finally, college generation status only predicted the frequency of use and perception of usefulness for one resource: university courses. College generation status did not significantly predict the number of resources that students used. These results contradict previous empirical work, which has found that continuing- and first-generation college students experience academia differently. For example, Engle and Tinto (2008) found that first-generation undergraduate students were far less likely to seek help from professors than their continuing-generation peers. Much of the scholarship related to first-generation student experiences draws from the theoretical framework of social capital theory, which states that individuals’ social networks and knowledge of (mainly white, upperclass) cultural norms are assets that can be leveraged for an advantage within academia (Bourdieu, 2011). Thus, one would expect that first- and continuing-generation students would have different resource use outcomes, informed by their differing levels of social capital. However, it may be that the difference in social capital is inconsequential in terms of students’ use and perception of resources by the time students reach the level of graduate education. Another possible explanation for our findings may be related to the intersectionality of generation status and other identities (i.e., gender, race, international vs. domestic status), which may be where variation in students’ resource use outcomes can be identified.
Limitations
We are mindful of several limitations that constrain the conclusions that may be drawn from our results. Specifically, despite our efforts to recruit and collect as diverse a sample as possible, the demographic composition of the sample is not fully representative of the racial, ethnic, and gender diversity present within life science graduate programs broadly, and the list of resources presented on the survey may not have fully captured all of the resources graduate students use within their programs.
In comparison to overall demographic composition of life science graduate programs in the United States, first-generation students were overrepresented in our sample. The NSF has previously published that ∼30% of STEM graduate students are the first in their families to go to college, while they represented the majority (52%) of our sample (NSF, 2015). Within this study, participant demographics within the categories of gender and race and ethnicity are not representative of life science graduate students broadly. Indeed, the NSF determined in 2020 that 60% of life science graduate students were female (compared with 70% of our sample) and that 47% of life science graduate students were white (compared with 71% of our sample; National Science Board, 2020). These demographic differences limit the transferability of our findings from the experiences and perceptions of our sample to those of life science graduate students more broadly.
Furthermore, because of the relatively small sample size within certain demographic groups (e.g., mixed-race, Hawaiian or other Pacific Islander) we had to combine multiple demographic categories (i.e., into one non-white category). This limited the conclusions we were able to draw about differences in resource use among non-white graduate students. Previous work has proposed that Asian students are not underrepresented within STEM domains (NSF, 2019; Chen and Buell, 2018), and as this study’s goal was to understand differences in student resource use that may lead to inequities within higher education, one may conclude that racial groups should have instead been categorized as underrepresented minority (URM) and non-URM groups (i.e., Asian and white students). However, this study used the NSF’s definition of “minority” populations (i.e., “Blacks or African Americans, Hispanics or Latinos, American Indians or Alaska Natives, Native Hawaiians or Other Pacific Islanders, Asians, and persons reporting more than one race.”), not URMs, to split racial groups. This decision was made because the term “Asian American” represents more than 20 ethnic subgroups (Hoeffel et al., 2012), and the assumption that Asian Americans are adequately represented in STEM domains ignores the intragroup diversity in experiences and struggles (Iporac, 2020; Kang et al., 2021). Thus, we chose to keep students of Asian racial identity within our categorization of minoritized students, despite the known limitations. We are aware that minoritized students certainly do not experience graduate school as a monolith,, and our data are limited insofar as we were unable to examine students’ experiences at the appropriate level of detail. Thus, future work should seek a larger and more diverse sample of students in order to tease apart differences in resource use at a more nuanced level.
To account for any resources that were missing from the survey list, participants were given an opportunity to list any other resources they used that did not appear on the list. One hundred thirty-six participants (25%) wrote in additional resources and, of these, participants listed 20 unique resources not included in the survey’s resource list. These 20 unique resources were mentioned by 59 participants (10.9% of sample). The other 77 participants wrote in resources that would have been broadly categorized under resources that already existed on the survey list (e.g., participant listed “journal clubs for credit” when “university courses” was already listed). Given that life experiences, needs, social and academic contexts are unique to each graduate student, it is plausible that some resources may have been missed during survey development, and future research into students’ resource use should incorporate the resources missed in our survey (which we listed in the Supplemental Material) and should have an option for students to write in resources.
CONCLUSION
Our study explored a critically understudied aspect of the graduate school experience: student perception and use of resources. We revealed important descriptive information about life science graduate student resource use and identified relationships between student characteristics like race and year in program and student resource use. Given our results and our intention for these results to inform disparities among students in STEM higher education, we have generated several recommendations for university leaders, advisors, and researchers. First, we suggest that universities and departments focus on policies and support to fill students’ basic needs (e.g., increasing student stipends, ensuring that students feel safe on campus). Once these needs are adequately and equitably addressed, we believe that students will be more able to focus on academic and career success. Furthermore, given that students are not a monolith when it comes to resource use, we suggest that universities should survey student resource use and perception before creating resource allocation policies, to most appropriately serve their students’ unique needs. Future research should investigate the factors that drive differences in student resource use and whether these differences in resource use and perception translate into different academic outcomes.
ACKNOWLEDGMENTS
We would like to thank the many graduate students who participated in this study and shared their experiences with us. We would also like to thank Hope Ferguson and Drs. Elizabeth Derryberry, Courtney Faber, Nina Fefferman, Joshua Rosenberg, and Caroline Wienhold for their feedback and support throughout the research process. We would like to thank the monitoring editor and reviewers for their thoughtful comments, which helped to shape this work. Partial funding for open access to this research was provided by University of Tennessee’s Open Publishing Support Fund.