Introducing the Postsecondary Instructional Practices Survey (PIPS): A Concise, Interdisciplinary, and Easy-to-Score Survey
Abstract
Researchers, administrators, and policy makers need valid and reliable information about teaching practices. The Postsecondary Instructional Practices Survey (PIPS) is designed to measure the instructional practices of postsecondary instructors from any discipline. The PIPS has 24 instructional practice statements and nine demographic questions. Users calculate PIPS scores by an intuitive proportion-based scoring convention. Factor analyses from 72 departments at four institutions (N = 891) support a 2- or 5-factor solution for the PIPS; both models include all 24 instructional practice items and have good model fit statistics. Factors in the 2-factor model include (a) instructor-centered practices, nine items; and (b) student-centered practices, 13 items. Factors in the 5-factor model include (a) student–student interactions, six items; (b) content delivery, four items; (c) formative assessment, five items; (d) student-content engagement, five items; and (e) summative assessment, four items. In this article, we describe our development and validation processes, provide scoring conventions and outputs for results, and describe wider applications of the instrument.
INTRODUCTION
A new era of science education has been heralded by calls for change in science teaching and learning at the postsecondary level. University staff and faculty are engaged in continuing initiatives to cultivate public scientific literacy (e.g., Rutherford and Ahlgren, 1990), enhance workforce readiness (e.g., Carnevale et al., 2011), and increase the competitiveness of the United States in the global economy (e.g., President’s Council of Advisors on Science and Technology, 2012). A central action of many change initiatives has been to encourage postsecondary instructors to adopt pedagogical approaches based in research on how people learn (National Research Council, 2000; American Association for the Advancement of Science [AAAS], 2011). As these initiatives are planned, enacted, and evaluated, it is paramount to have reliable and valid methods to measure initial and continuing conditions (AAAS, 2013). The goal of this study was to address this need by designing and validating a survey, the Postsecondary Instructional Practices Survey (PIPS), to measure the instructional practices of postsecondary instructors.
LITERATURE REVIEW
There are many potential methods to measure instructional practices. These include faculty surveys, student surveys, interviews, class observations, and portfolio/artifact analysis (AAAS, 2013). We see faculty self-report as a particularly useful method, as surveys are easy to administer and can get at instructional practices that are difficult to observe. For example, compared with self-report surveys, peer and protocol-based observations can be expensive and difficult to implement at scale.
One concern about surveys is that instructors may inaccurately self-report their teaching practices. There has been limited study of this issue, and the results are currently inconclusive. One study found that, compared with the ratings of trained observers, instructors completing self-report surveys overestimate the amount of student interactivity in their classrooms (Ebert-May et al., 2011). However, in a study with better alignment of survey items and observation codes, observational data support and align with self-report from instructors (Smith et al., 2014). This second study suggests that there are aspects of instruction that instructors can accurately self-report. We expect good alignment of the PIPS with common observation protocols, as our conceptual framework was developed from a critical analysis of the literature (Walter et al., 2015) and drew from observation codes of the Teaching Dimensions Observational Protocol (TDOP; Hora et al., 2012) and the Reformed Teaching Observation Protocol (RTOP; Piburn et al., 2000). Initial data from our case studies indicate that PIPS self-report data significantly correlate with several TDOP codes (Walter et al., 2016).
When we first began exploring the idea of building our own instrument, we considered existing surveys of instructional practice. Over the past decade, the literature has blossomed with instruments of this nature, including 10 surveys summarized in AAAS (2013) and the Teaching Practice Inventory (TPI) by Wieman and Gilbert (2014). Willliams et al. (2015) examined the nature these surveys in a detailed item- and instrument-level analysis. We note that although there are 11 published surveys of instructional practices, none is designed to elicit teaching practices (and only teaching practices) from an interdisciplinary group of postsecondary instructors.
Most available instruments are designed to survey faculty from a specific discipline, and therefore may contain discipline-specific jargon. Unless these surveys are revalidated for new populations, they should only be used for their intended populations to preserve face validity (DeLamater et al., 2014). Discipline-specific surveys include those designed for chemistry and biology faculty (Marbach-Ad et al., 2012), engineering faculty (Brawner et al., 2002; Borrego et al., 2013), geoscience faculty (MacDonald et al., 2005), physics faculty (Dancy and Henderson, 2010), statistics faculty (Zieffler et al., 2012), and math and science faculty (TPI; Wieman and Gilbert, 2014).
The remaining four surveys of instructional practices are interdisciplinary and can also find differences among the teaching practices of instructors from different disciplines. For example, the 2011–2012 Higher Education Research Institute (HERI) faculty survey indicated that 62% of faculty members in science, technology, engineering, and mathematics (STEM) use “extensive lecturing” in all or most of the courses they teach, compared with 36% in all other fields (Hurtado et al., 2011). One potential disadvantage to using large-scale nationwide surveys is that they elicit a wide range of elements about teaching and the academic workplace. Only a fraction of the items on these instruments elicit actual teaching practices. The Approaches to Teaching Inventory (ATI), for example, has some items about teaching but also items about the instructor’s beliefs about and goals for teaching (Trigwell and Prosser, 2004). Other instruments elicit a variety of academic workplace features, such as faculty perceptions of institutional climate and relationships with campus staff. These surveys include the Faculty Survey of Student Engagement (FSSE; Center for Post-secondary Research at Indiana University, 2012), HERI (Hurtado et al., 2011), and the National Study of Postsecondary Faculty (NSOPF; National Center for Educational Statistics [NCES], 2004). Two of these are available on a proprietary (HERI) or permission-only (FSSE) basis.
Finally, we note that many existing instruments (discipline specific and interdisciplinary) use inconsistent item scales, complicated scoring conventions, and potentially bias-generating educational jargon (e.g., “inquiry,” “problem-based learning,” and “authentic research practices”; Walter et al., 2016). Several are also lengthy. For example, the FSSE has 130 items (Center for Post-secondary Research at Indiana University, 2012) and the NSOPF has 83 items and takes 30 minutes to complete (NCES, 2004).
On the basis of our analysis of the current state of instruments for measuring teaching practices, we decided that there was a need for a new instrument that met the following design criteria: 1) applicable across all undergraduate disciplines, 2) succinct and easy to administer, 3) uses an intuitive scoring convention, and 4) available to any user on a nonproprietary basis. With these principles in mind, we began to design the PIPS.
METHODOLOGY
Our goal was to design an interdisciplinary, succinct, and psychometrically sound survey of postsecondary instructional practices. In this paper, we describe the development of the PIPS and explore the following two research questions:
RQ1. Do PIPS items group together into valid, reliable, and measurable variables? | |||||
RQ2. What are some of the emergent patterns in the PIPS data among the four surveyed institutions and 72 surveyed departments? | |||||
Conceptual Framework
We drew from the empirical and theoretical literature as we developed the PIPS. There is an extensive literature base that describes research on instructional practices (e.g., Pascarella and Terenzini, 1991, 2005) but no standard conceptual model. We therefore shaped our items and conceptual categories by finding themes in the 1) research on instructional practice, 2) teaching observation protocols, and 3) existing self-report teaching practice surveys.
We compiled 153 items by combining applicable items and concepts from the four interdisciplinary instructional practice surveys (ATI, FSSE, HERI, NSOPF) and two observational protocols (RTOP, TDOP). These items and codes were triangulated by themes in four comprehensive literature reviews (Pascarella and Terenzini, 1991, 2005; Iverson, 2011; Meltzer and Thornton, 2012). We reduced and revised an initial set of 153 items by removing redundant items, items that did not refer to actual teaching practices (i.e., beliefs about teaching or intent to teach in a given manner), and checklists of generalized practices (e.g., “lecture,” “lecture with demonstration,” “multiple-choice tests”). We excluded instructional technology items (e.g., digital tablets, pointers), as we consider most instructional practices to be transcendent of technology; that is, the practices on the PIPS can be implemented with or without the use of technology.
As we reduced and revised the initial set of items, we organized them into four conceptual categories: instructor–student interactions, student–content interactions, student–student interactions, and assessment. These are not the only categories by which one could sort the items, but we found conceptual categories helpful in understanding the nature of available instructional practice survey questions and used the categories to generate our own items.
Item Generation
Using the four conceptual categories as a guiding framework, we went through multiple rounds of item generation (43 new items) and revision or removal of the original 153 items. The final version of the PIPS has 24 instructional practice items (13 new, 11 revised). It was our goal to generate a broad range of instructional practices not an inventory of all possible instructional practices. It was also not our goal to have an equal number of items in each conceptual category.
The research team and four education researchers from an outside institution revised the items for clarity and to reduce the potential for eliciting socially acceptable responses. For example, item P05, originally from the ATI (Trigwell and Prosser, 2004), was revised to remove unnecessary words: “I design my course with the assumption that most students have very little useful knowledge of the topics to be covered.” We found other items needed to be carefully worded when they described more traditional, transmission-based teaching approaches. We therefore set the tone of the PIPS by starting the survey with a statement that describes such an approach. We do not downplay this approach as “just lecture” but rather “I guide students through major topics as they listen and take notes” (item P01). Item P03 is similarly nonevaluative: “My syllabus contains the specific topics that will be covered in every class session.”
Items were also eliminated or revised during our field-testing stage if they elicited more than one teaching practice (i.e., items could not be double-barreled; Clark and Watson, 1995; Podsakoff et al., 2012). For example, Iverson (2011) describes groups formed by students, the teacher, or the researcher as a common social learning approach. As a statement on a survey, this concept would be double-barreled. Instead, we chose to write the item for this concept based on RTOP code 18 (Piburn et al., 2000): “I structure class so that students regularly talk with one another about course concepts.” This text became PIPS item P12.
Intended Population and Context
Any postsecondary instructor from any discipline can be surveyed with the PIPS, including full- and part-time instructors, graduate students, and instructional staff. For the data reported herein, we asked participants to reference teaching the largest-enrollment, lowest-level course they have taught in the last 2 yr. We believe this setting is one of the most challenging in which to use research-based instructional strategies in comparison with smaller-enrollment, higher-level courses. This setting is also of primary concern to researchers, funding agencies, and policy makers interested in instructional change (e.g., AAAS, 2013).
Scale
The PIPS requires respondents to rate instructional practice statements on a scale of descriptiveness. We selected a five-point Likert-style scale to produce maximum variance with minimum response overlap (Bass et al., 1974). There is no neutral point on the scale, as removing a neutral option from the scale generates better variability (Bishop, 1987; Johns, 2005). Response options include
Not at all descriptive of my teaching (0) | |||||
Minimally descriptive of my teaching (1) | |||||
Somewhat descriptive of my teaching (2) | |||||
Mostly descriptive of my teaching (3) | |||||
Very descriptive of my teaching (4) | |||||
Data Sources
We surveyed a convenience sample of 891 postsecondary instructors from four institutions of higher education in the United States (Table 1). The survey was administered online using Qualtrics, and the overall response rate was 35.7% (891/2494). Our research team administered the survey at Institutions A and C, and researchers at other institutions administered the survey (with our guidance) at Institutions C and D.
| Institution A | Institution B | Institution C | Institution D | |
|---|---|---|---|---|
| N | 216 | 164 | 87 | 424 |
| Departments surveyed | 19 | 9 | 10 | 40 |
| Response rate | 37.1% | 64.1% | 27.7% | 28.0% |
| Disciplines | STEM and applied sciences | STEM | Biological sciences | All departments |
| Instructors surveyed | Full- and part- time faculty; graduate students | Full- and part-time faculty | Full-time faculty only | Full- and part-time faculty; graduate students |
| U.S. region | Midwest | East | Southeast | Mountain West |
| Control | Public | Public | Public | Public |
| Carnegie classification | Research university High research activity | Research university Very high research activity | Research university Very high research activity | Master’s college or university (larger program) |
| Student population | 25,000 | 28,000 | 34,000 | 22,000 |
Analyses
We ran factor analyses to examine which items consistently loaded together, following Hu and Bentler’s (1995) recommendations for evaluating model fit. We first ran exploratory factor analyses (EFAs) to identify dimensions of teaching practice using maximum-likelihood extraction with both promax rotations. We selected a maximum-likelihood extraction, because it allows for the shared variance from the model each time a factor is created, while allowing the unique variance and error variance to remain in the model. We selected a promax rotation method, because we expected some of the factors to be oblique (correlated) and because oblique rotations often yield identical or superior results to orthogonal rotations (Osborne, 2015).
Competing models (e.g., a four-dimensional vs. five-dimensional model) were compared using the likelihood ratio test under the null hypothesis that a more complex model does not significantly improve fit with the data at p < 0.05.
We also completed confirmatory factor analyses (CFAs) to evaluate our a priori categorization of the items. We evaluated goodness of fit of hypothesized models by using the root-mean-square error of approximation (RMSEA; Steiger, 2000), chi-squared/df below 5.0 (Bollen, 1989), and a comparative fit index (CFI) near 0.90 (Hu and Bentler, 1999; Byrne, 2013). Guidelines for acceptable model fit statistics values vary. Hu and Bentler (1995) suggest an RMSEA of 0.06 as indicative of a good-fitting model. MacCallum et al. (1996) suggest values of 0.01, 0.05, and 0.08 as indicative of excellent, good, and mediocre fit, respectively.
We also ran analysis of variance (ANOVA), independent t tests, and correlational analyses to examine differences in groups of interest to see whether PIPS could identify group differences in instructional practices and whether those differences were similar to other claims in the literature.
RESULTS
RQ1. Do PIPS Items Group Together into Valid, Reliable, and Measurable Variables?
Validity is the extent that an instrument measures what it was intended it to measure (Haynes et al., 1995). Three commonly reported types of validity are content, face, and construct validity. Content validity documents how well an instrument represents aspects of the subject of interest (e.g., teaching practices). A panel of subject matter experts is often used to improve content validity through refinement or elimination of items (Anastasi and Urbina, 1997). An instrument has face validity if, from the perspective of participants, it appears to have relevance and measure its intended subject (Anastasi and Urbina, 1997). Construct validity refers to the degree an instrument is consistent with theory (Coons et al., 2000); this is often achieved through CFA and/or EFA (Thompson and Daniel, 1996).
Content and Face Validity.
To achieve both content and face validity, we field-tested the PIPS in its entirety with a sample of nonparticipating instructors (N = 5) and a panel of education researchers at another institution (N = 4). This process allowed for items to be revised for clarity, accuracy of content, and relevancy.
Construct Validity.
The PIPS produces both two-factor (2F) and five-factor (5F) solutions that are consistent with theory on how people learn (e.g., National Research Council, 2000) and the nature of assessment practice (Angelo and Cross, 1993); we detail these solutions in the Factor Analyses subsection of the results for RQ2.
Reliability.
The PIPS has an overall instrument reliability of α = 0.800. This value could not be substantially improved with removal of any of the 24 items. We include respective construct reliabilities in Tables 3 (model statistics for 5F scoring solution) and 4 (model statistics for 2F scoring solution) later in this article.
Factor Analyses.
We conducted factor analyses after confirming an acceptable Kaiser-Meyer-Olkin measures of sample adequacy (KMO = 0.879) and a significant Bartlett’s test of sphericity (χ2(276) = 5149.713; p = 0.00). EFA and CFA support two scoring models for the PIPS, a 2F solution and a 5F solution. Both solutions use all 24 instructional practice items and are supported by moderate to good model fit statistics (Table 2). We present both the 2F and 5F options for scoring the PIPS, as different models satisfy different model fit criteria and coarse- and fine-grained instructional practice scores provide different information for users.
| Model fit criteria | 2F solution | 5F solution |
|---|---|---|
| Chi-squared (χ2) | 920.316 | 1070.026 |
| df | 229 | 239 |
| Chi-squared/df | 4.02 | 4.48 |
| CFI | 0.811 | 0.832 |
| RMSEA | 0.066 | 0.071 |
| Variance explained | 37.28% | 52.76% |
| Meets scree plot criterion | Yes | No |
We considered other models supported by the data, including a four-factor and 10-factor option (and other less statistically supported solutions). The four-factor solution is supported by Kaiser criterion, that is, we have four factors with eigenvalues greater than 1.0. However, the four-factor model requires some of the 24 items to be removed and has less logical item groupings than the 5F model. The 10-factor solution has the lowest number of factors supported by a chi-squared goodness-of-fit test (χ2(81) = 105.698; p = 0.034). However, the 10-factor solution has some factors with only one item per factor (and, as such, these factors should be removed; Costello and Osborne, 2005). Furthermore, since we have simpler models with acceptable model fit statistics, the 10-factor solution is not the most parsimonious (Ferguson, 1954).
Measuring PIPS Factor Scores
Scoring Option A: The 5F Scoring Option.
One of the options for scoring the PIPS is a 5F scoring option. This model provides more detail on the instructional practices of a participant or group of interest than the more simplified 2F model (see Scoring Option B). We present reliability scores, model fit statistics, and items by factor for the 5F model in Table 3.
| Factor 1: Student–student interactions | Factor 2: Content delivery practices | Factor 3: Formative assessment | Factor 4: Student–content engagement | Factor 5: Summative assessment | |
|---|---|---|---|---|---|
| Reliability (α) | 0.825 | 0.644 | 0.641 | 0.606 | 0.447 |
| Number of items | 6 | 4 | 5 | 5 | 4 |
| Eigenvalue | 5.744 | 3.285 | 1.351 | 1.258 | 1.094 |
| Percent variance explained | 24.059 | 13.686 | 5.629 | 5.240 | 4.141 |
| Items | P10, P12, P13, P14, P15, P19 | P01, P03, P05, P11 | P04, P06, P08, P18, P20 | P02, P07, P09, P16, P17 | P21, P22, P23, P24 |
| Maximum possible sum | 24 | 16 | 20 | 20 | 16 |
| Sample item | I structure class so that students regularly talk with one another about course concepts. | I guide students through major topics as they listen and take notes. | I use student assessment results to guide the direction of my instruction during the semester. | I design activities that connect course content to my students’ lives and future work. | I adjust student scores (e.g., curve) when necessary to reflect a proper distribution of grades. |
We generated the 5F model using our original conceptual framework; we then refined and confirmed the model through structural equation modeling. We originally had four a priori conceptual categories. However, since the four-factor CFA would have required removal of items of interest, we found we could maintain better model fit statistics if we split the assessment factor into two factors, formative assessment (five items) and summative assessment (four items). After confirming that the 5F model had good model fit statistics in the CFA, we renamed the constructs in the model to match their respective items. Factors in the 5F model include 1) student–student interactions, six items; 2) content delivery, four items; 3) formative assessment, five items; 4) student–content engagement, five items; and 5) summative assessment, four items.
Scoring Option B: The 2F Scoring Option.
A more simplified scoring option for the PIPS is a 2F scoring option; this option includes one factor that describes “student-centered practice” (15 items) and another that describes “instructor-centered practice” (nine items). We selected the 2F model through EFA using a maximum-likelihood method extraction and promax with Kaiser normalization rotation. We extracted the data into sequentially more complex models (i.e., a one-factor model, then two-factor, then three-factor, etc.). Our goal was to find the simplest model supported by acceptable model fit statistics that also was supported by qualitatively logical item groupings. We present reliability scores, model fit statistics, and items by factor for the 2F model in Table 4. We operationally define each PIPS factor, including those from both the 2F and 5F models, in Table 5. We include factor loadings for the items in the 2F model and the CFA map to support the 5F model as Supplemental Material.
| Factor 1: Student-centered practice | Factor 2: Instructor-centered practice | |
|---|---|---|
| Reliability (α) | 0.877 | 0.677 |
| Number of items | 15 | 9 |
| Eigenvalue | 5.774 | 3.285 |
| Percent variance explained | 24.059 | 13.686 |
| Items | P02, P04, P06, P07, P08, P09, P10, P12, P13, P14, P15, P16, P18, P19, P20 | P01, P03, P05, P11, P17, P21, P22, P23, P24 |
| Maximum possible sum | 60 | 36 |
| Sample items | I structure class so that students regularly talk with one another about course concepts. | My class sessions are structured to give students a good set of notes. |
| I structure class so that students discuss the difficulties they have with this subject with other students. | I guide students through major topics as they listen and take notes. |
| Factor | Model | Operational definition |
|---|---|---|
| Instructor-centered practices | 2F | Practices in which the instructor is the sole or primary actor, including how the instructor presents information, design of summative assessments, and grading policies |
| Student-centered practices | 2F | Practices in which the students are the sole or key actor(s), including interactions among students in class, students’ active and constructive engagement with course content, and formative assessment practices |
| Student–student interactions | 5F | Practices that describe interactions among students in class |
| Content delivery | 5F | Practices that describe or influence how the instructor transmits information to the students |
| Student–content engagement | 5F | Actions in which students manipulate or generate learning materials or products beyond what was provided by the instructor (similar to active and constructive elements noted by Chi and Wylie, 2014) |
| Formative assessment | 5F | Actions to monitor student learning that provide feedback to the instructor to inform teaching and/or to students to inform their learning |
| Summative assessment | 5F | Actions for formal evaluation of student learning, including grading policies |
How to Calculate PIPS Scores
PIPS scores are calculated for each factor by calculating the proportion of possible points for that factor. This creates a weighted sum of the factors scaled to 100. This scoring convention was a deliberate choice, as we find it easier to compare weighted scores among factors than less comparable raw scores. Thus, to calculate a factor score from either PIPS model (2F or 5F), begin by adding scores for the items in that factor (see Tables 3 and 4 for items in a given factor). Continue by dividing by the maximum possible sum for that factor and then multiply by 100.
For example, calculate the content delivery score by first adding actual scores from items P01, P03, P05, and P11. Because each PIPS item can be rated as high as four (very descriptive of my teaching), and there are four items in this factor, the maximum possible sum for content delivery is 16. Divide the actual factor sum by the maximum possible sum and multiply by 100 to generate a factor score between 0 and 100.
Sample Score Calculation (for content delivery factor) | |||||
Step 1. Σ(P01, P03, P05, P11) = actual factor sum | |||||
Step 2. (actual factor sum/maximum possible sum); 16 = maximum possible sum | |||||
Step 3. (actual factor sum/maximum possible sum) × 100 = factor score | |||||
Each factor score can vary between 0 (not at all descriptive of my teaching) and 100 (very descriptive of my teaching). Individual factor scores can contribute to mean scores for groups of interest, for example, to make comparisons among departments, institutions, or demographic subgroups.
RQ2. What Are Some of the Emergent Patterns in the PIPS Data among the Four Surveyed Institutions and 72 Surveyed Departments?
This subsection includes discriminant outputs and analyses that document differences in institutional, department, and demographic groups of interest.
PIPS Histogram.
PIPS 2F and 5F scores can be represented on a frequency-based bar graph with each score along an axis (Figures 1 and 2). Both Figures 1 and 2 represent PIPS factor scores as a proportion of the maximum sum score for a given factor and how each value fits with the original scale for the PIPS from “not at all descriptive” (0) to “very descriptive” (100). These representations can be used to highlight significant differences in 2F and 5F scores for an individual instructor (as in Figure 1) or among groups of interest (in this case, among 2F scores for sampled institutions; Figure 2).
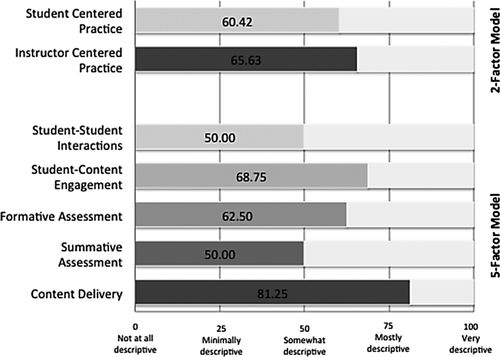
FIGURE 1. PIPS 2F and 5F scores for an individual instructor from Institution A.
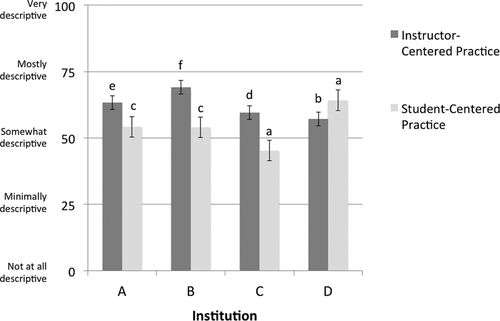
FIGURE 2. Institutional differences in mean PIPS 2F scores by institution. Significant differences based on post hoc Scheffé tests: (a) institutional mean significantly different from the other three institutions (p < 0.05); (b) institutional mean significantly lower than the two higher-scoring institutions (p < 0.05);(c) institutional mean significantly different from the highest- and lowest-scoring institutions (p < 0.05); (d) institutional mean significantly lower than the highest-scoring institution but not the other two institutions (p < 0.05); (e) institutional mean significantly higher than the lowest-scoring institution but not the other two institutions (p < 0.05); (f) institutional mean significantly higher than the two lowest-scoring institutions (p < 0.05).
PIPS Scatter Plot.
PIPS 2F scores can be placed on an x,y scatter plot based on the independent nature of the factors. On creation of the PIPS, we had no specific intention for the factors in the model to be orthogonal. Although we had autonomous categories in our conceptual framework, we expected that the final set of factors could be significantly related to one another. However, the independent nature of the student-centered and instructor-centered factors from the 2F model was supported by no significant correlation between the factors (r(703) = 0.026; p = 0.492) and consistent item loadings between EFA rotation methods; that is, the 2F item loadings for a varimax rotation (used for orthogonal data) are equivalent to the 2F item loadings on a promax rotation with Kaiser normalization (for oblique data).
In generating a scatter plot of the 2F scores, we find it helpful to place the crossing of the axes at the midpoint (50, 50). This generates a matrix of instructor-centered and student-centered practices with varying degrees of descriptiveness from 0 to 100 (Figures 3–5). In Figure 3, we present a scatter plot of 2F PIPS scores for instructors at Institution A (N = 152), highlighting individuals from case study departments. Figure 4 is another 2F scatter plot of individual instructors, but at Institution D (N = 424). Points on the scatter plot can also represent department means in instructor- and student-centered scores, as depicted in Figure 5.
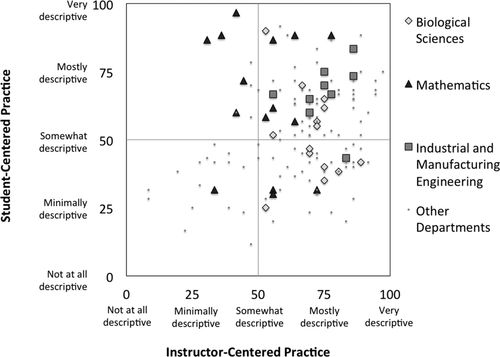
FIGURE 3. PIPS scores for instructors in the 19 sampled departments at Institution A (N = 152). Case study departments are identified.
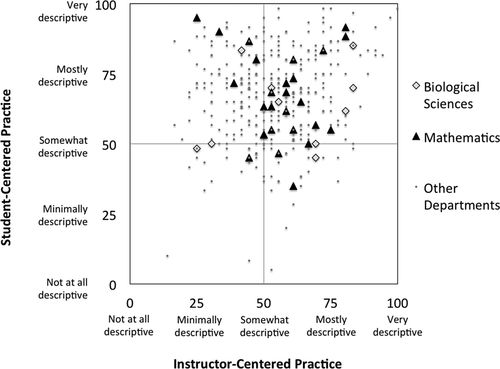
FIGURE 4. PIPS scores from instructors in the 40 sampled departments at Institution D (N = 424). Where applicable, departments with similar classification as those selected for case study at Institution A are identified.
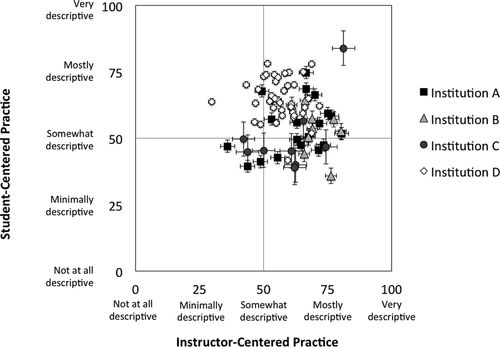
FIGURE 5. Mean department PIPS scores for 72 departments at the four sampled institutions, including SE bars for each department.
Exploring Demographic Differences.
We explore demographic differences generated by the PIPS as evidence of specific predictive validity, not necessarily as a set of generalizable findings. We completed independent t tests and ANOVA comparisons to explore demographic differences between and among PIPS scores for different instructor groups. We found significant differences in 2F PIPS scores between several demographic groups and report these differences in Figure 6. Significant differences include 2F PIPS scores between genders (n = 155 female; n = 141 male), between graduate student instructors (n = 93) and faculty (n = 798), and between STEM (n = 473) and non-STEM (n = 418) faculty (Figure 6). We also found significant differences in 2F PIPS scores among faculty of differing academic rank. In Figure 7, we compare significant differences among these scores for full (n = 178), associate (n = 156), and assistant (n = 110) professors and adjunct (n = 137) and full-time, non tenure-track (n = 95) instructors. ANOVA also revealed student-centered practice (2F) scores were significantly different among ethnic groups (p = 0.043), but post hoc tests did not confirm these differences. Other means from the 2F and 5F models likewise were not significantly different among ethnic groups.
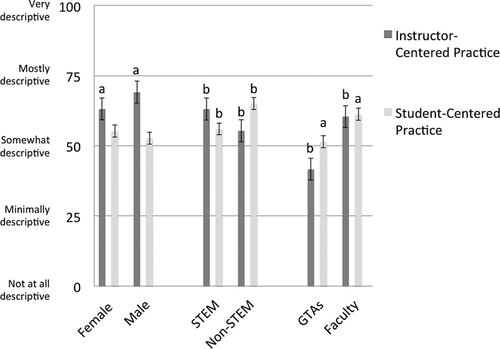
FIGURE 6. Demographic group differences in PIPS factor scores for instructor-centered practice and student-centered practice, as generated by the 2F PIPS model. GTAs, graduate teaching assistants. (a) Mean score significantly different from respective group (p < 0.01); (b) mean score significantly different from respective group (p < 1E-9).
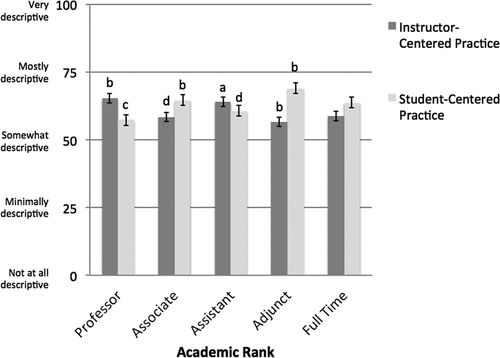
FIGURE 7. Academic rank differences in instructor-centered and student-centered practice mean scores, as generated by the 2F PIPS model. (a) Mean score significantly higher than the lowest-scoring group (p < 0.05); (b) mean score significantly higher than the two lowest-scoring groups (p < 0.05); (c) mean score significantly lower than the two highest-scoring groups (p < 0.05); (d) mean score significantly lower than the highest-scoring group (p < 0.05).
We also conducted correlational analyses to examine the 2F and 5F PIPS factors relationships to class size (n = 303; mean 95.2 ± 98.8 students), years teaching (n = 343; mean 16.6 ± 11.6 yr), and years at the institution (n = 343; mean 12.8 ± 10.4 yr). We report these correlations in Table 6. We also report correlations among 2F and 5F PIPS scores and self-reported proportions of time spent in lecture, doing small group work, providing individualized instruction, or doing other forms of instruction (Table 7).
| Class size | Years teaching | Years at institution | |
|---|---|---|---|
| 2F PIPS model | |||
| Instructor-centered practice | 0.098 | 0.187** | 0.163** |
| Student-centered practice | –0.095 | 0.059 | 0.049 |
| 5F PIPS model | |||
| Content delivery | 0.131* | 0.106 | 0.111 |
| Summative assessment | 0.137* | 0.141* | 0.123* |
| Student–student interactions | –0.122* | 0.027 | 0.023 |
| Student–content engagement | –0.081 | 0.116 | 0.094 |
| Formative assessment | 0.034 | –0.049 | –0.093 |
| Class size | 1 | 0.051 | 0.011 |
| Years teaching | 1 | 0.864** | |
| Years at institution | 1 | ||
| Instructor-centered practice | Student-centered practice | Estimated % lecture | Estimated % small group | Estimated % individual instruction | Estimated % other instruction | |
|---|---|---|---|---|---|---|
| Instructor-centered practice | 1 | 0.026 | 0.318** | −0.360** | −0.051 | −0.064 |
| Student-centered practice | 1 | −0.409** | 0.258** | 0.206** | 0.275** |
Finally, on the basis of the significant correlation between class size and PIPS scores, we compare PIPS scores by discipline but controlled for class size. We found that STEM instructors describe the content delivery (5F), summative assessment (5F), and instructor-centered practice (2F) factors as significantly more descriptive of their instruction than non-STEM instructors (p < 0.05). In contrast, when controlling for class size, mean PIPS scores of STEM instructors do not significantly differ from non-STEM instructors for the student–student interactions (5F), formative assessment (5F), or student-centered practice (2F) factors (p > 0.05).
DISCUSSION
Valid and reliable measurement of instructional practices in higher education settings allows researchers, administrators, and other interested parties to plan for and evaluate reform initiatives (AAAS, 2013). The PIPS can differentiate among coarse- and fine-grained elements of the instructional practices of postsecondary instructors from any discipline. Furthermore, the PIPS is valid, reliable, and easy to score and can quickly collect data from a large number of participants.
Interpreting PIPS Outputs
Although information available through individual PIPS responses may be helpful for a single instructor, our study identifies institutional and departmental clusters in instructional practices (Figures 3–5). These clusters support the notion that instructional practices are normative at both the institution and department level. Because instructional change is more successful when emergent from a group (Henderson et al., 2011) and the PIPS can identify institutional and departmental instructional practice clusters, we see longitudinal shifts in PIPS data for a group to be especially useful in measuring the success of change initiatives. Further, identifying clusters in results by department and institution supports the discriminant ability of the PIPS and highlights its usefulness as a measurement tool.
Demographic Differences
The primary purpose of this paper was to highlight the development and validation of the PIPS. We are providing demographic findings to illustrate specific predictive validity, document the discriminant ability of the PIPS, explore potentially useful data presentations, and situate our results in the greater body of literature. Consistency of PIPS scores with prior literature supports the validity of the PIPS and its usefulness as a measurement tool. We also identify a few results that are different from other measures in the field, which present both opportunity for further exploration or potential domains in which the PIPS has less discriminant ability. However, since our goal was development and validation, we leave demographic a priori hypotheses for future work.
By Class Size.
Faculty often mention class size as a barrier to incorporating research-based instructional strategies (Walczyk and Ramsey, 2003; MacDonald et al., 2005; Dancy and Henderson, 2007). We likewise note that class size had a significant positive correlation with traditional teaching practices as described by the items in the content delivery (r = 0.131; p < 0.05) and summative assessment (r = 0.137; p < 0.05) factors. We also found significant negative correlation with class size and student–student interactions (r = −0.122; p < 0.05). Henderson et al. (2012) likewise found a negative correlation between class size and student-centered pedagogies.
By Discipline.
We found significant differences between STEM (n = 438) and non-STEM (n = 389) instructors across several PIPS factors. Instructors from non-STEM disciplines were significantly more likely than STEM instructors to describe student-centered practice (2F) as descriptive of their teaching (p = 2.35 E-9). Similarly, STEM instructors were significantly more likely to describe instructor-centered practice (2F) as descriptive of their teaching (p = 3.67 E-10). This is consistent with the finding that lecture-based pedagogies are more prevalent among STEM instructors than among instructors from other disciplines (e.g., Hurtado et al., 2011).
Our findings differ somewhat when controlling for class size. We support the conclusion that STEM instructors have significantly higher scores than non-STEM instructors in instructor-centered practice (2F), content delivery (5F), and summative assessment (5F) factors (p < 0.05). In contrast, STEM instructors from our sample did not have significantly different scores than non-STEM instructors for student-centered practice (2F), student–student interactions (5F), and formative assessment (5F) when we controlled for class size (p > 0.05). This suggests that student-centered practices are more mediated by class size (e.g., Walczyk and Ramsey, 2003) than by the nature of the content.
By Gender.
Instructor-centered practices (2F) were significantly more descriptive of male instructors than female instructors (p < 0.01). This factor includes statements such as “students listening and taking notes” and “teaching with the assumption that students have little incoming knowledge.” Similarly, the content delivery (5F) and summative assessment (5F) factors were significantly more descriptive of male instructors than female instructors (p < 0.05). Henderson et al. (2012) and Kuh et al. (2004) likewise found women using fewer instructional practices of this nature. In contrast, we did not identify gender differences for factors that describe more research-based instructional strategies. Mean scores for student-centered practice (2F), student–student interactions (5F), student–content engagement (5F), and formative assessment (5F) were not significantly different by gender.
By Years Teaching.
More senior faculty are often thought to be less innovative than younger faculty (Hativa, 2000; Kuh et al., 2004). However, when controlling for other study variables, Henderson et al. (2012) did not find a correlation to teaching practices and years teaching. We note years teaching was significantly correlated (p < 0.05) with some of our factors, including instructor-centered practice (2F), content delivery (5F), and summative assessment (5F). However, we also note that years teaching was not significantly correlated with student-centered practice (2F), nor were years teaching correlated to student–student interactions (5F), student–content engagement (5F), and formative assessment (5F).
Utility of PIPS Scatter Plots
One question that arises with the use of the PIPS scatter plots is whether it is meaningful to be in different quadrants. We do not know if the quadrants represent distinct populations of instructors. When interpreting the scatter plots, it is important to remember that the 0–100 scale is not a proportion of class time but how descriptive a given factor is for the respondent. For example, it is possible for instructors to describe both instructor-centered practices and student-centered practices as somewhat (50) to very descriptive (100) of their teaching, placing them in the upper right quadrant.
We find the quadrants helpful for highlighting institutional and departmental differences, as in Figures 3 and 4. We suspect that there may be meaningful differences among the quadrants but are unable verify this suspicion in the current study. We also see the quadrants as helpful in documenting the face validity of the PIPS, that is, most instructors surveyed are able to find PIPS items they feel represent their instructional practices. This is confirmed by a low number of individuals in the lower left quadrant of the multi-institutional scatter plot (48 of 687 respondents).
Implications for Policy
It is important for researchers, institutions, and policy makers to have a valid and reliable instrument that can describe a range of traditional and research-based teaching practices across instructors from multiple departments. This can be useful, for example, to identify outlier departments (positive deviants that can be learned from) or to document the results of change initiatives longitudinally.
Future Work
One of our next steps will be to triangulate the results of the PIPS with teaching observation data collected using the TDOP (Hora et al., 2012) and interviews with instructors. These observations will provide additional support for our constructs and help to identify what, if anything, is lost in using the PIPS over a more resource-intensive observation. We expect to see reasonable alignment of instructional practices reported by the PIPS with those observed by the TDOP, especially since the TDOP was used as a reference for developing PIPS items. Future work will also include exploring other indicators of reliability for the PIPS, including split-halves and test–retest reliability.
Access to the Instrument
The PIPS is available in its paper form as Supplemental Material. Users are also welcome to contact the authors for use of the PIPS in its Qualtrics form. If you use the PIPS, we request that you use it in its entirety and share the data with our research team. We also suggest that you consider using the PIPS with its companion instrument, the authors’ Climate Survey (Walter et al., 2015). This will help us to improve both instruments and contribute to an improved research-based understanding of how elements of the academic workplace influence instructional practices.


