Representing Variability: The Case of Life Cycle Diagrams
Abstract
Two foundational concepts in biology education are 1) offspring are not identical to their parents, and 2) organisms undergo changes throughout their lives. These concepts are included in both international and U.S. curricular standards. Research in psychology has shown that children often have difficulty understanding these concepts, as they are inconsistent with their intuitive theories of the biological world. Additionally, prior research suggests that diagrams are commonly used in instruction and that their features influence student learning. Given this prior work, we explored the characteristics of life cycle diagrams and discuss possible implications for student learning. We examined 75 life cycle diagrams from books, including five biology or general science textbooks and 25 specialized trade books focusing on biology for children. We also examined 633 life cycle diagrams from a publicly available online database of science diagrams. Most diagrams failed to show any within-species variability. Additionally, many diagrams had perceptually rich backgrounds, which prior research suggests might hinder learning. We discuss how the design characteristics of diagrams may reinforce students’ intuitive theories of biology, which might make it difficult for students to understand key biological concepts in the future.
INTRODUCTION
Not all organisms of a particular species are identical. This claim appears simple at face value, but its consequences are far-reaching. It is this variation within a species that paves the way for evolution through natural selection. Indeed, variation is such a fundamental concept in biology that some science education scholars have deemed it a threshold concept—that is, a concept that, once understood, shifts students’ reasoning and allows them to understand other, more complex concepts (Batzli et al., 2016; Walck-Shannon et al., 2019). International standards for life science education also include variability as a key concept for students to understand (Trends in International Mathematics and Science Study 2015 Science Framework; Jones et al., 2015).
Despite its importance, within-species variability can be difficult for young children and even adults to understand (Shtulman and Schulz, 2008; Emmons and Kelemen, 2015). Psychological research has suggested that within-species variability can be difficult to understand, because it violates people’s biases about how categories work (Gelman and Rhodes, 2012). In this study, we examined how curricular materials display the concept of biological variability and whether these depictions might align with cognitive biases. If curricular materials align with different cognitive biases, these materials might make it more difficult for students to understand variability later on.
Cognitive Biases
Developmental and educational psychologists alike have proposed that students’ understanding of biology is constrained by different biases (Kelemen, 2012; Shtulman et al., 2016; Coley et al., 2017). These cognitive biases constrain what students think is possible and shape their naïve conceptions of how the biological world works. These naïve conceptions are organized into what some scholars call an intuitive theory of biology (Wellman and Gelman, 1992). This theory is considered “intuitive,” because it is based on personal experience and not on scientific evidence. Although researchers have investigated many biases that influence reasoning in biology (Coley et al., 2017; Arenson and Coley, 2018), with respect to within-species variability, psychological essentialism is of particular importance.
Psychological essentialism is the idea that people act as though categories have an underlying substance (i.e., an essence) that determines the characteristics and properties of a category (Medin and Ortony, 1989; Gelman, 2003, 2004). Because people assume all organisms in a category have the same underlying substance and that substance gives rise to the typical characteristics of the category, people often think all members of the category are homogeneous (Gelman and Rhodes, 2012). Adults often think of this substance as being an organism’s genes (Heine et al., 2017). Essentialist reasoning leads people to think of animal species as stable and distinct categories that are dictated by nature (Gelman and Rhodes, 2012).
Some studies have found that essentialist reasoning is related to misunderstandings in biology (Rosengren et al., 2012; Emmons et al., 2016; Shtulman and Harrington, 2016; French et al., 2018). For example, essentialist reasoning leads people to believe that categories do not change over time, leading some researchers to propose that essentialism may impede learning about evolution (Gelman and Rhodes, 2012; Evans and Rosengren, 2018). Essentialist reasoning can also influence people’s reasoning about biological variability, because one consequence of essentialist reasoning is assuming that members of a category are more similar than they actually are. This reasoning may lead people to ignore perceptual differences among members of the same species, and thus to underestimate within-species variability (Shtulman and Schulz, 2008; Emmons and Kelemen, 2015).
Essentialist reasoning may also influence students’ learning about other biological topics, such as the life cycle. French et al. (2018) found that people often extend the assumption that all members of a category will look alike to parents and offspring. People tend to believe that offspring will have features identical to their parents and that the features of organisms stay the same throughout their lives. French et al. (2018) called this assumption the featural stability bias, and they found that it was stronger when people reasoned about unfamiliar species.
Of course, all animals display changes in features throughout their lives, given that there are developmental changes in the proportions of features (Lorenz, 1971). However, the featural stability assumption is very strongly violated by organisms that go through metamorphosis. French et al. (2018) argued that the featural stability bias hinders people’s understanding of metamorphosis. This may explain why even adults often fail to endorse metamorphosis as an appropriate biological change for some organisms, and sometimes view juveniles and adults of the same species as belonging to different species (Rosengren et al., 1991; Menendez et al., 2018, 2020).
Thus, there is considerable evidence that psychological essentialism hinders correct biological reasoning (Shtulman and Schulz, 2008; Shtulman and Calabi, 2013; Emmons and Kelemen, 2015), and that this bias is present early in development (Gelman, 2004; French et al., 2018). In the current study, we sought to investigate whether one element of curricular materials for biology education, namely, the visual representations (e.g., diagrams, illustrations, or photographs) used in instruction about the life cycle, depicts biological variability. If visualizations fail to depict biological variability, it might explain why this concept is challenging for students of all ages to grasp. Additionally, these visualizations might also have features that promote or convey an essentialist model of biology. If this is the case, it might explain why greater biological knowledge does not seem to reduce essentialist reasoning in students (Coley et al., 2017). However, there is not much research on how visualizations promote essentialist reasoning. Therefore, we examine the literature on how visual representations influence learning, and we speculate on how these features might be related to essentialist reasoning.
Features of Diagrams
Diagrams and other visual representations are commonly used in curricular materials (Woodward, 1993). Generally, lessons with diagrams or other visual representations that are relevant to a topic lead to better learning than lessons with no visual displays (Mayer, 2009). Additionally, it is often recommended that teachers and instructors include visual representations in their teaching (National Research Council, 2006; Davidesco and Milne, 2019). However, not all visualizations are equally beneficial. The way in which the information is displayed in a diagram influences what students can learn from it. When considering the effectiveness of diagrams in instructional settings, we focus on three characteristics that the psychological literature suggests might be important for student learning: perceptual richness, spatial arrangement, and the specific information that is depicted.
Perceptual Richness.
Perceptual richness refers to the amount of perceptual information available for learners to process. Perceptual richness can be operationalized in terms of the number of visual features or details that are contained in the visual representation. See, for example, Figure 1. Both diagrams display comparable information, but the one on the right is more perceptually rich, because it includes visual details such as color, pattern (spots), and shading that learners may process and encode. Perceptually rich diagrams are sometimes described as being more concrete, and perceptually bland (or sparse) diagrams are sometimes described as being more abstract. In Figure 1, the perceptually rich diagram is clearly recognizable as a ladybug, whereas the perceptually bland line drawing might be said to depict a “generic” beetle.

FIGURE 1. A perceptually bland (left) and perceptually rich (right) representation of the life cycle of a ladybug. Figures available at https://osf.io/hfg38 under a CC-BY4.0 license (Menendez, 2019).
Studies in a variety of domains suggest that perceptually rich diagrams lead to less generalization than perceptually bland diagrams (Goldstone and Sakamoto, 2003; Kaminski et al., 2008; Fyfe et al., 2015). However, one study suggests that perceptual details can be beneficial if the details are relevant to the content being learned (Siler and Willows, 2014).
Perceptual richness may be especially important in visual representations in biology, such as the ones in Figure 1, because perceptual features are often relevant to identifying organisms, biological structures, or features of environments. Still, Menendez et al. (2020) found that adults generalized more after a lesson on metamorphosis if they saw a bland diagram than if they saw a rich diagram. Prior work therefore suggests that having rich details that are irrelevant, for example in the background, can decrease learning. Rich details in the focal organism could be beneficial, but at least for adults, they are also detrimental.
There has been no work on how perceptual richness influences essentialist reasoning. However, it may be that bland diagrams might lead to better learning, because they encourage students to focus on the deeper structure of the category rather than on the exact organism being depicted (Menendez et al., 2020). By omitting superficial features, bland diagrams may promote students’ focus on the underlying structure of the category, and thereby promote generalization.
Spatial Arrangement.
Spatial arrangement refers to how the elements in a diagram are arranged within the diagram, in terms of both their locations and their positions relative to the other elements contained in the visualization. The spatial arrangement of information in visual representations can also contribute to learners’ understanding of relationships, such as temporal sequence or cause and effect (Mayer and Moreno, 2003). For example, events that happen closer in time may be placed in closer proximity on a timeline.
Much of the research on the spatial arrangement of information has been in mathematics (Landy and Goldstone, 2007; Marghetis et al., 2016). For example, the spatial positioning of elements in algebraic expressions and equations can influence students’ strategies and errors (e.g., Landy and Goldstone, 2007; Jiang et al., 2014), and the spatial positioning of numbers affects people’s reaction times and errors in magnitude comparison (Pletzer et al., 2016). Different spatial arrangements of biological information, like the ones in Figure 2, might have implications for students’ reasoning. Some spatial configurations better support students in making correct inferences about the information being represented. For example, Novick et al. (2011) found that students were more likely to correctly interpret a cladogram if it was arranged as a tree rather than as a ladder.

FIGURE 2. Examples of circular (left) and linear (right) life cycle diagrams found in the AI2D data set (Kembhavi et al., 2016).
In terms of thinking about the life cycle, some research suggests that adults across cultures think of life span changes as occurring in a linear manner (Tversky, 2011). When asked to draw the life cycle of a plant, people tend to draw linear diagrams (Jamalian and Tversky, 2012; Tversky, 2011, pp. 521–522). This finding suggests that students might think of life cycles as linear processes unfolding over time. There is no research on whether the spatial organization of life cycle diagrams influences how people think of these processes, but some work suggests that seeing circular hand gestures promotes circular thinking about life cycle processes (Jamalian and Tversky, 2012). Although currently there are no strong data suggesting that a circular or a linear organization of life cycle diagrams is more beneficial for student learning, it is worth examining the spatial organization of diagrams available to students.
Additionally, an interesting feature of circular diagrams is that they sometimes include an arrow from the adult form to the juvenile form, creating a closed loop. In these closed loops, it is difficult to depict that the offspring might not look exactly like the parent when the offspring grows up. Although there are no data on the effects of closed life cycle diagrams, such diagrams might promote an essentialist model in which species do not change over generations. In this study, we examine the prevalence of these closed diagrams. If their prevalence is low, they might not have a real impact on students.
Information Depicted.
The specific information that is depicted or highlighted within a visual representation influences where learners focus their attention and ultimately what they take away from the representation. Differences in the information depicted in visual representations can lead students to construct different understandings (Rau, 2017).
Of particular interest for the current study is how diagrams depict or highlight variability. A diagram might depict biological variability by showing how offspring differ from their parents, how siblings differ from one another, or how a target animal differs from other organisms in its community. Furthermore, highlighting variability need not be the primary purpose of the diagram, but variability could still be depicted. For example, the primary purpose of life cycle diagrams is to show the different life stages of an organism. However, as can be seen in Figure 3, these diagrams can display variability by having multiple organisms at each stage that look different from one another. Displaying variability, even as a secondary concept, might make students more open to this idea when it is formally explained in instruction.

FIGURE 3. Examples of life cycle diagrams that 0, 1, 2, or 3 sources of variability found in the AI2D data set (Kembhavi et al., 2016). The leftmost panel shows a diagram that depicts no forms of variability (aside from life cycle variability). The second panel shows a diagram that depicts one form of variability (multiple generations). The third panel shows a diagram that depicts two forms of variability (more than one generation and more than one organism per stage). The fourth panel shows a diagram with all three forms of variability.
There is little work examining the impact of depicting variability on student outcomes. Presenting children with visual representations that depict variability (combined with verbal descriptions that highlight this variability) seems to increase how much they attend to variability later on (Rhodes and Brickman, 2010). Additionally, making parents and offspring look different in life cycle diagrams does not hinder adults’ learning about life cycle changes, although it also does not enhance it (Menendez et al., 2018). Given that there are few data on this topic, examining diagrams should give us a sense of whether students are often presented with examples of biological variability, or whether these instances are rare.
What Do We Know about Diagrams in Biology Books?
There is relatively little research on the use of diagrams in biology classrooms and curricular materials. Some of the existing research has characterized the content and form of visualizations in biology textbooks. As an example, Wiley et al. (2017) reported that the majority of visual representations contained in middle school biology textbooks simply depicted individual organisms. They also found that images in textbooks became increasingly abstract as grade level increased. Some of this research highlights that many of the visualizations could be improved. For example, Angra and Gardner (2018) found that a large proportion of graphs in introductory biology college textbooks were missing key information (such as axis labels) or needed improvements in order to effectively communicate the educational material. Catley and Novick (2008) found that many cladograms depicted common misconceptions, such as anagenesis or the notion of human exceptionalism. Therefore, it seems that visual representations in biology textbooks sometimes use spatial arrangements that can confuse students, and they sometimes depict misconceptions or lack important information.
Why Examine Life Cycle Diagrams?
In this research, we focus on one specific type of visual representation used in biology: life cycle diagrams. We focus on life cycle diagrams, because they can be found across many grade levels and because lessons on the life cycles of animals are present as early as elementary school (Shepardson, 2002; Herrmann et al., 2013; Next Generation Science Standards, 2013). Additionally, these diagrams are an interesting case for thinking about biological variability. On one hand, these diagrams depict that juvenile and adult animals look different from one another, a form of within-species variability. They can also depict mechanisms, like sexual reproduction, that lead to other forms of within-species variability. On the other hand, circular life cycle diagrams might not be desirable, because they might lead students to think that organisms have offspring that look exactly the same as the parents, leading to an expectation of no differences between parents and offspring.
Current Study
In this descriptive study, we examine the characteristics of life cycle diagrams available in science textbooks, trade books, and online. By analyzing the diagrams that students typically encounter, we can characterize students’ environments and gain insight into what students might encounter during biology instruction. We did not expect diagrams found in books and diagrams found online to differ; however, we report on them separately to honor the fact that our process for collecting the diagrams was different. We aim to survey the life cycle diagrams that students might be exposed to. We examined not only the information that is typically depicted in these diagrams but also the features, such as perceptual richness and spatial arrangement, that prior research on learning and instruction suggest could influence student learning. We also paid particular attention to the types of biological variability that were depicted in these diagrams. Our hope is that this research serves to spark new avenues of research for both psychology and biology education. To accomplish this goal, we coded general characteristics of the diagrams, as well as their perceptual richness, spatial arrangement, and depictions of variability.
We coded some additional features of diagrams to gain a sense of the information that is typically depicted in life cycle diagrams. These included general aspects of the diagrams’ content, such as the biological order of the organism(s) depicted. We also coded for explicit depictions of sexual reproduction or death, which could be present or omitted when depicting the life stages of an organism. We also coded whether the diagrams depicted metamorphosis, because many of the previous studies that have looked at the effects of features of life cycle diagrams on learning and generalization have focused on students’ understanding of metamorphosis (Menendez et al., 2018, 2019, 2020).
Given research on how perceptual richness influences learning (Butcher, 2006; Kaminski et al., 2008; Mayer et al., 2008), we examined the perceptual richness of each diagram. We examined the richness of the organism being depicted and the richness of the background separately. We made this distinction, because the richness of the depiction of the organism might be relevant to the life cycle, whereas rich detail of the background is more likely to be irrelevant. Prior research suggests that including only relevant details could be beneficial (Siler and Willows, 2014; but see also Menendez et al., 2020).
We also coded the spatial arrangement of the life cycle diagrams. Although there is some research suggesting that the spatial arrangement of diagram elements influences reasoning in biology (Novick et al., 2011), spatial arrangement has not been studied in life cycle diagrams. Given work that suggest that adults typically think of the life cycle in a linear way, but that they can be pushed to think of it in a circular way, we examined the prevalence of these two spatial arrangements in life cycle diagrams. We also assessed whether each diagram was closed, in the sense that it included an arrow going from the final stage back to the first stage, or open. We coded for this feature, because closed diagrams could reinforce essentialist reasoning, as they suggest that the adults will have offspring that look identical to them. Although we do not test this claim in this study, we wanted to see whether closed life cycle diagrams were common.
Finally, we also assessed whether the diagrams depicted biological variability. Variability within a population or species is essential for natural selection to operate; therefore, we focused on features that were relevant to thinking about variability within species. Toward this end, we coded whether the diagrams depicted multiple generations of the organism and whether they depicted multiple organisms of the same species.
Some recent research suggests that understanding between-species variability may also be relevant to understanding evolution. Specifically, Menendez et al. (2019) found that third-grade children who received a brief lesson about between-species variability (i.e., about differences between monarch and black swallowtail butterflies) were more likely to provide evolutionarily appropriate explanations of the origin of species than children in a control condition that did not focus on between-species variability. In light of these findings, we also coded whether diagrams depicted between-species variability by depicting organisms of multiple species.
METHODS
Diagrams
We collected life cycle diagrams from three sources: 1) high school and college biology textbooks (n = 5 books), 2) trade books intended to teach children about specific topics (n = 25 books), and 3) the AI2D data set (Kembhavi et al., 2016).
We obtained the textbooks and trade books from the science section of a teacher resources library in a school of education at a large midwestern university. The textbooks were intended for high school and college students (see Appendix A in the Supplemental Material). We extracted 36 life cycle diagrams from these five books. The trade books were intended for younger audiences (see Appendix A in the Supplemental Material). We extracted 39 life cycle diagrams from these 25 books (10 trade books did not contain any life cycle diagrams). In total, we obtained 75 diagrams from books.
AI2D is a publicly available, online data set containing more than 5000 diagrams representing topics from elementary school science. The images in this data set were collected by the data set curators by scraping Google Images with chapter titles in grades 1–6 science textbooks as search terms. We extracted a total of 633 life cycle diagrams from the AI2D database.
Codes
We coded each life cycle diagram using four categories: general content, perceptual richness, spatial arrangement, and depictions of variability. Each of the three characteristic categories was evaluated using multiple codes, which we describe in detail in the following sections.
General Content.
Codes in this category were designed to characterize the information shown in the diagrams. There were four codes in this category: organism order, metamorphosis, sexual reproduction, and death.
Organism Order.
We identified the biological order of the organism whose life cycle was being depicted. Some diagrams were too vague to determine the biological order of the organism depicted. We coded these diagrams as “N/A.” We included depictions of viruses in our analyses, even though they are not part of any kingdom.
Metamorphosis.
We coded whether the diagram depicted metamorphosis. Diagrams that showed either complete or incomplete metamorphosis received a 1, and diagrams that did not depict metamorphosis received a 0. Examples of diagrams that depicted metamorphosis can be seen in Appendix B in the Supplemental Material.
Sexual Reproduction.
We coded whether the diagram explicitly depicted sexual reproduction. Diagrams had to show (with either words or images) mating or fertilization to receive a score of 1. Otherwise, they received a score of 0. Simply connecting an adult organism to a zygote with a line was not judged as sufficient to receive a 1. Examples of diagrams that depicted sexual reproduction can be seen in Appendix B in the Supplemental Material.
Death.
We coded whether the death of the organism was explicitly depicted. Diagrams that showed (with words or images) that the organism died received a code of 1. A sample diagram that depicted death can be seen in Appendix B in the Supplemental Material.
Perceptual Richness.
The codes in this category attempted to categorize how much perceptual information (i.e., how many details) each diagram contained. This category includes three independent subcodes: organism richness, background richness, and only labels.
Organism Richness.
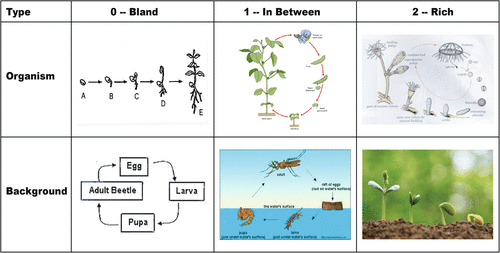
We rated the level of detail in the depictions of the organism in the diagram. We rated their richness on a three-point scale from 0 (perceptually bland) to 2 (perceptually rich). Diagrams coded as 0 were typically silhouettes or outlined black-and-white images with very few details. Diagrams coded as 2 were typically photographs or hyperrealistic drawings with very rich details in their portrayal of organisms. Diagrams coded as 1 were in between these two extremes. See Table 1 for examples of each code.
 |
Background Richness.
We rated how detailed the background of the diagram was. We rated richness on a three-point scale from 0 (perceptually bland) to 2 (perceptually rich). Diagrams were coded as 0 when they had no extra features and noncolored backgrounds. Diagrams coded as 2 had many, highly detailed, colored peripheral features. Diagrams coded as 1 were in between these two extremes. See Table 1 for examples of each code.
Only Labels.
We coded whether the diagram contained only labels (i.e., no picture or drawing of the organism). Diagrams were coded as 1 if they had only labels, and 0 if they had any other depiction of the organism. Additionally, all the diagrams that received a 1 for this code also received a 0 for organism richness. See Table 1 (column 0 in the “Background” row) for an example.
Spatial Arrangement.
The codes in this category attempted to capture how the different life stages were arranged in space and how arrows were used to connect these stages. There were two types of codes in this category: shape and closedness.
Shape.
To examine how the stages were arranged in space, we coded the shape they formed. There were three possible shapes: linear (the stages were arranged in a line), circular (the stages were arranged in a way that resembled a circle or oval), and other (the stages were arranged in some other spatial configuration). In four-stage diagrams, the same spatial configuration of the stage could form a circle or a square (depending on the straightness of the lines). Given that this code described where the stages were on the diagram, we coded such diagrams as circular if a circle could connect all of the stages. Examples of circular and linear life cycle diagrams are shown in Figure 2.
Closedness.
We also examined the use of arrows to connect the stages. In particular, we coded whether diagrams were “closed” or “open.” A closed diagram contained an arrow that connected the adult stage back to an earlier stage in the cycle, creating a loop. An open diagram did not have this returning arrow. Examples of diagrams that received these codes can be seen in Appendix B in the Supplemental Material.
Depiction of Variability.
The codes in this category were designed to capture how the diagrams depicted biological variability. There were four different codes to assess this construct: number of generations, number of organisms per generation, number of zygotes, and number of different species. The first two codes characterized how the diagram depicted within-species variability. Representations of multiple generations or multiple organisms within one generation can be thought of as a way to highlight within-species variability. We used a separate code for number of zygotes, because diagrams often depicted multiple eggs or seeds, but depicted only one focal organism in each of the other stages. The number of different species was used to capture whether the diagram depicted between-species variability. Examples of diagrams that received each of these codes can be seen in Appendix B in the Supplemental Material.
Number of Generations.
We counted the number of generations shown in the diagram. For closed diagrams, we counted the number of loops they contained. For open diagrams, for the diagram to be coded as depicting more than one generation, the diagram needed to depict an arrow going from an adult to a new zygote. Examples of diagrams that received these codes can be seen in Appendix B in the Supplemental Material.
Number of Organisms per Generation.
We counted the highest number of organisms of the same species that were shown in at least half of the stages (i.e., the mode of the number of organisms). For example, a diagram that showed five stages and that depicted only one organism in four of the stages would receive a 1 (regardless of whether the other stage depicted more than one organism). When the number of organisms per stage was not consistent (i.e., there was no mode), we selected the highest number shown in a single stage. Any number higher than 5 was coded as “more than 5.” If the diagram included only labels, it was coded as only having one organism if the labels for each stage were singular. Examples of life cycle diagrams with one and two organisms per generation are presented in Appendix B in the Supplemental Material.
Number of Zygotes.
We counted the number of zygotes. Any number higher than 5 was coded as “more than 5.” If the diagram included only labels, it was coded as only having one organism if the label for the egg or seed was singular. Examples of these codes can be seen in Appendix B in the Supplemental Material.
Number of Different Types of Organisms.
We counted the number of distinct species present in the entire diagram. Any number higher than 5 was coded as “more than 5.” Examples of these codes can be seen in Appendix B in the Supplemental Material.
Composite Variability Score.
We created a composite variability score by tallying the number of indicators of biological variability in each diagram. Diagrams received 1 point if they depicted more than one generation, 1 point if they depicted more than one organism per generation, and 1 point if they depicted more than one species. This resulted in a composite score that varied between 0 and 3. A score of 0 indicates that the diagram did not display within- or between-species variability, and a score of 3 indicates that the diagram displayed both within- and between-species variability. See Figure 3 for an example.
Coding Procedure
Two trained coders independently coded all of the diagrams in the textbooks and trade books, as well as a random sample of 180 AI2D diagrams. Disagreements were resolved through discussion, and we used the agreed-upon codes for these diagrams. The coders then each coded 50% of the remaining AI2D diagrams.
Interrater Reliability
We calculated percent agreement and Cohen’s kappa on the sample of 255 double-coded diagrams. These values can be found in Table 2. Percent agreement values above 80% are typically considered acceptable. Kappa values above 0.4 represent fair agreement, and values above 0.6 represent substantial agreement (McHugh, 2012). Percent agreement was found to be acceptable for all codes; however, the kappa values were low for some of the codes. We examined the disagreements and found that there was a prevalence issue for some of the coding categories (particularly those for depictions of variability). For these codes (e.g., number of generations, number of animals per generation), some of the options were so rarely present that even a few disagreements led to low reliability as assessed by kappa. This prevalence issue accounts for why percent agreement was high, but kappa was low. We therefore calculated prevalence- and biased-adjusted kappa values (PABAK; Byrt et al., 1993; Sim and Wright, 2005). These adjusted kappas indicate adequate reliability for all our coding categories. We present the percent agreement, Cohen’s kappa, and PABAK values in Table 2. We did not calculate reliability for organism order.
| Code | Frequency books | Frequency online | % agreements | Cohen’s kappa | PABAK |
|---|---|---|---|---|---|
| General content | |||||
| Metamorphosis | 87.8% | 0.75 | 0.75 | ||
| 0 | 50 | 214 | |||
| 1 | 25 | 449 | |||
| Sexual reproduction | 92.7% | 0.68 | 0.85 | ||
| 0 | 42 | 607 | |||
| 1 | 33 | 56 | |||
| Death | 97.6% | 0.65 | 0.95 | ||
| 0 | 74 | 649 | |||
| 1 | 1 | 14 | |||
| Perceptual richness | |||||
| Organism richness | 85.8% | 0.72 | 0.71 | ||
| 0 | 5 | 78 | |||
| 1 | 7 | 226 | |||
| 2 | 63 | 328 | |||
| Background richness | 85.4% | 0.72 | 0.71 | ||
| 0 | 22 | 451 | |||
| 1 | 36 | 138 | |||
| 2 | 17 | 44 | |||
| Only labels | 99.2% | 0.95 | 0.98 | ||
| 0 | 71 | 604 | |||
| 1 | 4 | 59 | |||
| Spatial arrangement | |||||
| Closed | 97.6% | 0.92 | 0.95 | ||
| Open | 31 | 103 | |||
| Close | 44 | 530 | |||
| Shape | 98.4% | 0.95 | 0.97 | ||
| Linear | 31 | 102 | |||
| Circular | 44 | 531 | |||
| Depiction of variability | |||||
| Number of generations | 95.1% | 0.41 | 0.90 | ||
| One generation | 70 | 620 | |||
| More than one generation | 6 | 13 | |||
| Number of organisms per generation | 93.1% | 0.50 | 0.86 | ||
| One organism per generation | 67 | 604 | |||
| More than one organism per generation | 8 | 29 | |||
| Number of zygotes | 89.0% | 0.84 | 0.78 | ||
| No zygote | 19 | 64 | |||
| One zygote | 30 | 302 | |||
| More than one zygote | 26 | 267 | |||
| Number of different types of organisms | 96.3% | 0.74 | 0.95 | ||
| One type | 70 | 588 | |||
| More than one type | 5 | 75 |
RESULTS
Although we did not expect diagrams found in books (including both textbooks and trade books) and diagrams found online to differ, we present the results separately for these two samples of diagrams, given differences in how we obtained the samples.
Diagrams in Textbooks and Trade Books
General Characteristics.
Most often, the diagrams depicted animals (73%), with insects being the most common type of animal depicted (28% of all diagrams in books); see Table 3. Only one-third of the life cycle diagrams in books depicted metamorphosis (25 of the 75 diagrams). Twenty-three diagrams (31%) depicted sexual reproduction, and only one diagram depicted death; this diagram was for the life cycle of a fish.
| Organism kingdom/class | Overall | Percent of AI2D diagrams | Percent of book diagrams |
|---|---|---|---|
| Nonspecifica | 2.82% | 2.84% | 2.67% |
| Virusesb | 0.28% | 0.16% | 1.33% |
| Protista | 0.56% | 0.47% | 1.33% |
| Fungi | 1.84% | 1.26% | 6.67% |
| Plants | 14.12% | 14.06% | 14.67% |
| Animals | 80.37% | 81.20% | 73.33% |
| Insects | 64.41% | 68.72% | 28.00% |
| Amphibians | 4.80% | 4.11% | 10.67% |
| Scyphozoa (jellyfish) | 3.81% | 4.27% | 0.00% |
| Fish | 1.41% | 0.79% | 6.67% |
| Mammals | 1.41% | 0.47% | 9.33% |
| Chondrichthyes (sharks and rays) | 0.71% | 0.63% | 1.33% |
| Chromadorea (roundworms and nematodes) | 0.71% | 0.79% | 0.00% |
| Reptiles | 0.56% | 0.32% | 2.67% |
| Arachnids | 0.42% | 0.16% | 2.67% |
| Birds | 0.42% | 0.16% | 2.67% |
| Crustaceans | 0.42% | 0.32% | 1.33% |
| Trematoda (flukes) | 0.42% | 0.32% | 1.33% |
| Mollusks | 0.28% | 0.16% | 1.33% |
| Clitellata (earthworms) | 0.14% | 0.00% | 1.33% |
| Anthozoa (coral) | 0.14% | 0.00% | 1.33% |
| Ascidiacea (sea squirt) | 0.14% | 0.00% | 1.33% |
| Cestoda (tapeworms) | 0.14% | 0.00% | 1.33% |
Perceptual Richness.
In the large majority of diagrams in books, organisms were depicted with many perceptual details (63 of the 75 diagrams, 84%; see Figure 4, leftmost bar). There were only five diagrams that were coded as bland. Of these five, four diagrams contained only labels, with no visual depiction of the organism. There was only one diagram that was coded as using a perceptually bland visual representation of the organism. In the seven remaining diagrams, the organism was depicted in a way that was in between perceptually bland and rich.

FIGURE 4. Proportion of diagrams found in books (n = 75) and online (n = 633) that depicted organisms and backgrounds at each level of perceptual richness.
There was more variability in the perceptual richness of the diagrams’ backgrounds; see Figure 4, second bar from left). Twenty-two of the diagrams (29%) had bland backgrounds, with no color or other information. Seventeen of the diagrams (23%) had rich backgrounds, typically with detailed scenery (e.g., one diagram of the life cycle of a frog had a background that included photographs of the pond and the surrounding area, showed the tadpole swimming around some plants, and showed the frog on dry land). Thirty-six of the diagrams (48%) had a background that was classified as between bland and rich. The background in these diagrams was typically a solid color or included one detailed element on a solid white background.
Given that details on the organism are likely more relevant than details in the background, we wanted to see if the diagrams depicted the organisms or the background in a richer manner. To do so, we conducted a paired-samples t test comparing the richness scores for organisms and backgrounds. We excluded the diagrams that used only labels from this analysis. There was a significant difference in the average perceptual richness of backgrounds and organisms, t(70) = 10.82, p < 0.001. Organisms tended to be depicted more richly (M = 1.87, SD = 0.38) than backgrounds (M = 0.94, SD = 0.72). See Figure 4.
Spatial Arrangement.
The majority of life cycle diagrams in books were circular (44 of the 75 diagrams, 59%). We also examined whether the diagrams were open or closed. Diagram shape and closedness were perfectly correlated. All circular diagrams were closed, and all linear diagrams were open.
Depictions of Variability.
Life cycle diagrams could show within-species variability by depicting more than one generation or by depicting multiple organisms per stage. The large majority of the diagrams (70 of the 75 diagrams, 93%) in books depicted only one generation. Only five diagrams (7%) depicted more than one generation, and all of these diagrams showed a branching in the organism’s life (showing different possible paths the organism’s life cycle could follow). For example, one of these diagrams showed the life cycle of black bread mold. In one section, the diagram branched into two paths, one depicting sexual reproduction and the other depicting asexual reproduction.
The majority of diagrams also depicted only one organism per stage (67 of the 75 diagrams, 89%). Of the remaining diagrams, three diagrams depicted two organisms per stage (4%), two diagrams depicted four organisms per stage (3%), and three diagrams depicted five or more organisms per stage (4%). This suggests that at least a minority of diagrams explicitly depict within-species variability. A greater proportion of diagrams depicted multiple zygotes. Nineteen diagrams did not depict any zygotes (25%), 30 diagrams depicted one zygote (40%), and 26 depicted two or more zygotes (35%).
Diagrams could also depict biological variability by showing between-species variability. The large majority of the life cycle diagrams found in books (70 of the 75 diagram, 93%) depicted only one type of organism. Only one diagram (1%) showed two types of organisms, and four diagrams (5%) showed three types of organisms. Of these five diagrams that depicted multiple organisms, four focused on the life cycle of a parasite or virus. The additional organisms depicted were the host that the parasite or virus needed to survive and reproduce.
Finally, we examined the composite score for depictions of variability, which summed the number of indicators of biological variability for each diagram. These scores allowed us to evaluate whether many diagrams had at least one indicator of variability or whether a few diagrams depicted many different forms of variability. On average, diagrams depicted 0.24 forms of variability (SD = 0.57). We found that 61 diagrams (81% of total) depicted no variability, 11 diagrams (15%) depicted at least one form of variability, two diagrams (3%) depicted two forms of variability, and one diagram (1%) depicted three forms of variability. See Figure 5.

FIGURE 5. Proportion of diagrams found in books (n = 75) and online (n = 633) that depicted different numbers of sources of variability.
Online Diagrams from the AI2D Data Set
General Characteristics.
As with the books, the majority of life cycle diagrams from the AI2D data set depicted animals (81%), with insects being the most common type of animal depicted (69% of all online diagrams); see Table 3. The majority of the diagrams depicted metamorphosis (449 diagrams, 71%). Fifty-six diagrams (9%) depicted sexual reproduction, and 14 diagrams (2%) depicted death.
Perceptual Richness.
Relative to the diagrams contained in books, a smaller percentage of the diagrams in the AI2D data set were coded as having perceptually rich representations of the organisms (328 of the 633 diagrams, 52%), and a greater percentage were coded as having representations of the organisms that were between perceptually rich and bland (226 diagrams, 36%; see Figure 4, third bar from left). Seventy-eight diagrams (12%) were coded as having perceptually bland representations of the organism. Of these 78 perceptually bland diagrams, 59 contained only labels (9% of total diagrams) and 20 (3% of total diagrams) contained bland visual representations of the organisms.
A large majority of the online diagrams (451 of the 633 diagrams, 71%) had bland backgrounds; see Figure 4, rightmost bar. This proportion is much higher than what we observed for the diagrams in books. Forty-four of the diagrams (7%) had rich backgrounds. One hundred and thirty-eight of the diagrams (22%) had backgrounds that were classified as between bland and rich. As with the book diagrams, we conducted a paired-samples t test to examine whether diagrams depicted the organisms or the background with greater perceptual richness (excluding diagrams that depicted the organisms with only labels). There was a significant difference in the average perceptual richness of the organisms and the backgrounds, t(573) = 40.33, p < 0.001, with organisms depicted more richly (M = 1.54, SD = 0.56) than backgrounds (M = 0.39, SD = 0.63).
Spatial Arrangement.
The online life cycle diagrams were mostly circular (531 of the 633 diagrams, 84%). The majority of the diagrams were also closed (530 of the 633 diagrams, 84%). The large majority of the linear diagrams were open (99 diagrams out of 102), and the large majority of the circular diagrams were closed (527 diagrams out of 531).
Depictions of Variability.
As with the book diagrams, the vast majority of the diagrams depicted only one generation (620 of the 633 diagrams, 98%). Only 13 diagrams (2%) depicted more than one generation; of these, 10 diagrams depicted two generations, and three diagrams depicted three generations. The vast majority of diagrams also depicted only one organism per stage (604 of the 633 diagrams, 95%). Of the remaining diagrams, eight diagrams (1%) depicted two organisms, five diagrams (1%) depicted three organisms, four diagrams (1%) depicted four organisms, and 12 diagrams (2%) depicted five organisms or more per stage. This indicates that at least a minority of diagrams depicted within-species variability. Considering zygotes, 64 diagrams (10%) did not depict zygotes, 302 diagrams (48%) depicted only one, and 267 diagrams (42%) depicted two or more.
Like the diagrams in books, the large majority of life cycle diagrams from the AI2D data set showed only one type of organism (588 of the 633 diagrams, 93%). Thirty-three diagrams (5%) showed two types of organisms, five diagrams (1%) showed three types of organisms, five diagrams (1%) showed four types of organisms, and two diagrams (1%) showed five or more types of organisms. As in the analysis of diagrams in books, diagrams that depicted viruses and parasites typically showed more organisms.
Once again, we examined the composite score for depictions of variability to evaluate whether many diagrams had one indicator or whether a few diagrams depicted many different forms of variability. On average, diagrams depicted 0.14 forms of variability (SD = 0.42). We found that 561 diagrams (87% of total) had no depictions of variability, 60 diagrams (9%) depicted at least one form of variability, nine diagrams (1%) depicted two forms of variability, and three diagrams (0.5%) depicted three forms of variability. See Figure 5.
Comparison of Online and Book Diagrams
Even though we did not have a priori hypotheses about diagrams found in books and diagrams found online being different, the descriptive data suggest that there may be some systematic differences between them. To evaluate these potential differences, we conducted a series of exploratory analyses.
We first investigated whether the richness of the depictions of organisms differed between online and book diagrams. We used a chi-squared test to evaluate whether the distribution of bland, in-between, and rich diagrams differed for book diagrams versus online diagrams. We also separated diagrams that depicted the organisms in a bland manner, and those that used only labels. As shown in Figure 4, relative to diagrams in books, we found that a higher proportion of diagrams from the AI2D data set (online diagrams) depicted the organisms in a way that was in between rich and bland, and a lower proportion of diagrams depicted the organisms in a rich way, χ2 (3, N = 708) = 28.70, p < 0.001 (the results do not change if we do not separate bland and labels, χ2 (2, N = 708) = 28.65, p < 0.001). As seen in Figure 4, diagrams in books also had richer backgrounds, on average, than diagrams online, χ2 (2, N = 708) = 55.58, p < 0.001).
We also examined differences in spatial arrangement. We used a logistic regression to predict the probability of the diagram being circular from whether the diagram was found online or in a book. We found that online diagrams were 3.67 times more likely to be circular than book diagrams, t(706) = 5.03, p < 0.001.
To explore possible differences in how online and book diagrams depict variability, we examined differences in composite scores. There was no difference in the number of forms of variability shown in online and book diagrams, χ2 (3, N = 708) = 3.75, p = 0.290. As seen in Figure 5, the amount of variability displayed in both online and book diagrams was very low (Mbooks = 0.24, SDbooks = 0.57, Monline = 0.14, SDonline = 0.42).
DISCUSSION
Overall, we found a great deal of variety in how life cycles were represented in diagrams. However, we also found some systematic patterns. The majority of the life cycle diagrams we analyzed depicted the focal organism in a very detailed manner but included less perceptual richness in the background. In terms of spatial arrangement, the majority of the diagrams were circular and closed. Although some diagrams explicitly depicted variability, the majority depicted only one organism per generation and showed only one generation. Additionally, even though we did not have any hypotheses about differences between diagrams in books and online, it appears that diagrams found in books were more likely to be linear, tended to depict the organisms with fewer details, and tended to have blander backgrounds.
We found that life cycle diagrams typically depicted the focal organism with many perceptual details. Depicting the focal organism in a perceptually rich manner could either promote or hinder learning, depending on the goal of the lesson. Studies of mathematics learning suggest that perceptual details are beneficial if they are relevant to the concept being learned (Siler and Willows, 2014), so it seems important to consider the relevance of perceptual detail in life cycle diagrams. Being able to rapidly recognize the animal in a diagram is clearly relevant, so one might expect diagrams with perceptually rich organisms to be beneficial for learning and generalization. However, Menendez et al. (2020) found that teaching adults about metamorphosis with life cycle diagrams with a highly detailed organism resulted in lower generalization, compared with teaching with a blander diagram. They hypothesized that this is because bland diagrams make students attend to the underlying structure of the category and abstract away from the specific organism used in the lesson. This account suggests that diagrams with highly detailed organisms may be detrimental for generalization to other organisms. It is possible that representations that are in between rich and bland may be most beneficial, because they include enough details for students to recognize the animal, but not so many that they become distracting. It is worth noting, however, that the Menendez et al. (2020) study was conducted with adults, who likely already knew about metamorphosis for some animals. It is possible that younger students, such as those in elementary school, would benefit from the addition of relevant details.
We found that the backgrounds of life cycle diagrams tended to be blander than the organisms depicted. Given that the backgrounds of life cycle diagrams are generally not necessary for learning about an organism’s life stages, this lack of perceptual detail in the background might be good, as students often learn more from diagrams with fewer perceptual details (Butcher, 2006; Fyfe et al., 2015). From this perspective, it might be somewhat concerning that only 30% of the diagrams found in books had bland backgrounds. Online diagrams were better in this regard, with more than 70% of the diagrams having a bland background. However, the details in the background might sometimes be relevant. Particularly for life cycle diagrams, details in the background could indicate that the organism might live in different environments throughout its life. Future work should examine how relevant details in the background could influence student learning.
We also found that the majority of the life cycle diagrams were circular and closed. In fact, we found a strong association between circular diagrams and closed diagrams: Circular diagrams were almost always closed, and linear diagrams were almost always open. Note that this need not be the case; if a diagram resembled a circle but did not have an arrow going back to an earlier stage, it would have been classified as circular and open. The large number of circular life cycle diagrams was to be expected, as the word “cycle” is part of their name. However, we found a smaller proportion of circular diagrams in books than online. Roughly 60% of life cycle diagrams in books were circular, whereas more than 80% of life cycle diagrams found online were circular. It is possible that this may be due to how the images were scraped or how the search algorithm for the AI2D database worked. If the term “life cycle” was used as a search term, an image search engine might be more likely to show images that are circular.
Regardless of the reason, prior research has found that the spatial arrangement of the elements in a representation matters for student learning (Schnotz and Kürschner, 2008; Novick et al., 2011). Although, to our knowledge, spatial arrangement has never been investigated with life cycle diagrams, prior research suggests that people often think of the life stages of organisms in a linear manner (Tversky, 2011), like a timeline. It could be the case that linear diagrams make it easier for students to learn about the life cycle of an animal, because they align with students’ internal representations of how processes unfold across time.
Even though the purpose of life cycle diagrams is to depict the life stages of an organism, closed circular diagrams might have the unintended consequence of portraying the idea that an organism will have offspring that look exactly like the original organism, particularly if only one organism is represented at each stage. Closed, circular diagrams do not show that animals can look different from their parents, knowledge that is key for students’ later understanding of genetic transmission and within-species variability. Further, by portraying that organisms do not change from one generation to the next, closed circular diagrams could potentially reinforce essentialist reasoning. More research needs to be done on the potential ramifications of teaching with linear versus circular diagrams.
One important aspect to consider is why circular diagrams might be used. One possible reason may be to capture the idea that the process shown repeats itself from one generation of the species to the next. In this way, circular diagrams provide a representation of processes that occur at the species level. This idea is exemplified by the arrow going from the adult to the zygote (or the first stage). If the diagram shows the life of a specific organism, it makes little sense for this be the endpoint, as the life of the organism might continue after the first reproductive cycle (depending on the species). However, at the species level, this endpoint makes intuitive sense, because it shows that the mature organism reproduces, and the next generation will follow the same process. This intention of life cycle diagram designers to represent the species level might be apparent to most adults and might be the reason why Tversky (2011) described that, even though adults thought about the life of plants linearly, adults preferred the circular diagram. However, this depiction of the life stages at a species level might be more complicated for children to grasp, and it may have the unintended consequence of conveying to students that there is little or no variability from one generation to the next. Future research should examine whether children think of life cycle diagrams at an individual or species level.
Only a very small percentage of diagrams highlighted any form of biological variability other than variability in the life course of the focal organism. The majority of diagrams showed only one generation and displayed only one organism per stage. Without having more than one organism per stage, it is difficult to show variation within the species. Without showing more than one generation, it is challenging to show how factors such as mutations or sexual reproduction lead to differences among organisms of a species. This is not to say that displaying multiple generations or multiple organisms would automatically teach students about variability. If a diagram has multiple generations and multiple animals per generation, but they all look the same, students might still not infer that variability is possible. However, showing multiple generations and multiple organisms increases the likelihood of showing variability, compared with single-generation diagrams with only one organism per stage. This single-generation, single-organism diagram was the most common, representing 81% of the life cycle diagrams found in books, and 87% of the diagrams found online. If life cycle diagrams are diagnostic of visual representations in biology more generally, then this study suggests that students receive little experience with visual representations of biological variability. Future work should examine how variability is depicted in biology diagrams other than life cycle diagrams.
Implications for Biology Education
Our study aligns with past research that suggests that the visual representations used in biology curricular materials might not be optimal for promoting student learning (Angra and Gardner, 2018; Catley and Novick, 2008). Our results suggest that life cycle diagrams are generally perceptually rich (particularly in their depiction of the focal organism), typically circular, and rarely display variability. The perceptual richness and circular organization could potentially influence how students learn and generalize from lessons on the life cycle of an organism. Rarely displaying variability might not influence how students learn about the life cycle, but it could be a missed opportunity to introduce students to other important biological concepts such as within-species variability. These characteristics might be unique to life cycle diagrams but could also be representative of other diagrams in biology curricular materials. However, more work is needed in this area.
It is worth noting that we did find differences between diagrams found online and diagrams found in books. These differences might be relevant for educators who are looking for diagrams to include in their lessons or for education researchers examining the visual representations to which students are exposed. Diagrams from the AI2D data set (which were scraped from online searches) had fewer perceptual details than those found in books. This was the case both for the focal organisms and for the background. In terms of the perceptual richness of the organisms, the diagrams found online were more likely to be categorized as in between rich and bland; thus, they typically had some details that would allow students to recognize the organisms, while not overwhelming them with information. The backgrounds of the online diagrams were also more likely to be bland, hence reducing the amount of irrelevant information. There were also some differences in terms of spatial arrangement. We found that the diagrams in books were more likely to be linear. Comparing these two sources of diagrams was not an initial goal of our study, however, so these differences should be interpreted with caution.
Implications for Psychological Theories
As discussed earlier, most life cycle diagrams were closed circles, which might convey the idea that organisms do not vary from one generation to the next. This, compounded with the fact that life cycle diagrams rarely showed within-species variability, could potentially reinforce the essentialist beliefs that categories are immutable and do not change and that all members of a category look the same. This finding is in line with findings from other studies that suggest that biological representations sometimes depict misconceptions (Catley and Novick, 2008). Although our study did not test student outcomes, it nevertheless highlights the need for more research on how characteristics of visual representations (and of educational materials more broadly) might shape or reinforce students’ intuitive theories.
Exploring the ways that intuitive theories are reinforced might offer insights into why they are so difficult to supplant. Mayr (1982) argued that essentialist reasoning can be seen throughout the history of science, and recent research has shown that professional scientists also reason using intuitive theories, particularly under time constraints (Kelemen et al., 2013). Recent work suggests that intuitive theories are not supplanted by scientific theories, but rather coexist with them (Shtulman and Harrington, 2016). In particular, researchers have found that additional education does not lead to a decrease in people’s endorsement of essentialism or other intuitive theories (Coley et al., 2017). There are many potential reasons why intuitive theories persist, but this study suggests that one possible reason why essentialist reasoning persists is that curricular materials might reinforce it. One potential avenue for future research is to explore whether students display less-intuitive thinking when exposed to diagrams that challenge (rather than support) these biases.
This study also joins a recent trend in developmental psychology that aims at characterizing children’s environments. Although psychological research has long examined how experiences with particular stimuli influence behavior (e.g., Tomasello, 1992; Mix, 2009), recent studies have pushed the systematic study of children’s environments toward larger samples and more naturalistic settings. This trend can be seen most directly in research on language development, in which video and audio recordings of children’s language environments have influenced our models of the factors that influence vocabulary development (Gilkerson et al., 2017; Montag et al., 2018; Bergelson et al., 2019). Researchers have also started to focus on the information that children are exposed to in educational settings, in an effort to better understand children’s thinking in these areas. In particular, researchers have conducted analyses of mathematics textbooks to understand the types of problems children are typically exposed to (McNeil et al., 2006; Braithwaite et al., 2017). Knowing the types of math problems that children typically encounter has allowed researchers to formulate better explanations of how problem format influences children’s performance (McNeil, 2008; Braithwaite et al., 2017).
Our study takes a first step toward characterizing one aspect of the student environment in formal biology education. Although books are only one source of biological information, they might be representative of more widespread aspects of students’ environments. Additionally, we hope that our study provides researchers with an idea of the characteristics of the life cycle diagrams students typically encounter. Researchers can use these characteristics when constructing materials for studies that evaluate student learning. For example, our analysis suggests that life cycle diagrams like the one in the left panel of Figure 1 are common (circular diagrams with rich organisms but bland backgrounds). With this knowledge, studies that examine the effects of visual features on learning can set this diagram, or ones similar to it, as their control condition. Therefore, if such studies show that a different type of diagram is more effective, then it would suggest that using those more effective diagrams in classrooms might enhance learning. As another example, future work could investigate whether linear or circular life cycle diagrams are better for student learning about the life cycle of an organism. Tversky (2011) described that people tend to think of the life cycle in a linear way, but our study shows that most life cycle diagrams tend to be circular. Such a study could test whether the spatial arrangement that students are familiar with (circles) or spatial arrangements that match their mental models (lines) are better for learning.
Finally, our study also suggests some novel research directions for the study of intuitive theories. Although prior research has focused on how language might promote essentialist reasoning (Gelman et al., 2013; Betz et al., 2019), our study is the first to explore the possibility that essentialist ideas can be conveyed visually. Although a lot of work needs to be done to determine whether specific features of diagrams influence essentialist reasoning, this is a potentially far-reaching contribution, as it might suggest modifications to the visualizations included in biology books, classes, and possibly even museums.
Of course, it is important to acknowledge the limitations of this study. Most important, this study does not present any behavioral data. Although we reviewed literature on how the features of diagrams influence learning, we do not have data to suggest that any of the features we analyzed lead to better student outcomes. We hope that our study provides researchers with a starting point for designing studies that do test student outcomes.
Second, we do not know the origin of the diagrams from the AI2D database, other than that they were scraped from Google Images. It is possible that some of the diagrams found online were originally found in books. Therefore, our comparison between diagrams found online and diagrams found in books might be confounded. Additionally, the online diagrams were scraped using concepts from elementary school science as search terms. In our sample of books, we included diagrams from college textbooks, as well as from trade books intended for younger readers. Although there is no way to determine that all the online diagrams were meant for elementary school students, we cannot discard the possibility that the differences between the online and book diagrams may be due to differences in the grade levels of the intended audiences.
CONCLUSIONS
In this study, we examined the characteristics of life cycle diagrams and considered these characteristics in light of current research in psychology and the learning sciences. We focused our analysis on life cycle diagrams, as they are a common type of diagram that students encounter across the grades. We found that life cycle diagrams, particularly those found in books, often have rich backgrounds, a feature that prior work suggests might hinder student learning and generalization. We also found that most life cycle diagrams showed only one generation and depicted only one organism per stage and that the life stages were usually arranged in closed circles. We argue that these characteristics might suggest that the organisms within a species will always look the same. Our study encourages textbook creators and biology instructors to critically examine the visualizations they use, as features of these visualizations could have ramifications for students’ learning about biological variability. Additionally, our study shows the relevance of examining the information that students are exposed to in schools, as it might inform psychological theories of why people hold intuitive theories and why intuitive theories are resistant to change.
ACKNOWLEDGMENTS
The research reported in this paper was supported by the National Science Foundation, through award 1760940 to K.S.R., and by the Institute of Education Sciences, U.S. Department of Education, through award R305B150003 to the University of Wisconsin–Madison. The opinions expressed are those of the authors and do not represent views of the U.S. Department of Education. We would like to thank Charles Kalish and Andrea Donovan for providing feedback on earlier versions of this article.