Analysis of Protein Localization and Secretory Pathway Function Using the Yeast Saccharomyces cerevisiae
Abstract
The isolation and characterization of mutants has been crucial in understanding a number of processes in the field of cell biology. In this exercise, students examine the effects of mutations in the secretory pathway on protein localization. Yeast strains deficient for synthesis of histidinol dehydrogenase are transformed with a plasmid encoding a chimeric protein. The chimera contains a signal sequence fused to histidinol dehydrogenase. A strain with a defect in the translocation of secretory proteins into the endoplasmic reticulum (ER) accumulates sufficient histidinol dehydrogenase in the cytoplasm to grow on media lacking histidine. In contrast, yeast proficient for secretion, or yeast with secretion defects later in the pathway, are unable to grow on media lacking histidine. Student analysis of the experimental yeast transformants and appropriate controls allows investigation into the effects of conditional defects in the secretory pathway on both cell viability and protein localization. The exercise is usually performed in a manner that allows students to execute a number of techniques common in molecular biology laboratories, including plasmid minipreps, restriction digestions, and Southern blots. Student understanding and enjoyment of the exercise was assessed by laboratory reports, oral and written examinations, and questionnaires. After completion of these experiments, students can describe the utility of protein fusions, the roles of mutant analysis in cell biology, and the steps taken by proteins transiting the secretory pathway.
INTRODUCTION
The field of cell biology has been described as a fusion of the fields of biochemistry, cytology, and genetics (Becker et al., 2000). Our knowledge of the role of specific proteins involved in such basic cellular processes as secretion, DNA replication and gene expression, and the functions of the cytoskeleton, has greatly benefited from the use of powerful genetic and molecular approaches. Many undergraduate cell biology textbooks devote a chapter to genetic approaches for studying cell biology. However, most laboratory exercises published for undergraduate cell biology courses utilize biochemical and cytological approaches, which gives students little direct experience with the role and power of genetics in the study of cell biology.
This laboratory exercise furthers student understanding of the utility of genetics, protein fusion technology, and microbes in cell biology by providing firsthand experience with the effects of mutations that alter protein localization. The budding yeast Saccharomyces cerevisiae is a eukaryote and therefore contains the same basic structures, such as nuclei, mitochondria, endoplasmic reticulum (ER), and peroxisomes, that are found in more complex organisms. Many organelle components and the pathways used to localize molecules to organelles have been identified and partially characterized in S. cerevisiae, and studies in yeast continue to be groundbreaking in many fields. Frequently, findings in yeast pertaining to basic cell biological processes can be generalized to other eukaryotic cells. Because S. cerevisiae is unicellular and stable as a haploid or a diploid, isolation and characterization of recessive mutations is relatively straightforward, which facilitates genetic analysis. Because of the ease of genetic manipulation, the small genome size, the short doubling time, and the inexpensive growth conditions, S. cerevisiae has been called the Escherichia coli of eukaryotic cells (Watson et al., 1987). These characteristics make budding yeast an excellent and frequently used model system for research laboratories as well as an ideal system for a teaching laboratory.
The proper localization of proteins to specific subcellular structures is critical for cell growth and especially important in the functioning of eukaryotic cells with their many membrane-bound compartments. In eukaryotic organisms, proteins destined to be secreted have signal sequences at their amino terminus. In most cases, the signal sequence interacts with cellular factors that stop translation and target the nascent polypeptide chain to the ER. Once brought to the ER membrane, the new protein is usually cotranslationally translocated into the ER. The Sec61 protein is the primary component of the translocation channel (see Romisch, 1999, and Robb and Brown, 2001, for recent reviews). SEC61 was originally identified by directly selecting for mutants that failed to localize a protein containing a signal sequence to the secretory pathway (Deshaies and Schekman, 1987). A similar screen was used to isolate mutants in E. coli that affected protein translocation through the inner membrane (Oliver and Beckwith, 1981).
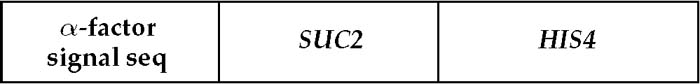
In the study that led to the isolation of SEC61, Deshaies and Schekman (1987) fused DNA encoding a signal sequence from the secreted α-factor protein to DNA encoding histidinol dehydrogenase (pRSB204; Figure 1A). Alpha-factor is a mating pheromone normally secreted by α cells to attract cells of the opposite mating type (a cells). Histidinol dehydrogenase, encoded by the HIS4 gene, is required for the last step in histidine biosynthesis. The substrate of the enzyme, histidinol, is present only in the cytoplasm, and the product of the reaction, histidine, is required in the cytoplasm for the charging of tRNAHis molecules required for protein synthesis. The ER membrane is impermeable to histidinol and histidine. Therefore, haploid yeast with a mutation in their chromosomal copy of HIS4 and that contain the α-factor–His4 fusion protein are phenotypically His- because the fusion protein is localized to the secretory pathway and therefore no histidine is produced. In contrast, yeast compromised for the ability to translocate proteins into the secretory pathway are His+ if they carry the α-factor–His4 fusion protein even if they have a mutation in their chromosomal copy of HIS4. In this case, sufficient fusion protein accumulates in the cytoplasm to allow histidine production. Selection of yeast mutants that could grow on media lacking histidine when they contained theα -factor–His4 fusion protein allowed the identification of genes encoding protein products involved in the translocation of proteins into the ER membrane (Deshaies and Schekman, 1987). This approach to identifying proteins required for translocation is summarized in Alberts et al. (2002, p. 668). Yeast that have a mutation in their chromosomal copy of HIS4 and have defects in other parts of the secretory pathway are His- when carrying theα -factor–His4 fusion protein because although they do not secrete the fusion protein as the wild type does, the protein accumulates within secretory organelles or vesicles and is therefore unable to function.
Deshaies and Schekman (1987) also utilized a control plasmid to demonstrate that the failure of strains to grow on media lacking histidine in the assay just described is caused only by the localization of histidinol dehydrogenase to the secretory pathway. This plasmid, pRSB203, contains the same HIS4 sequences present in pRSB204, but without the α-factor signal sequence (Figure 1B). Strains carrying this plasmid can grow on media without histidine; thus, these transformants serve as a positive control to demonstrate that cells that can produce their own histidine can grow on appropriate media. Finally, a negative control plasmid, YEp24 (Figure 1C), containing neither α-factor nor HIS4 sequences, is used to demonstrate that all strains are phenotypically His- if they are not transformed with a plasmid containing the HIS4 gene. YEp24 is the vector backbone on which the other constructs are based.
Using the plasmids constructed by Deshaies and Schekman (1987), this laboratory exercise allows analysis of the effects of a mutation that blocks translocation of proteins into the ER (sec61-1) and a mutation that blocks later in the secretory pathway (sec18-1; an allele of yeast NSF). This exercise also permits comparison of the effects of these alleles with those of wild-type strains containing no mutations in the secretory pathway. All strains are haploid and have mutations in ura3, which allows selection for yeast cells transformed with the plasmids and his4; which allows investigation into the localization of the fusion protein. The effects of blocking secretion are analyzed by indirectly assaying the localization of the α-factor–His4 fusion protein and on cell viability.
Yeast strains that are completely defective for the import of proteins into the ER and secretory pathway are inviable because proteins localized to the plasma membrane are critical for a number of cellular functions, including the import of nutrients and the development of a new daughter cell. Thus, the mutants used in this experiment are conditional, growing under some conditions but not others. The isolation and characterization of conditional mutants is necessary for genes that affect essential processes in haploid organisms. Most likely, the mutations result in amino acid changes that affect the amount of protein that is folded properly. At low temperatures, enough of the protein is functional so that yeast cells can grow, whereas at high temperatures, when more thermal energy is in the system, more protein is nonfunctional. Discussion of the kinds of amino acid changes that could result in a protein that was functional at some temperatures and not at other temperatures allows the instructor to revisit the forces and interactions that stabilize the secondary, tertiary, and quaternary structures of proteins that were probably discussed earlier in the cell biology course.
MATERIALS AND METHODS
S. cerevisiae Strains (Available upon Request)
LY 527 MATα SEC+ ura3 his4 leu2 trp1 HOL1-1; LY 689 MATα sec18-1 ura3 his4 HOL1-1; LY 651 MATα sec61-1 ura3 leu2 trp1 his4 HOL1-1. These strains likely have other auxotrophies not listed here.
Plasmid DNA (Available upon Request)
YEp24 vector; pRSB203-YEp24 with HIS4; pRSB204-YEp24 with HIS4 fused to the α-factor signal sequence (Figure 1).
The Laboratory Schedule
In practice, we have always executed the entire protocol as part of a 4-week module that uses approximately an entire 3-h lab period each week, with time for discussion, as described subsequently. All student handouts for this 4-week module can be found in the Appendixes. However, a more minimal exercise of simply spotting yeast strains provided by the instructor during week 1 and analyzing them during week 2 would be feasible. In this case, ample time would be available for discussion, or another experiment could easily be executed during the same laboratory period.
Depending on the level of the students, the laboratory can be made more or less investigative and challenging. Usually, when executed as a 4-week module, neither the identity of the three plasmids nor the identity of the secretion-defective strains is revealed to the students. Instead, the plasmids are simply labeled A, B, and C, and the students use restriction analysis and Southern blotting to determine the identity of each plasmid in parallel with the yeast transformation and phenotypic analysis. Some years, students have been told that the plasmid labels were lost from the samples during shipping. When students are not given any explanation, they seem to easily accept that identifying the plasmids is part of the laboratory exercise. After identification of the plasmids, the students use the phenotypic analysis of yeast transformants to draw conclusions about the presence or absence of a specific type of secretion defect in the yeast strains analyzed. Such analysis makes the exercise much more interesting for the students and requires integration of a number of pieces of data.
Figure 1. (A) Restriction map of pRSB204. Yeast DNA is cloned between the BamHI and SphI sites of YEp24 (see Figure 1C). Constructing pRSB204 from pRSB203 (see Figure 1B) was accomplished by digesting pRSB203 with BamHI and BclI. A BglII to BamHI fragment of DNA containing the α-factor upstream promoter sequences and the signal sequence along with some SUC2 sequences was ligated to the digested pRSB203. The sizes shown are estimates and may be imprecise. This is especially true of the SUC2 upstream region. The SUC2 sequences serve primarily as a linker or spacer region between theα -factor signal sequence and the HIS4 coding sequence. The chimeric protein made from this construct contains the α-factor signal sequence, part of the Suc2 protein, and histidinol dehydrogenase. (B) Restriction map of pRSB203. Yeast DNA is cloned between the BamHI and SphI sites of YEp24 (see Figure 1C). The sizes shown are estimates and may be imprecise. This is especially true of the SUC2 upstream region. The SUC2 sequences serve primarily as a linker or spacer region before the HIS4 coding sequence. The chimeric protein made from this construct contains part of the Suc2 protein and histidinol dehydrogenase. (C) Restriction map YEp24. A more complete map is available in the New England Biolabs Catalog and Technical Reference, 2002. The sequence of the entire plasmid is available at http://www.ncbi.nlm.nih.gov/htbin-post/Entrez/query?uid=310855&form=6&db=n&Dopt=g. The plasmid contains sequences for replication in E. coli (ori) and yeast (2 μm) as well as selectable markers for transformation of E. coli (Ap; ampicillin resistance) and yeast (URA3).
When this exercise is performed as a 4-week experiment, students purify plasmid DNA from E. coli strains containing YEp24, pRSB203, and pRSB204 during the first week (Appendix A; see also the next subsections). Each team of students (usually two to four people) isolates the three plasmids. The second week, student teams use restriction enzymes to digest their DNA that was isolated the previous week. Usually, students digest their DNA with three enzymes for a total of nine digests per team. During incubation of the DNA with restriction enzymes, students transform their three plasmids into a single yeast strain with appropriate controls (Appendix B). Agarose gel electrophoresis, analysis of restriction enzyme digests, transfer of DNA to nylon membranes (Southern blotting), and spotting of yeast transformants are performed during the third week (Appendix C). During final week, students probe and analyze their Southern blots and examine the growth of their yeast cells (Appendix D). Ample time for discussion of results also is available during this period.
Miniprep and Restriction Analysis
The instructor inoculates cultures of E. coli into sterile LB media supplemented with 50 μg/ml ampicillin the day before the laboratory. Students isolate the DNA by using a standard “miniprep” procedure (e.g., Ausubel et al., 1987; Sambrook et al., 1989) during the first week of the module (Appendix A) and then use their isolated DNA for yeast transformations the following week (Appendix B). If students are to determine the identity of the plasmids, as described previously, during the second week they also digest their DNA with restriction enzymes to aid in the identification of each plasmid (Appendix B). HindIII, EcoRI, and PstI have been used successfully for this purpose. A restriction map of YEp24 is available (Figure 1C; see also New England Biolabs Catalog and Technical Reference, 2002), as is the complete sequence of the plasmid ( http://www.ncbi.nlm.nih.gov/htbin-post/Entrez/query?uid=310855&form=6&db=n&Dopt=g). The construction of plasmids pRSB203 and pRSB204 was complex (Deshaies and Schekman, 1987, and references therein); maps constructed from the available data are shown in Figures 1A and 1B. We have been unable to fully reconcile the description of the plasmids with our experimental data. Because part of the exercise for my students is the identification of specific differences between the maps and their data, I do not describe these differences in this article but do include them with the plasmids sent to instructors.
Southern Blotting
To help in the identification of the plasmids, students can perform a Southern blot. In general, identifying the vector, YEp24, is straightforward, even from a single restriction digest. Distinguishing pRSB203 and pRSB204 is more difficult because they differ only slightly in size and restriction sites, and the plasmid maps constructed have some inaccuracies, as mentioned in the preceding paragraph. A Southern blot using a probe from theα -factor gene unequivocally shows that pRSB204 contains the signal sequence encoded from the α-factor gene and allows students to determine which restriction fragments contain sequences from the α-factor coding sequence. Polymerase chain reaction (PCR) primers for the α-factor gene are available from Research Genetics/Invitrogen ( http://www.resgen.com/products/YGP.php3). Genomic DNA suitable for use as a PCR template can easily be isolated (Ausubel et al., 1995; Adams et al., 1998; Akadaet al., 2000; Burke et al., 2000) or purchased (Research Genetics/Invitrogen, http://www.resgen.com/products/YGP.php3), and the α-factor gene can be amplified by the instructor or by the students from a wild-type yeast strain using standard conditions ( ftp://ftp.resgen.com/pub/genepairs/yeast_genpairs/yeast_gp_PCRprotocol.txt; Ausubel et al., 1995). We successfully labeled the PCR product by using the enhanced chemiluminescence (ECL)–direct kit (Amersham Biosciences, Piscataway, NJ); other nonradioactive labeling procedures could also be used.
An “upside-down” Southern blotting with a 45-min transfer, originally suggested by F. Volkert, State University of New York (SUNY) Downstate Medical Center, (Appendix C) is used to transfer the DNA onto a nylon membrane such as Hybond-N+ (Amersham Biosciences). This methods allows students to complete running and photographic documentation of gels and transfer of the DNA onto the membrane in the same 3-h laboratory period. Membranes can be stored between sheets of Whatman paper at 4°C for at least a week.
Spotting Yeast on Plates
Complete instructions for media preparation were recently published in this journal (Odom and Grossel, 2002) and are available from a number of other sources (see subsequent discussion). Specifically, the amino acid dropout mix is made as described and can be stored in the dark for a number of years after it is mixed very well. The nutrient solutions are also made as described. Glucose (100 ml of 20%/l of media) is autoclaved in a container separate from other media components and added afterward. Synthetic complete media lacking uracil (subsequently called SC-U) and synthetic complete media lacking uracil and histidine with histidinol (subsequently called SC-H-U) are made similarly to the SC-T (synthetic complete media lacking tryptophan) described. In both cases, sterile tryptophan is added after autoclaving. To make SC-U plates, the uracil supplement is omitted. To make SC-H-U plates, the uracil and histidine supplements are both omitted and histidinol is added to a final concentration of 3 mM (Sigma Chemical Co., St. Louis, MQ). We successfully added the histidinol powder to the media after autoclaving without adversely affecting the sterility of the media. Alternatively, a 300 mM solution of histidinol in water can be filter sterilized and 10 ml added to a liter of media after autoclaving.
Instructions to make “dropout” media (sometimes called“ complete minimal dropout media”) can also be found in a number of laboratory manuals (Ausubel et al., 1995; Adams et al., 1998; Burke et al., 2000) and online ( http://genome-www.stanford.edu/Saccharomyces/VL-yeast.html). In addition, premixed powders containing the amino acid dropout mix with or without yeast nitrogen base as well as prepoured plates are available for purchase (Qbiogene, Inc. [formerly Bio101, Inc.], Carlsbad, CA, http://www.qbiogene.com/; Teknova, Inc., Half Moon Bay, CA, http://www.teknova.com/). If prepoured plates are purchased, spreading histidinol on the plates lacking histidine and uracil a few days before laboratory would probably be acceptable. Each plate should be assumed to contain approximately 25 ml of media; histidinol should be diluted so that not less than 0.2 ml is spread per plate to ensure even distribution.
Yeast cells competent for transformation are provided by the instructor. These can be prepared by various methods (Ausubel et al., 1995; Adams et al., 1998; Burke et al., 2000; Odom and Grossel, 2002; http://www.umanitoba.ca/faculties/medicine/biochem/gietz/Quick.html). In addition, kits are available containing all the solutions and reagents necessary for the transformation (Genomics One International, [previously Tetralink], Buffalo, NY, Gietz lab yeast transformation kit at http://www.tetra-link.com/; Qbiogene at http://www.qbiogene.com/products/gene-expression/ez-yeast.shtml; BD Biosciences/Clontech Palo Alto, CA, at http://www.clontech.com/products/catalog02/HTML/1020.shtml). Yeast cells are made competent (by treatment with 0.1 M lithium acetate; 10 mM Tris-HCl; pH 7.5; 1 mM EDTA [ethylene-dinitrilo tetraacetic acid]) the day before the first laboratory period of the week and have been successfully stored at 4°C for at least 3 d. Because the number of transformants is not critical, the slight decrease in transformation efficiency that may occur upon storage is not a problem. Furthermore, saturated cultures of yeast cells or cells scraped from plates have been used instead of log phase cultures without problem. Sheared carrier DNA for the transformation is available commercially (Research Genetics/Invitrogen; BD Biosciences/Clontech).
Each student team transforms one strain of yeast with the three plasmids isolated in the first week. Students are encouraged to perform control transformations. The three strains—SEC+, sec18, and sec61—are usually transformed by members of a single laboratory class such that each student team has access to all strains transformed with all plasmids the following week. Students are encouraged to label their plates carefully and completely on the bottom so that if the instructor needs transformants from a particular strain, they are easily accessible. The following week, the yeast transformants are spotted on two types of media. The first, SC-H-U, lacks uracil and histidine and contains 3 mM histidinol, and the second, SC-U, lacks only uracil. Only cells that can make their own uracil and histidine can grow on the first set of media. In addition, the ability of the yeast cells to grow at three temperatures (25°C, 30°C, and 38°C) is analyzed. If incubators are limiting, yeast cells can be assayed at room temperature and 38°C. Each team of students works with transformants from three yeast strains—wild type, sec61, and sec18 mutant yeast. Each transformant (or a few transformants if they are less than 1 mm in diameter) to be analyzed is resuspended in 100 μl of sterile water in a microfuge tube. Students are encouraged to do duplicate or triplicate samples for each strain and plasmid combination. Cell suspensions are vortexed, and 5 μl of each are aliquoted and gridded onto six plates (SC-H-U and SC-U at three temperatures each). Plates are incubated for 3 to 7 d and are analyzed in lab the following week. Spotting cells in this manner allows more-reproducible results and analysis of more colonies per plate than streaking does.
Phenotypic Analysis of Yeast
Students are encouraged to devise a scoring system for cell growth on plates that fairly reflects the phenotypes they see. Three to four categories (i.e., + +, +, + / -, -) usually suffice. Analysis of the controls is necessary before students begin to interpret the experiment. Students can often see a film of cells even on plates on which they expect no growth (e.g., wild-type cells containing the YEp24 plasmid on the SC-H-U plates). This cell film occurs because so many cells were placed on the plate. This amount of growth is scored as (-) because it represents the background. Similarly, the amount of growth seen with the wild-type strain and pRSB203 (the HIS4 construct without the signal sequence) represents the maximum growth (+ +) that they can expect on the SC-H-U plates. Students frequently need help thinking about how to interpret the controls.
RESULTS
Plasmid Analysis
Students all recover plasmid from E. coli as evidenced by pellets of DNA at the end of the miniprep procedure and later analysis by electrophoresis. Analysis of restriction enzyme digestion patterns allows most students to unambiguously determine which plasmid is YEp24. Identification of plasmids pRSB203 and pRSB204 is more difficult because they are similar. In addition, the original construction of the plasmids was extremely complicated (Deshaies and Schekman, 1987), and the original restriction map (Figure 1) constructed from these data for the laboratory exercise described here was not completely accurate. As mentioned previously, we have been unable to completely reconcile the description of the plasmid construction with the data gathered in the laboratory. The restriction map has been left unmodified for the students in this course as a way to challenge them with data that are not exactly as expected. Nevertheless, some students have a good hypothesis of the identity of the plasmids after analysis of the restriction data. Most students successfully execute the Southern blot procedure. Because the probe used is from the α-factor gene, only specific bands from plasmid pRSB204 hybridize to the probe. With this information, all students can then unambiguously differentiate plasmids pRSB203 and pRSB204.
Yeast Transformation and Phenotypic Analysis
Students are encouraged to include positive and negative controls for their yeast transformation. Most students determine that a sample for which no plasmid DNA is added to the transformation is a good control to show that the untransformed strain is unable to grow on media lacking uracil. In addition, some students want to use as a positive control a plasmid that was previously used successfully in a transformation. Other students suggest that spreading the cells on plates that have uracil added to them is another good control. Doing so demonstrates that the only reason the cells are not growing on the plates is their inability to make uracil. A stock of sterile 20 mM uracil is made available to students for this use, and students spread 0.2 ml on the plate before spreading cells.
Most students obtain transformants with their plasmids, although, sometimes students see no colonies appear or their plates are too contaminated to use. The negative and positive controls generally behave as expected: no colonies grow in the absence of added DNA, and colonies grow if uracil is added to the plates or if a control plasmid is utilized for the transformation. If some groups fail to obtain transformants, they may be able to borrow some from another laboratory period or group for their analysis. In addition, stocks of each strain transformed with the three plasmids have been archived and are available to instructors who request them. These can be stored as a stable stock at –80°C in case of difficulty recovering transformants, or for use by instructors who do not want to do the full 4-week module, as mentioned previously.
Students use their own transformants as well as those from at least two other groups to spot SC-U and SC-H-U plates at 25°C, 30°C, and 38°C. The SC-U plates contain all the nutrients that the transformed cells need to grow. As a result, after the transformants are spotted, all isolates from the wild-type strain grow on SC-U at all three temperatures, whereas the transformants from the sec61 and sec18 strains grow well at 25°C and 30°C and show little growth at 38°C. Because secretion is an essential process, cells containing mutations that produce temperature-sensitive proteins are inviable at high temperatures even if they have all their required nutrients. The sec61 mutant yeast frequently show some “leaky” growth at 38°C. The instructor can use this example as an opportunity to discuss the difficulties of isolating mutants that are strongly defective under some conditions but much less defective under others.
The SC-H-U plates are lacking histidine; thus, cells from all strains transformed with the YEp24 vector control plasmid fail to grow on these plates at any temperature. These cells are lacking histidinol dehydrogenase activity and thus require histidine to grow. These controls demonstrate the phenotype of strains that are His- and act as a negative control for growth on SC-H-U plates. Students will likely see a film of cells at the positions where the YEp24-containing strains were spotted. Cells have intracellular stores of amino acids and may be able to go through a few doublings before growth is arrested.
In contrast to the strains transformed with YEp24, strains transformed with the positive control pRSB203 plasmid, which contains the HIS4 gene, are able to grow on the SC-H-U media. Strains containing this plasmid act as a positive control for growth on SC-H-U plates. The wild-type strain transformed with pRSB203 grows well at all temperatures on the SC-H-U media, whereas the growth of the secretion-defective mutants on SC-H-U resembles that on SC-U: the cells grow well at 23°C and 30°C and fail to grow at 38°C. The pRSB203-containing strains demonstrate that the only nutrient lacking on these plates is histidine and that cells that can manufacture their own histidine can grow, unless they have another mutation that causes temperature sensitivity.
The pRSB204 plasmid encodes a fusion protein that consists of the signal sequence from the secreted α-factor pheromone fused in frame to HIS4. Thus, the resultant protein is targeted to the ER and secretory pathway. The wild-type strain containing pRSB204 is phenotypically His- and unable to grow on the SC-H-U plates at any temperature. In contrast, the sec61 strain with pRSB204 grows on the SC-H-U plates at 23°C and 30°C. Because sec61 mutants have a defect in the translocation of proteins into the ER, sufficient quantities of the fusion protein accumulate in the cytoplasm, where they function to produce histidine. Because the cells are growing on the SC-H-U plates, it is clear that they can synthesize histidine and therefore mislocalize theα -factor–HIS4 fusion protein. However, because secretion is an essential process, failure to import any proteins into the ER will result in cell death. Thus, at 23°C and 30°C, enough proteins are being translocated to allow cell viability; however, there is also some defect in translocation that allows the accumulation of sufficient cytoplasmic His4 protein to allow synthesis of adequate levels of histidine.
The sec18 strain containing pRSB204 behaves like the wild type and fails to grow on the SC-H-U plates at any temperature. The sec18 mutant causes the accumulation of vesicles because vesicle fusion with target membranes is disrupted (Wilson et al., 1989; Kaiser and Schekman, 1990). Thus, the α-factor–HIS4 fusion protein enters the secretory pathway and most likely accumulates in vesicles where it is unable to function. The utilization of this strain in the assay illustrates that not all secretion-defective mutants behave similarly and allows student investigators to discriminate between mutants that affect the translocation of proteins into the ER and those that block later in the pathway.
Students who use the literature to determine the function of sec18 and sec61 before coming to laboratory can frequently predict the phenotype of the sec18 and sec61 transformants carrying pRSB204. For others, the observation that not all sec mutants behave similarly challenges them to think more carefully about the secretory pathway and the fusion protein. The fusion protein was used to specifically select for mutants that failed to translocate the protein into the ER (Deshaies and Schekman, 1987) because other screens and selections for secretion-defective yeast failed to identify mutations in this class (Novick and Schekman, 1979; Novick et al., 1980; Ferro-Novick et al., 1984). Students can be encouraged to propose selections that would allow the isolation of mutants defective in other stages of secretion.
DISCUSSION
Student Outcomes
This experiment has been conducted six times, and the results are reproducible in terms of both the experimental results described in the preceding section and the student outcomes from year to year and between laboratory teams and sections.
For the past 3 yr, on the day when they will score the growth of their yeast colonies, students are required to come to laboratory with a chart prepared containing their predictions as to which strains will grow under particular conditions of media, temperature, and plasmid (Appendix D). This goal-oriented task greatly aids both the student in understanding the material and the instructor in understanding where the student needs help and which students are confused. Many students struggle to have a hypothesis about the growth of each transformed strain on each type of media; approximately one-third of the students come to laboratory with correct predictions for all the strains and all conditions. Student groups must take part in a discussion with the instructor before receiving their plates for analysis. During this time, the instructor can work with students to review what they have been doing and to help clarify expectations and hypotheses. The exercise requires them to synthesize a number of ideas, as well as work that they have performed during a number of weeks. However, by the end of the last laboratory period, at least 90% of the students understand the phenotypic analysis and generally seem to feel a great sense of accomplishment at having mastered the module. A number of students have noted how satisfying it is when all the“ information comes together.” There is palpable excitement in the laboratory when students begin to examine their plates, with many“ ah-ha!”s and “ohhhs!”s exclaimed during the analysis.
In anonymous course evaluations, students have generally thought that the technical difficulty of all the laboratory modules was appropriate. Specifically, when students were asked to rank the difficulty of each exercise, where 1 is too easy and 5 is too difficult, the miniprep/restriction digestion scored 3.0 ± 0.6, the yeast transformation scored 3.1± 0.4, the yeast phenotypic analysis scored 3.1 ± 0.5, and the Southern blotting scored 3.0 ± 0.4 (Table 1).
| Too easy | = > | Too difficult | Not interesting | = > | Very Interesting | |||||||||
|---|---|---|---|---|---|---|---|---|---|---|---|---|---|---|
| 1 | 2 | 3 | 4 | 5 | 1 | 2 | 3 | 4 | 5 | |||||
| Minipreps, restriction digest | 1 | 9 | 70 | 10 | 2 | 0 | 8 | 20 | 37 | 28 | ||||
| Yeast transformation | 0 | 4 | 74 | 12 | 0 | 0 | 2 | 12 | 39 | 40 | ||||
| Yeast phenotypic analysis | 0 | 6 | 69 | 12 | 1 | 0 | 1 | 9 | 32 | 51 | ||||
| Southern blotting | 0 | 5 | 43 | 4 | 0 | 0 | 2 | 8 | 21 | 22 | ||||
Students were also asked to rank the interestingness of the laboratory exercises on a scale of 1 (not interesting) to 5 (very interesting). The miniprep/restriction analysis segment scored 3.9 ± 0.9, the yeast transformation scored 4.3 ± 0.8, the phenotypic analysis scored 4.4± 0.7, and the Southern blotting scored 4.2 ± 0.8. These data on interest and content value and technical difficulty are based on the responses of approximately 90 students for the restriction analysis, transformation, and phenotypic analysis, and approximately 50 students for the Southern blotting, with an evaluation form return rate of at least 80% annually (Table 1). These evaluations include those returned the first time the exercise was used in the laboratory.
Comments on the evaluations suggest that students were excited to execute and understand many of the techniques, especially Southern blotting, about which they had read in texts and papers, and a number of students returned later to tell me that the experience helped them during summer internships and as research assistants. When asked for the most interesting or important thing that was learned from the secretion laboratory experiments, students responded as follows: “I really started to understand ER import in lab. It was great to realize I could figure out what each sec mutant was.” “I think this lab really helped in understanding the sec pathway and the techniques people use to find things out in cell bio.”“ It was interesting to learn how the experiments could be integrated to find out various things concerning the plasmids and the secretory pathway.” On a final exam taken approximately 1.5 months after the completion of the experiment, 50% of the students in the course answered the following questions completely correctly, and another 25% earned at least 80% of the points:
What is the likely fate of a protein that contains an ER signal sequence at its amino terminus and a nuclear localization signal in its middle? Explain your answer.
Is it more likely that the location would change in an importin mutant, a sec61 mutant, or a sec18 mutant? Why?
These scores demonstrate that the majority of students understand how signal sequences function to direct proteins to the secretory pathway and the role of the Sec61 protein in this process after the laboratory exercise is completed.
During 5 of the 6 yr that this experiment was executed, students wrote laboratory reports containing at least one reference from the primary literature. Instead of writing a laboratory report, students who enrolled in the class during the most recent year were examined orally for 20 min on their understanding of the material. In all cases, students were required to explain the differences between the three plasmids used in the experiment and the role of each plasmid in the experiment. In an oral exam 1 week after completion of the laboratory exercises, all students could describe how the plasmids differed from one another and why this was important. They all could also describe why strains with severe defects in the secretory pathway were inviable. Students were also required to address the differences in growth between the sec61 and sec18 strains of yeast on the different types of media and at different temperatures. Approximately 85% could clearly describe how they determined the identity of the three yeast strains on the basis of their growth with the various plasmids at different temperatures and on different media. Almost 70% of the students could clearly and explicitly describe how a mutation in sec61 or sec18 could make yeast strains carrying the allele inviable at high temperatures. Other specific suggestions for issues that students were required to address in their papers or orally can be found in Appendixes E and F.
The Saccharomyces Genome Database (SGD; http://genome-www.stanford.edu/Saccharomyces/) was suggested to students as an excellent resource for preparation for laboratory or written or oral evaluations. Using this database is a valuable way for students to familiarize themselves with the wealth of information freely available to investigators over the World Wide Web. The SEC61 and SEC18 pages are easy to find, are kept current, and contain a variety of material. An instructor could use this database as a starting point for a number of other exercises. The Sec61 protein has been shown to be the primary component of the translocation channel in both yeast and mammals, and a large number of recent references in readily available journals can be found. Sec18 is an ATPase critically important for vesicle trafficking at a number of steps in the secretory pathway and, again, a number of recent papers can be found in accessible journals. Sec61 protein and Sec18 protein are conserved among all eukaryotes and could be an excellent starting point for a bioinformatics module in which students identify homologues from different organisms, perform alignments, and predict the localization of proteins by using available online resources. Furthermore, because Sec61 and Sec18 are conserved, they are excellent examples of the good reason to study model organisms, and they can help students think about the evolution of proteins and organisms.
APPENDIX A Secretion Lab I: Minipreps (Plasmid Isolation from E. coli)
Plan for the next four weeks:
Week 1: Isolate plasmids from E. coli.
Week 2: Digest the plasmids with restriction endonucleases; transform yeast cells with the plasmid DNA.
Week 3: Analyze restriction digests by gel electrophoresis; set up Southern blots; plate transformants on appropriate media.
Week 4: Complete Southern blots; class discussion/data analysis (Southern blots, restriction maps, phenotypic analysis of yeast transformants).
Over the next few weeks we will examine secretion in the budding yeast, Saccharomyces cerevisiae. S. cerevisiae is a unicellular eukaryote that is stable as either a haploid or a diploid, which greatly facilitates genetic analysis. Because of the ease of genetic manipulation, small genome size, and economic growth conditions, it has been called the E. coliof eukaryotic cells. As a eukaryote, S. cerevisiae contains the same basic structures found in more complex organisms, such as nuclei, mitochondria, ER, and peroxisomes. If one is interested in studying basic cellular processes like secretion or mitosis, one can stick with a cheaper and simpler system that is easy to manipulate (relatively speaking). This commonsense argument has proved quite fruitful. The components and mechanisms of many systems have been first identified and characterized in yeast, and studies in yeast are continuing to be ground-breaking in many fields. Further analysis in “bigger” eukaryotes has demonstrated high conservation of mechanism—in many cases, human genes or proteins can even substitute for their yeast homologues functionally, and vice versa.
We will be working with wild-type and a few secretion-defective (sec) yeast strains. A complete blockage in secretion is lethal to the cell because the cell needs to secrete proteins in order to make a bud and divide, and to insert proteins into its membrane required for the uptake of nutrients. Therefore, the secretion defects in the mutant strains are not complete loss of function. At room temperature (25°C), cells with the mutation grow reasonably well; at 30°C, their growth may be slightly compromised; and at 38°C, they are almost completely inviable. Mutants with this type of phenotype are “conditional” or“ temperature sensitive.” Different sec mutants block secretion at different steps along the secretory pathway (i.e., import into the ER, transit from the ER to the Golgi, trafficking within the Golgi compartments, etc.). On the basis of the analysis and experiments that we perform in lab, you will be able to hypothesize what step is blocked in the secretion-defective mutants we analyze.
MINIPREP PLASMID ISOLATION
Our study requires the transformation of plasmids into the wild-type and sec mutant yeast, followed by analysis of the phenotypes of the transformed yeast cells. We will discuss the analysis and the meaning of results in the next three sessions. During those labs, we will have significant incubation times that will be perfect for discussions. Before we get to those stages, we first need to isolate plasmid DNA to transform into yeast. We will do this by doing a “DNA miniprep.” DNA minipreps are a very commonly used technique. Laboratories doing any sort of molecular biology or cloning do minipreps routinely. For lab last week, I outlined briefly the steps necessary to place β-galactosidase under the control of regulatory sequences from another gene. If you wish to read more about cloning and manipulating genes, see your text, MBoC, 3rd edition, pp. 308–330. The most relevant pages are 308–312 and 319–325. Once one has ligated the fragments of interest together (for example, a vector containing the gene encoding β-galactosidase and the upstream regulatory region of YFG), one transforms the ligated construct into E. coli, and recovers transformants.
Getting transformants means that the bacteria have taken up a circular molecule of DNA carrying resistance to a selectable marker; however, it does not indicate anything else about the structure of the plasmid. Minipreps of plasmid DNA are then performed to isolate large quantities of the DNA. It is then examined by restriction enzyme digestion followed by gel electrophoresis to determine the molecular structure of the plasmid (we will do this over the next two weeks). In addition, because our plasmids have particularly complicated construction histories, we will do a Southern blot to determine which of the plasmids has the signal sequence region of α-factor (see below). We will talk more about what Southern blots are and how they work in the future (see MBoC, 3rd edition, pp. 300–303). Finally, we will transform the plasmids into yeast.
There are three different plasmids and the role of all these bits of DNA will become clear in future weeks.
The fusion-containing plasmid. The fusion is diagrammed below:
α-factor is a mating pheromone secreted by cells to“ attract” cells of the opposite mating type. Haploid cells of opposite mating type fuse/mate to make a diploid cell. The gene fusion contains the signal sequence region of α-factor which directs the protein into the secretory pathway. The SUC2 coding sequence is acting as a linker region in this construct. HIS4 encodes histidinol dehydrogenase. The protein that gets made from this construct is a hybrid or chimeric protein containing the α-factor signal sequence, Suc2, and His4.
A fusion between SUC2 and HIS4. This construct is lacking the signal sequence; the protein that gets made from this construct is a hybrid or chimeric protein containing Suc2 and His4.
Vector. This is the plasmid backbone.
All of the plasmids are “shuttle plasmids” because they can be shuttled between E. coli and S. cerevisiae. E. coli is used as a temporary host for the plasmid for two reasons. First, the plasmid replicates to a higher copy in E. coli than it does in yeast, which allows one to isolate relatively large amounts of plasmid. Second, as explained below, the plasmid can be isolated from E. coli without contaminating chromosomal DNA. This greatly facilitates characterization of plasmids.
In addition to the region that has been engineered to encode a fusion protein, these plasmids have other features of interest. They have two origins of replication: one that functions in bacteria and one that functions in yeast. The origin allows the plasmid to be replicated by the cellular DNA replication machinery. They also have two different selectable markers which allow one to isolate the transformed organisms from the untransformed background organism. For selection in E. coli, the plasmid contains the gene encoding β-lactamase which causes ampicillin resistance. E. coli strains lacking the plasmid are sensitive to ampicillin and cannot grow on media with the antibiotic; strains with the plasmid can grow on antibiotic-containing media. For selection in S. cerevisiae, the plasmid contains the URA3 gene, encoding OMP decarboxylase, which converts OMP to UMP. Yeast strains with a mutation in their chromosomal copy of URA3 cannot grow on media that are lacking uracil; strains with a chromosomal mutation and containing a plasmid copy of URA3 can make uracil and therefore can grow on media lacking uracil.
Each group of students will do three minipreps, one for each plasmid. Remember that tubes must always be balanced in the microcentrifuge rotor.
The night before lab, I will sterilely inoculate each strain into 5 ml of liquid media with ampicillin.
THINGS TO BE AWARE OF BEFORE YOU START
Accurate pipetting is essential for good plasmid yield. For example, the volumes and concentrations of reagents are precisely calculated so that the NaOH added in Step 6 is precisely neutralized by the acid added in Step 8. Be aware of the different “stops” on the pipetteman, and excess liquid stuck on the outside of the pipette tip.
If you have questions about the pipettemen or the volumes that they pipette, please ask!
Label your tubes by writing on them with a marking pen. Labeling dots often fall off during the centrifugation steps.
Do not overmix during the isolation steps. Excessive agitation shears the single-stranded DNA. This lowers plasmid yield and increases the level of chromosomal DNA contamination.
Get into the habit of putting microfuge tubes in the rotor in the same orientation EVERY time (hinge-side out is the most convenient). In some cases, you may not be able to see the pellet of precipitate, but you will know where it is.
After some centrifugation steps, precipitate collects on the side of the tube, rather than as a tight pellet.
In general, it is much better to lose a few drops of a supernatant than to contaminate it with a precipitate.
Do not cross-contaminate your plasmids.
When vortexing, look for the “tornado” to make certain that things are well mixed. When mixing by inversion, make certain things are really mixing.
Familiarize yourself with all the steps—if you skip a step, the procedure will not work. Check things off as you go along!
PROCEDURE FOR ISOLATING DNA
Vortex or shake the culture to resuspend the cells.
Transfer 1 ml of culture into a labeled Eppendorf (microfuge) tube.
Place the tubes in a balanced configuration in the microfuge rotor. Spin for 1 min to pellet the cells.
Pour off the supernatant into a waste beaker, taking care not to disturb the pellets. Invert the tubes, and touch their mouths with a clean Kimwipe to wick away as much of the media as possible.
Add 100 μl of ice-cold GTE to each tube. Resuspend the pellets by pipetting solution in and out several times, trying not to make bubbles. Hold the tube up to the light to make certain that there are NO visible clumps of cells—the mixture should be homogeneous.
Add 200 μlof room temperature SDS/NaOH to each tube. Mix the solutions rapidly by inverting the tube about 5–6 times.
Place on ice for 5 min. The solution should become relatively clear as the cells lyse.
Add 150 μlof ice-cold KOAc solution to each tube. Rapidly invert the tube about 5–6 times. A white precipitate will form immediately.
Place on ice for 5 minutes.
Spin for 5 min to pellet the precipitate.
Transfer 400 μl of supernatant into a clean microfuge tube. Try to avoid pipetting the white precipitate. If some is transferred to the new tube, centrifuge it and remove the supernatant to a new clean tube.
CAUTION: Wear gloves, and goggles or glasses when working with phenol. Dispose of phenol in the container labeled “Phenol/Chloroform waste”.
The phenol:chloroform:IAA (PCI) is stored under a small layer of TE. To pipette the PCI, insert the tip of your pipetteman below the TE. Add 400μ l of PCI to the supernatant-containing tube. Make certain that the lid is well closed, and vortex for 1 min.
Spin samples for 5 min in the microfuge.
Carefully open the microfuge tube, and using the P1000, transfer the supernatant to a clean microfuge tube. Do not get any of the precipitate that may be at the interface or the organic phase in with the supernatant.
Add 800 μl 100% EtOH and vortex for about 10–30 seconds. Incubate at room temp. for about 10 min.
Spin for 10 min; carefully aspirate supernatant. You may not be able to see the pellet very easily—be careful!!!
Add 500 μl 70% EtOH and invert a few times. Spin for 5 min and carefully aspirate supernatant. Allow to air-dry.
When tube no longer smells of EtOH, and there are no drops visible, add 50μ l of TE.
NOTES AND DISCUSSION
What happens in each step?
Glucose/Tris/EDTA: Glucose functions to maintain osmotic pressure, which prevents the cells from lysing prematurely; Tris buffers the cells at pH 8.0. EDTA binds divalent cations in the lipid bilayer, which thus weakens the cell envelope. Following cell lysis, the EDTA is critically important in limiting DNA degradation by binding Mg++ ions that are necessary cofactors for nucleases.
SDS/NaOH: This alkaline mixture lyses the cells. The SDS detergent solubilizes the lipid components of the cell envelope and the cellular proteins. Sodium hydroxide denatures the chromosomal and plasmid DNA into single strands.
KOAc (potassium acetate/acetic acid): The acetic acid brings the pH to neutral, which allows the DNA strands to renature. The denatured DNA has remained intertwined, since both the plasmid DNA and the chromosomal DNA are circular. However, the much larger, disrupted chromosomal DNA cannot rehybridize perfectly and instead collapses into a partially hybridized tangle. At the same time, the potassium acetate precipitates the SDS from the cell suspension, along with associated proteins and lipids. The renaturing chromosomal DNA is trapped in the SDS/lipid/protein precipitate. Only smaller plasmid DNA fragments of chromosomal DNA and RNA molecules escape the precipitate and remain in solution.
Phenol/Chloroform/IAA: This step extracts additional proteins from the solution. It is particularly critical to get rid of any nucleases.
EtOH: The alcohol precipitates nucleic acids. 70% EtOH wash: This removes some remaining salts and SDS from the preparation.
Tris/EDTA: As explained above, Tris buffers the DNA solution and EDTA protects the DNA from degradation by DNAses.
APPENDIX B Secretion Lab II: Yeast Transformation and DNA Restriction Analysis
This week we will begin to analyze the miniprepped plasmids by restriction enzyme digestion, followed by gel electrophoresis next week. We will also transform yeast cells with the plasmids. We will transform both wild-type and secretion-defective strains. Remember: All the plasmids have the URA3 gene for selection of yeast transformants. The cells are mutant for their chromosomal copy of URA3 and therefore cannot grow on media lacking uracil unless they take up a plasmid. Each group of students will transform either a wild-type or a secretion-defective strain and also perform restriction digests on the three plasmids.
Both procedures have relatively long incubations—an hour each. Start the yeast transformation, and then set up your plasmid digests. It is fine if the DNA digestions incubate longer than 1 hour, but they need to incubate for at least this amount of time.
YEAST TRANSFORMATION
We will have already prepared the cells for the transformation. If you are interested in how this is done, ask!
All steps should be done with good sterile technique! The only thing that should grow on your plates are the yeast cells that have been transformed! Your skin, the bench surface, and the air all have microorganisms contaminating them. Our goal is to keep them OUT of the solutions, cultures, and petri dishes with which we will be working. We will talk about how to do this at the beginning of lab.
PROTOCOL
Aliquot 100 μl cells into microfuge tubes for each transformation. Do not forget tubes for negative and positive controls for the transformation!
Add 5 μl of carrier DNA. It is very viscous, so be careful pipetting. Vortex well. The carrier DNA acts to block nonspecific, nonproductive binding sites for DNA to the yeast cells.
Add 10 μl of your miniprep DNA. Vortex well.
Add 700 μl of 40% PEG 3300, 0.1 MLiOAc, TE pH 7.5 to each tube of 100μ l of cells. Vortex well.
Incubate for 1 hr at 30°C, vortexing the tubes for 30 sec every 15 min.
Heat shock in 42°C water bath for 5–10 min.
Collect cells by centrifugation at about 1500 rpm for about 3 min. Remove supernatant using your pipetteman (the pellet will be firmly stuck to the bottom of the tube).
Add 100 μl sterile water and resuspend cells by pipetting up and down or vortexing.
Spread cells on a selective plate. What kind of selective media will we use?
Transformants should appear after 4–5 days at 25°C.
DNA DIGESTION AND ANALYSIS
Each pair of students will digest all three miniprepped plasmids with three different restriction enzymes. Because the cloning to make these constructs was very complicated, I had a difficult time piecing together the restriction map. I will give you a map of the plasmid and the enzymes that you will digest with in laboratory.
Digest between 0.5 and 1.0 μg of DNA. This should be about 8 μl of your miniprep.
Different restriction enzymes have different salt and pH requirements for optimum efficiency. The companies that sell restriction enzymes have characterized the enzymes and send their suggestions for buffer with the enzyme. Restriction buffers are supplied as 10X stocks. Use the right buffer for each enzyme! In addition, BSA is supplied with the restriction enzymes, also as a 10X stock. The BSA helps to stabilize the enzymes. The BSA and restriction buffer should both be at a final concentration of 1X in your digestions.
You will use the following restriction enzymes:
HindIII (NEB buffer 2)
EcoRI (NEB EcoRI buffer)
PstI (NEB buffer 3)
There is a preferred order for adding reagents—always add the least precious and largest volumes first—that way if you make an error, it will be less painful.
Generally add water first, then buffer, BSA, DNA, and finally the enzyme. Restriction enzymes are incredibly expensive and quite “fragile.” Do not hold the enzyme stock tube at the bottom near the liquid—the warmth of your hand may partially denature the enzyme.
You will do 20-μl digestions. That is a very small volume! You will need to be very careful pipetting—the amount of liquid on the sides of the pipette tip can be substantial. If the volumes pipetted are not accurate, the restriction enzyme will not work optimally (and may not work at all).
It is convenient if you are doing multiple digestions to add each component to all of the tubes at once—in other words, add water to each of the tubes, then add buffer to each of the tubes, etc.
Avoid making bubbles when adding things. They can oxidize or denature the enzymes.
Mixing is critical. If the components are not well mixed, the reaction will not work properly. However, DO NOT VORTEX. This is too rough, and will denature the enzyme. Instead, flick the tube and follow with a quick spin in the Microfuge.
Always use a clean pipette tip when pipetting from the restriction enzyme stock. Contaminating the enzymes with one another or with DNA is disastrous!
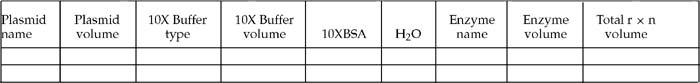
It is useful to make a table similar to the following one and check off things as you add them:
Fill in the volume that you will add of each reagent before you come to lab—the amount of enzyme that you add will be 1 μl. In lab, check off each component in your table as you add it to your tube.
Incubate for 1 hour at 37°C.
Add 1 μl of RNAse and incubate at room temperature for 5′.
Stop the reactions by the addition of “blue juice” (gel loading buffer).
APPENDIX C Secretion Lab III: Agarose Gel Electrophoresis, Southern Blotting, and Yeast Phenotypic Analysis
Reread the introduction to the first Secretion lab to remind yourself of the “big picture.”
This week we will analyze the restriction digests on your plasmid minipreps by gel electrophoresis and Southern blotting. Next week, we will probe the Southerns with a piece of DNA specific for the α-factor signal sequence region. Through these analyses, you will be able to characterize the physical structure of your plasmids.
First you will run an agarose gel with your DNA. Gel electrophoresis separates the DNA on the basis of size. The number of fragments present will tell you how many sites for each restriction enzyme exist and how far apart they are. From the maps of the plasmids provided and the sizes of your DNA fragments, you may be able to deduce which plasmid is which. For a review of restriction endonucleases and gel electrophoresis, see Alberts et al., 3rd edition, pp. 291–295.
The next part of the analysis is a Southern blot (named for Edward Southern, who first described the method). This technique is used to identify specific restriction fragments in a complex mixture. In a Southern blot, the DNA is transferred from the fragile agarose gel onto a more durable membrane that is accessible to DNA probes. The procedure preserves the distribution of fragments in the gel, creating a replica of the gel on the membrane. Read pp. 300–303 in Alberts et al., 3rd edition, to familiarize yourself with the method. Similar techniques to transfer RNA and proteins out of gels onto membranes are called Northern and Western blots, respectively (just to be clever, no one named Western or Northern developed them). In lab next week, we will hybridize the blots to a probe that contains DNA that encodes theα -factor signal sequence to determine which of the plasmids contains that segment of DNA.
PROTOCOL
Gel Electrophoresis
We will have poured the agarose gels for you so they have time to solidify before lab. The gels have EtBr (ethidium bromide) in them. When Et intercalates into DNA molecules, it fluoresces. This will allow us to visualize the DNA by using UV light after the gel is run.
Heat your restriction endonuclease digested samples to 75°C for 5 min and quick spin in the Microfuge.
Load 5 μl of the DNA molecular weight markers in the left-most gel lane.
Load your samples (∼20 μl) into the wells of the gel. Keep track of the DNA and enzyme that was digested within each of your wells. If you don't know what sample was loaded, it will be impossible to make sense of your data. Plan how you are going to load your gel before you come to class.
We will add EtBr to the running buffer.
Run gel at 100 V until the blue dye is about 2/3 of the way to the bottom.
The Et will intercalate into your DNA as well as the plasmid DNA samples. It is a mutagen because it affects base pairing and the fidelity of DNA replication. Be careful! Wear gloves and do not touch other equipment or doorknobs if you have touched the gel or running buffer.
While the gel is running, prepare for the Southern blot by cutting paper towels and chromatography paper and rereading the protocol. They should be the same size as the gel. You can also determine the expected sizes for each of your restriction digests from the maps I will give you and spot your yeast transformants (see below).
Photograph gel—put a ruler next to the gel to make it easier to determine migration distances.
Southern Blotting
It is important to do the following steps for the specified times. Make sure that you know what you are going to do next.
Do NOT touch the nylon membrane or the gel with your fingers.
After photographing your gel, put it into a small plastic container.
Pour 100 ml of 0.25 N HCl into the container.
Shake slowly for 5 min or until the blue loading dye turns yellow.
Holding onto your gel firmly but carefully, pour the HCl into the sink and rinse the gel once with deionized water from the faucet at the front sink.
Add 100 ml of 0.4 N NaOH.
Shake slowly for 5 min or until the blue loading dye turns back to blue.
Remove the gel from the box and turn it upside down (well side down) onto the smooth side (without the flap) of a Baggie (#1).
Wearing gloves and using a pencil, carefully write your group initials in small letters on the upper left corner of the nylon membrane.
Wet the membrane in the remaining 0.4 M NaOH and place it carefully on top of the gel with the side of your membrane with your initials on it in contact with the gel. Use a rolling motion to lay the membrane onto the gel so that air bubbles do not get trapped between the gel and the membrane. Air bubbles will prevent transfer of the DNA to the membrane. You can roll out any air bubbles with a small test tube if necessary.
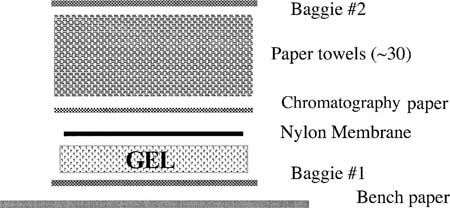
Take the pile of paper towels and a piece of chromatography paper and arrange in a pile with the chromatography paper at the top. Invert this pile on top of the membrane and put another Baggie (#2) on the top of the pile so that it looks like this from the top down:
Put one hand under the Baggie at the bottom and the other hand on top of the Baggie at the top of the stack. Carefully but quickly invert the stack so that Baggie #1 is at the top of the stack and Baggie #2 is at the bottom.
Pour the NaOH in which the gel has soaked into the sink and pour about 20 ml fresh 0.4 N NaOH into the plastic box.
Remove Baggie #1 from the top of the stack to expose the gel.
Working quickly, saturate a piece of chromatography paper in the NaOH and place it on top of the gel, again using a rolling motion so as not to trap air. The chromatography paper becomes fragile when wet, so be careful not to tear it.
Repeat this process until you have 3 pieces of chromatography paper on top of the gel.
Using a pipette, add about 5–6 ml of NaOH to the top of the wicks, forming a puddle completely covering the surface. Do not add so much that it spills over the sides.
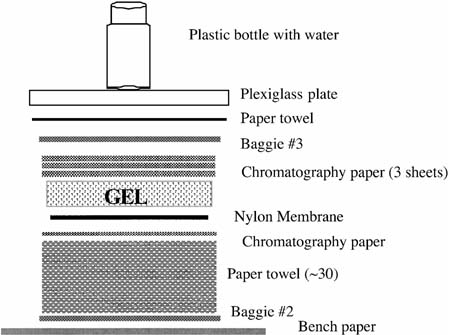
Wait about 5 min until all the NaOH has been absorbed and then cover the stack with a new Baggie (#3), a single paper towel, a Plexiglas square, and a plastic bottle with water in it as a weight. The stack should look like this from the top down:
Leave untouched for 45 min, during which time the DNA will be transferred by capillary action from the gel to the membrane. To prepare for the rest of the procedure, pour the NaOH out of the plastic box into the sink, rinse well with water, and pour 50 ml of 2X SSC into the box.
When the transfer time has ended, wear gloves and carefully unpile the transfer stack from the top until you reach the gel. Using a pencil, mark carefully through the bottom of the wells of the gel onto the membrane to mark the position of the wells on the membrane.
Carefully peel the gel from the membrane and submerge the membrane in the 2X SSC for about a minute to rinse off the 0.4 N NaOH.
Place the membrane with the initial side UP (this is the side with the DNA on it) on some new paper towels or the absorbent side of your bench paper for about 5 minutes to dry it.
Place the membrane between two sheets of chromatography paper with the initials of the lab partners on a colored dot on the outside and paperclip together.
We will store the membranes at 4°C until next week.
While your gel is blotting, you should analyze your restriction digestion data and compare it to the sizes you predicted from the maps to determine the identity of the plasmids. If you have not yet done so, you should spot your yeast transformants onto the appropriate media.
Phenotypic Analysis of Transformants
The yeast transformants will be analyzed on two different types of media. The first lacks uracil and histidine (SC-H-U) and the second lacks only uracil (SC-U). Only cells which can make their own uracil and histidine can grow on the first set of media. Each team of students will work with transformants from three yeast strains—one that they transfomed, and two other strains. There are a wild-type strain and two mutant strains. One of the mutants has a mutation in the SEC61 gene, and the other in the SEC18 gene.
To analyze the transformants, you will spot cells onto SC-H-U or SC-U plates. In addition, we will analyze the ability of the yeast cells to grow at three different temperatures: 25°C, 30°C, and 38°C.
Label your plates with your initials and the temperature of incubation in small letters. Make sure you can tell the orientation of the plate—mark the top in some way.
For each transformant that you will analyze, put 100 μl of sterile water into a labeled Eppendorf.
Pick a transformant, or a few if they are small, with a sterile toothpick, and resuspend the yeast cells in the sterile water by wiggling the toothpick.
Repeat for all the transformants to be analyzed (you need to do at least one transformant with each plasmid for each strain (3 plasmids × 3 strains = 9); it would be best to do two or three transformants per strain and per plasmid if possible).
Arrange the plates to be spotted on the grids provided and determine where you will spot your cells. Write down what cells are going into a given numbered spot on the grid.
Vortex a sample, and then remove 5 μl and spot it on a plate. Do all 6 plates with that sample of cells in a row using the same yellow tip.
Repeat with the rest of your transformants.
Plates will incubated at the appropriate temperatures and will be available for analysis in lab next week.
APPENDIX D Secretion Lab IV: Probing Southern Blots and Yeast Phenotypic Analysis
APPENDIX E Ideas and Questions for the Secretion Lab Write-Up
Here are some questions and ideas that may help you to write your lab report. These are not necessarily in the order that you will discuss them in your paper—I have organized this primarily by topic/week, not by sections of the paper. Consequently, the answers to some of the questions for a given week belong in the Results section, some belong in the Introduction, etc.
The absolute maximum length of the paper should be 10 pages of double-spaced text (not including figures) with 1-inch margins all around. We will not read more than this. Please do not use a tiny font size to get around this limit. It will make us grumpy. There have been great “A” papers with 7 pages of text. Don't forget to put your name only on the back of the report like you did for the enhancer trap lab—we would prefer to grade them with your identity anonymous.
General background.Do you understand what was meant by the statement“ The secretion-defective mutant strains are conditional”? Why is this important? Did you expect the sec61 and sec18 mutants to behave differently from each other in your phenotypic analysis? Why or why not? Could the fusion constructs that we used be used to isolate mutants that are defective in the secretory pathway? Why or why not?
Minipreps of plasmid DNA/restriction analysis/southern blots. What will be included in the Results section of your write-up from this set of experiments? Can you describe the basic differences and similarities between the three plasmids? What was the goal of the restriction digests? Of the Southerns? Which miniprep corresponds to which plasmid and how did you determine this?
If you are not certain about how restriction enzymes work or how DNA fragments are resolved on agarose gels on the basis of size, please review Alberts et al., pp. 292–295.
The restriction analyses may NOT be wholly compatible with the map that I have given you. I honestly tried to draw the best map that I could given the explanation of the plasmid construction found in relevant publications and the maps that were constructed by last year's class. However, it was quite complicated, involving a number of intermediate steps with plasmids that were not very well described. It is quite likely that you will have to modify the map to make it consistent with data we have gathered in the lab. In other words, if the restriction digestion of the plasmid is complete and the sizes or numbers of bands do not correlate with what was expected from the map, it is the map that is incorrect, NOT the restriction enzyme. Fragment sizes for unknowns can be estimated by interpolation between the marker bands of known molecular weight. Scientists often use standard curves generated from the molecular weight markers. You may do this if you like; alternatively you may interpolate between the markers by “eye.”
If necessary, please include a modified map in your lab report. I have put the Canvas file with the map I handed out in lab on the class server if you wish to use it. The best modified maps will include data from all three digests and your Southern blot. You can use your Southern blot to determine which fragments in the pRSB204 digests contain sequences from theα -factor gene.
Although I am not positive about the exact maps, I am certain about the relationships among the plasmids. Both pRSB203 and pRSB204 have inserts of yeast DNA into the plasmid vector YEp24. Therefore, all three plasmids should have some fragments in common, and some fragments that differ. Plasmid pRSB204 was constructed from pRSB203 by deletion of one segment of pRSB203 and insertion of DNA from a different plasmid that contained the alpha-factor signal sequence. Thus, these two plasmids should have more fragments in common than either one does with the vector, and the differences should map only to the promoter/signal sequence section of the fusion construct. The numbers on the maps are the numbers from the DNA sequences of the different segments. Because the fragments are from different pieces of DNA, the numbering is not continuous. If you wish to find the size of a fragment that spans a segment boundary, you will have to calculate the size of both fragments that span the boundary. If you discuss the presence or absence of specific bands, make sure that it is straightforward for a reader to know which bands are being referred to in the text (perhaps by labeling them on the figure?).
Yeast transformation. What are your results for this section? How will you present the data? What were the positive and negative controls for the yeast transformation?
Phenotypic analysis. For this section, which plasmid is the negative control, which is the positive control, and why? What are your results? How will you present the data? Which strain is wild type, sec18, and sec61 and how did you determine this? Did your results match your hypotheses?
General notes. The paper should be able to be understood by someone who has had a cell biology course at some point but has not necessarily done these experiments (for example, someone who took cell biology a different year, or at a different institution).
For materials and methods, you need describe only deviations from or additions to the protocol given out in lab.
A complete laboratory report will have information in the introduction or discussion from at least one source other than your textbook or my lab handouts. Connect what you learn from reading that source to the material in your introduction or discussion. A WWW citation may be useful, but it is not sufficient to fulfill this criterion.
This lab report may have the most data about which you have written; and your results may not completely match your original hypotheses (found on the table you filled out for the last week of experimentation). Make certain that you organize your thoughts and writing. Most likely, some of the sections will need subheadings. Your Introduction and Discussion may “flow” without the use of subheadings, but scientific papers frequently have subheadings for clarity in the Methods and Materials, and Results sections.
Carefully read over the comments on your Drosophila enhancer trap lab and chloroplast lab to see where you need to improve your writing or analysis. Papers should be carefully proofread before submission. Also, W.A.'s are on staff at the Writing Center should you want help from an expert.
APPENDIX F Ideas and Questions for the Secretion Discussion
Here are some questions and ideas that may help you to focus your thoughts on the secretion lab series. These are not necessarily in the order that we will discuss them.
The goal for our discussion is to allow you to demonstrate your understanding of the set of laboratories we have done on secretion. I encourage you to talk with each other or to your friends about the laboratory to practice. As I discussed, being able to explain things orally to others is a skill that is important in most careers, and this discussion session will allow you to have some more experience with this sort of task. In addition, students in the past have found writing a laboratory report on this lab series very time consuming and stressful, and I am hopeful that this exercise will seem less onerous to you, while still allowing me to probe your understanding of the material.
I will have some questions that I will ask you. Jocelyne and Darlene Bramucci will be present during the discussion to help record your answers for the purposes of grading. You may bring with you photos of your data with figure legends (for example, the pictures of your gel, your plates, etc.). You should be able to explain how you generated the data, what the data suggest, and your interpretation of them. Annotating things carefully and evaluating what you should bring is an important part of preparing for our discussion.
Plasmids: minipreps of plasmid DNA/restriction analysis/Southern blots. Can you describe the basic differences and similarities between the three plasmids? What was the goal of the restriction digests? Of the Southerns? Which miniprep corresponds to which plasmid and how did you determine this?
If you are not certain about how restriction enzymes work or how DNA fragments are resolved on agarose gels on the basis of size, please review Alberts et al., pp. 292–295.
The restriction analyses may NOT be wholly compatible with the map that I have given you. I honestly tried to draw the best map that I could given the explanation of the plasmid construction found in relevant publications and the maps that were constructed by last year's class. However, it was quite complicated, involving a number of intermediate steps with plasmids that were not very well described. It is possible that you will have to modify the map to make it consistent with data we have gathered in the lab. In other words, if the restriction digestion of the plasmid is complete and the sizes or numbers of bands do not correlate with what was expected from the map, it is the map that is incorrect, NOT the restriction enzyme. If necessary, you may bring a modified map with you to our discussion. I have put the Canvas file with the map I handed out in lab on the class server if you wish to use it.
Although I am not positive about the exact maps, I am certain about the relationships among the plasmids. Both pRSB203 and pRSB204 have inserts of yeast DNA into the plasmid vector YEp24. Therefore, all three plasmids should have some fragments in common, and some fragments that differ. Plasmid pRSB204 was constructed from pRSB203 by deletion of one segment of pRSB203 and insertion of DNA from a different plasmid that contained the alpha-factor signal sequence. Thus, these two plasmids should have more fragments in common than either one does with the vector, and the differences should map only to the promoter/signal sequence section of the fusion construct. The numbers on the maps are the numbers from the DNA sequences of the different segments. Because the fragments are from different pieces of DNA, the numbering is not continuous. If you wish to find the size of a fragment that spans a segment boundary, you will have to calculate the size of both fragments that span the boundary. If you discuss the presence or absence of specific bands, make sure that it is straightforward to explain which bands are being referred to in the text (perhaps by labeling them on the figure?).
Yeast transformation: What are your results for this section? What were the positive and negative controls for the yeast transformation?
Phenotypic analysis: For this section, which plasmid is the negative control, which is the positive control, and why? What are your results? Which strain is wild type, sec18, and sec61 and how did you determine this? Did your results match your hypotheses?
Big picture: Can you describe the basic steps that are important for the import of proteins into the ER and their transit through the secretory pathway? What are the roles of Sec61p and Sec18p in cells? Do you understand what was meant by the statement “the secretion-defective mutant strains are conditional”? Why is this important? Did you expect the sec61 and sec18 mutants to behave differently from each other in your phenotypic analysis? Why or why not? How could the fusion constructs that we used be used to isolate mutants that are defective in the secretory pathway?
FOOTNOTES
Monitoring Editor: Frank Solomon
ACKNOWLEDGMENTS
I thank Randy Schekman for generously supplying a number of strains and plasmids, Richard Gardner for helpful advice in scoring the HOL1-1 mutation, and Mark Rose for strains and encouragement. Fred Volkert suggested the “upside-down” Southern blotting procedure, and Karen Malatesta developed it for laboratory exercises at Princeton University and was kind enough to share it. Jingdong Liu of the University of Utah developed MacPlasmap and generously distributes it as shareware. It was used to draw the plasmid maps found in Figure 1. Jocelyne Noveral and Darlene Bramucci have been instrumental in helping the development of this laboratory and increasing student understanding, Gwen Rivnak has made much media and many reagents, and Amy Vollmer's encouragement and constructive criticism greatly helped me improve the manuscript. I especially thank Swarthmore students enrolled in Bio21 and Bio14 for their enthusiasm, constructive criticism, and love of learning.